
F: Any Direction, So Long As It’s Sideways
 By
Levi
The Paint Line
In 1909, by his own account, Henry Ford announced that the Model T would be his only model, and remarked: “Any customer can have a car painted any colour that he wants so long as it is black.” He added, “I cannot say that any one agreed with me.”
Back then it really was Ford’s way or the highway. Limited choices against the demand of the crowd for the new, readily available technology of the automobile gave him the power to dictate those terms.
One Color
More than a century later, the crowd offers Ford’s stock in one color: sideways. Well, if one were to look at the chart, it does seem like sideways gorp with no discernible trend. But if one zooms in to the underlying structure and the subwaves, the crowd behavior becomes apparent. As well, favorable risk vs reward opportunities surface.
Many will look at semis or the QQQ’s or even the SPX in certain phases and see near parabolic moves. (F) appears nearly pedestrian in comparison. Yet, there are great setups along the way that can garner gains. We read the crowd’s behavior through the Elliott Wave lens, using Fibonacci measurements to map where price is likely to turn.
The Round Trip
This year, Ford ran from a March 30 low near $11 to $17.78 on May 29, then gave nearly all of it back. The spark that claimed responsibility was Ford Energy, its new battery storage business: on May 13 the stock posted its biggest one-day gain in about six years.
In StockWaves Zac Mannes was closely tracking (F) in the spring. His primary read was that price should reach the $16-$17 level from the $11 area, but perhaps it would take several months. Perhaps the narrative catalyzed the move as it did indeed reach that target area but in just weeks instead of months. In the middle of May with price at the $15 area he began to warn that the next move would likely complete all of the rally structure.
In late October, Ford beat third-quarter estimates and raised the low end of its full-year guidance for the third time this year. The stock bounced, then rolled over again.
Sentiment rather than headlines was driving Ford. Zac’s chart was communicating exactly that type of a move — a corrective bounce followed by another low.
The Company
Path forward: I’d say Ford Pro and then recurring revenue from software and fleet services will be driving the narrative ahead. Active paid software subscriptions passed 1.7 million through September, up more than 40% from a year earlier.
Dividend: Ford declared another 15-cent quarterly dividend with its third-quarter results. It can provide a buffer of confidence but would not be the main reason to enter a trade.
Risk in the filings: Ford’s full-year guidance does not include new or revised U.S. tariffs announced after October 28.
The Charts
The first chart is Zac’s 6-hour chart from October 27. It shows the rally from the April 2025 low as wave (1), topping at $17.78, and the decline since as wave (2). The second is his 1-hour chart from November 16, zoomed in on the decline since late July.
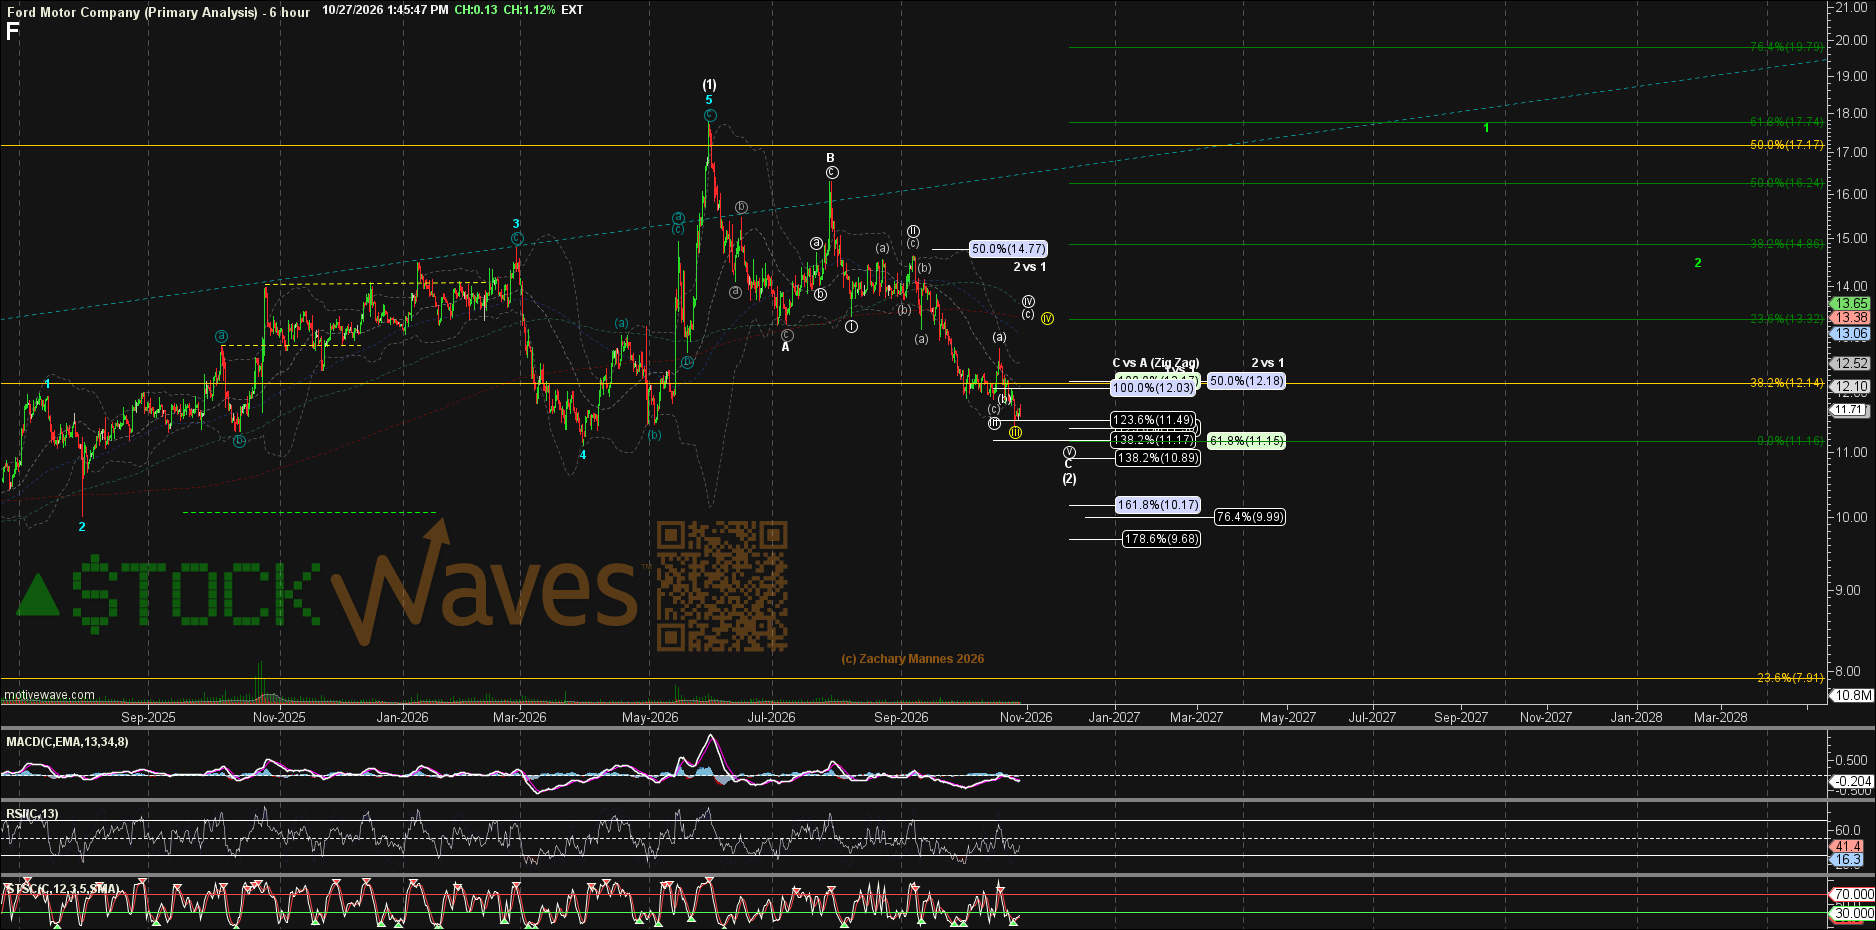
The $11 area again looks like it will set up a base from which Ford may again attempt another launch higher. This current decline is structured as a non-overlapping diagonal. There may be one more squiggle left over as the (b) and (c) of circle ‘v’ of C of (2) complete. So, the last leg down may need one more small bounce and dip before it finishes. Or, a direct move to the target area at $11 could complete all of the correction.
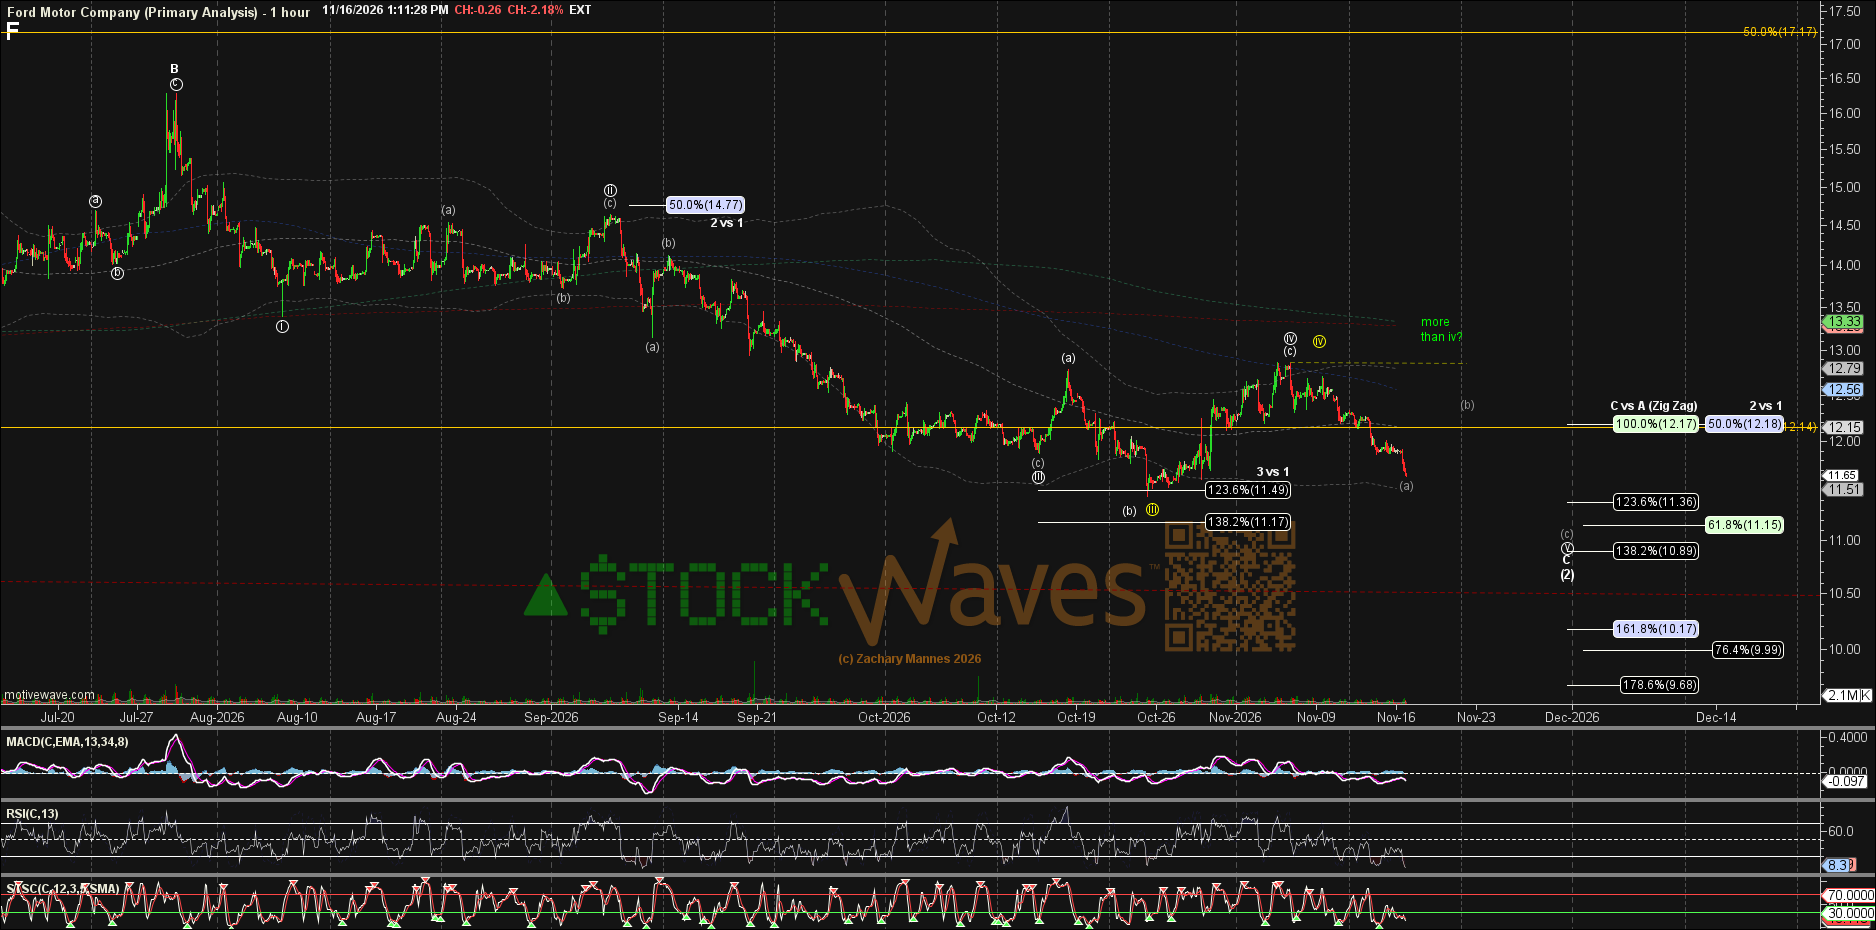
Zac’s support zone, $10.89 to $11.15, brackets the $11.11 low from this spring. It can be a prior area of demand that is being retested. When a stock like this declines from $17 to $11 again, the crowd tends to get bored and set it aside right as it is priming for another move higher.
The Setup
The entry from the next low would be countertrend and looking for a reversal. That is not necessarily a bad trade. It just has to fit your own trading plan and risk profile.
One could enter long at the completion of the anticipated correction and hedge. Or they may wait until more evidence builds that a low is already in place, such as a move back above $13 and then set up the pullbacks as buys.
Risk would be the technical invalidation level at the bottom of wave 2 at $8.44, although moving below $10 would be the first near-term signal that this is not as bullish as it appears just yet.
The Next Color
Ford brought colors back to the Model T in 1926. Some models came in green, maroon or gray, still on black fenders. If this is a 1-2 setup of a larger wave (3), then there is significant upside possible, perhaps to as much as $18 next.
Maybe some green will replace the doldrums of the sideways black.
