Eyeing Lower Levels On Nasdaq Ahead Of Next Break Above ATH's
 By
By
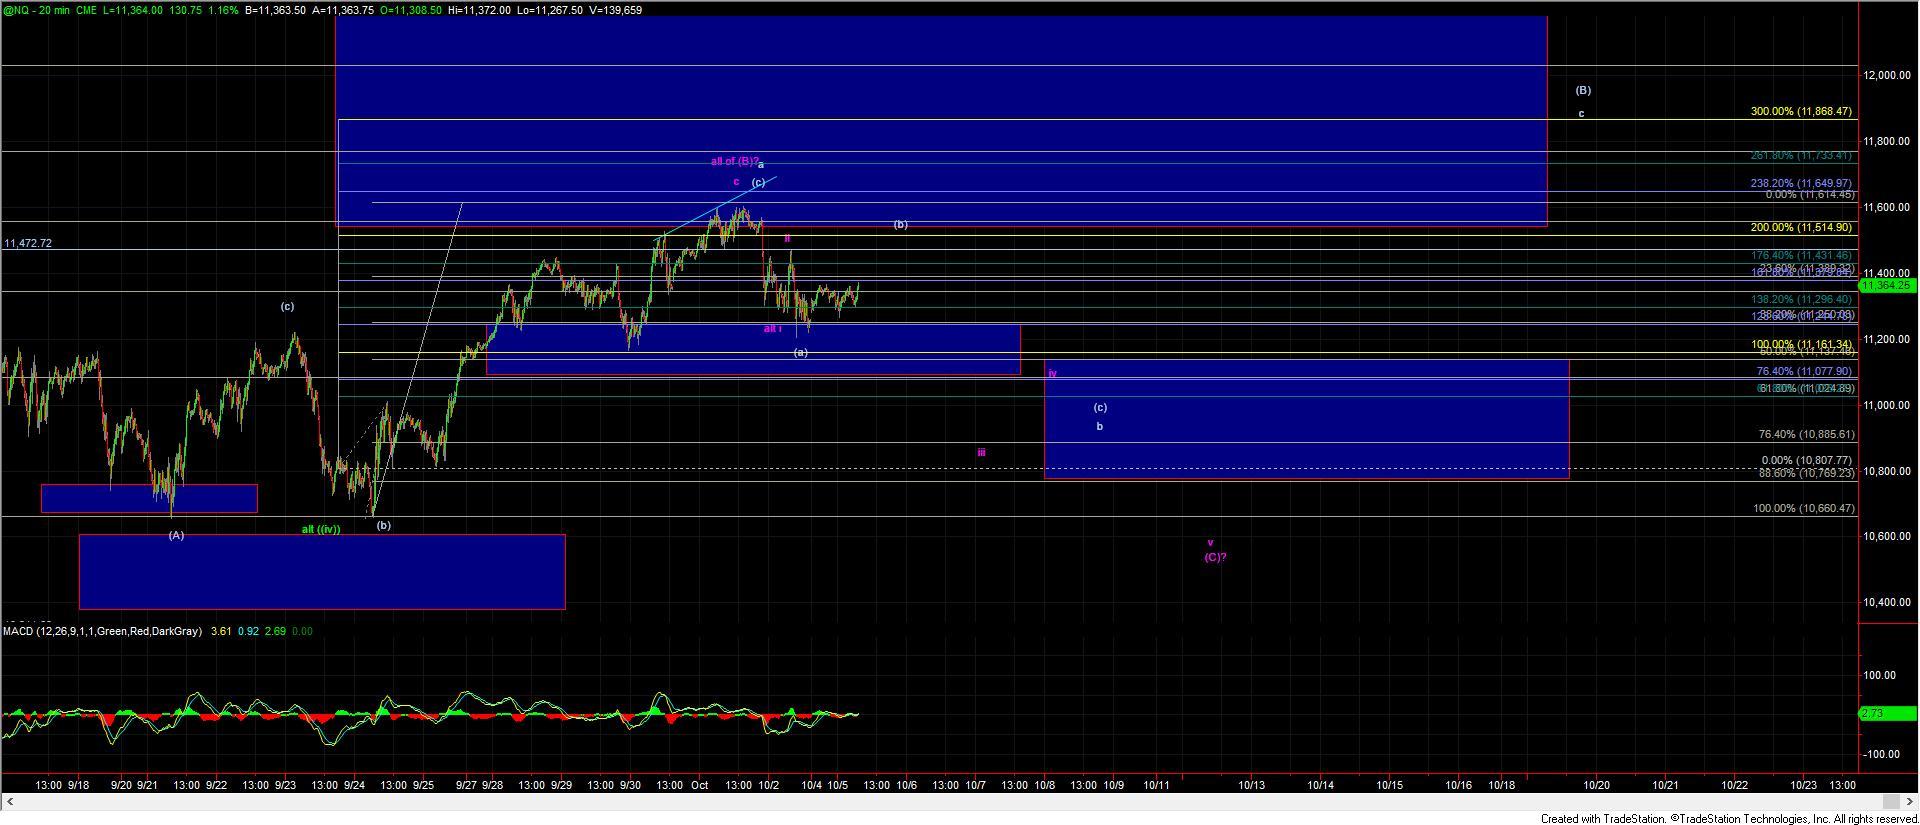
Last week I was watching two paths on the Nasdaq futures (NQ) chart, which were shown in purple and white on my charts. This morning both of those counts are still valid here and will remain that way as long as the NQ holds under the 11,472 high.
Both of these counts are suggestive that lower levels will be seen before we break back up over the all-time highs, as both suggest that we are in a b wave retrace that should see lower levels into the later part of the fall.
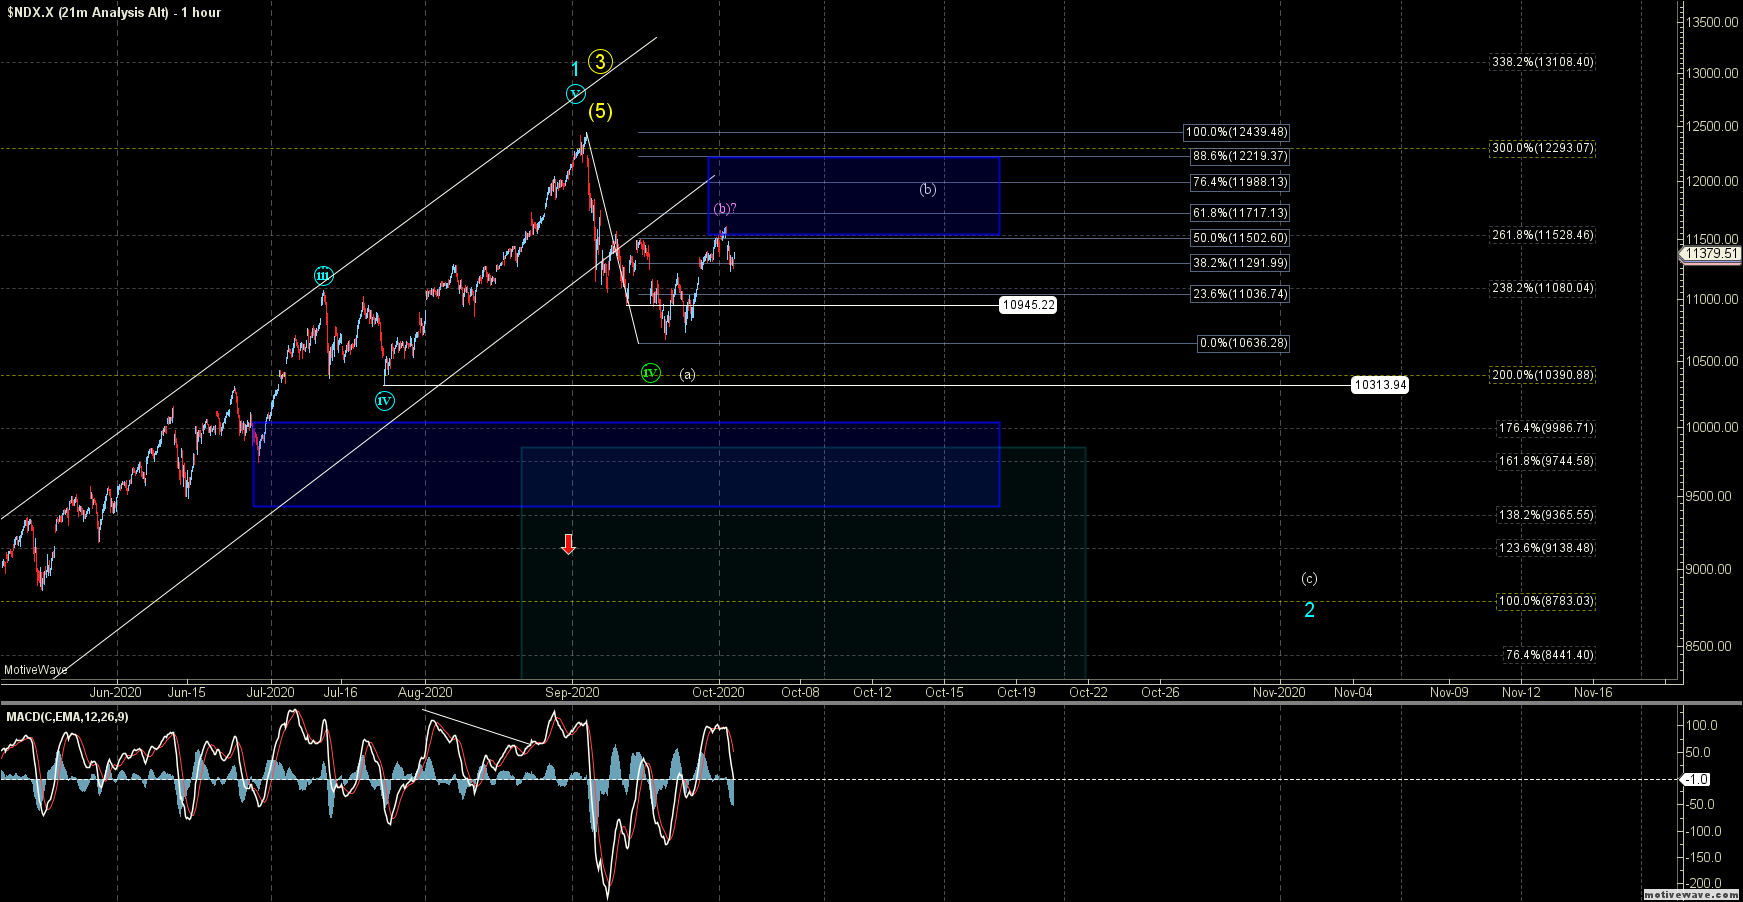
The big question, and the difference between the two paths, is that the purple count suggests we have already topped in that wave (b), whereas the white count suggests that we still need a break back up over the 11,614 high for a deeper wave (b) prior to breaking down in that larger wave (c).
While both of these counts are still valid here, I am leaning towards the white count at this point in time, as I think it still fits best with what we are seeing on the other equity charts and it also may fit with the potential timing catalyst coming up in early November.
I am, however, keeping an open mind to the purple count, and should we see a break of the 10,769 level, the purple will likely become the primary path forward. For now, though, I do still expect to see further sloppy action and for this to take some more twists and turns prior to finding either a major bottom or significant top.