Exxon Mobil: Has The Energy Run Out?
 By
Levi
By
Levi
- After being feted and fawned over as the darling of 2022, have (XOM) and the energy sector rally run out of juice?
- We update our viewpoint on the entire energy sector, including (XOM).
- Lyn Alden provides commentary and fundamental analysis. What about recession risk in 2023?
- Here are the key price levels in (XOM) to watch for support and an ultimate upside price target farther out in time.
by Levi at StockWaves; produced with Avi Gilburt
Right out of the gate let’s just say that we see the entire energy sector as reaching for much higher highs over the next several months. This viewpoint has not changed since we initially became unabashedly bullish all things energy in the Fall of 2020.
First, a quick recap thanks to our lead analyst, Zac Mannes. Today, in our main trading room, Zac posted a comprehensive review of the track energy has traced over the last 16 months. Here are some brief snippets from that comment:
“StockWaves has always followed the Energy sector closely, but even more so since the 2020 lows. While many might have known that (XLE) needed a retrace after ripping >100% to the upside from that March low, few saw a deeper retrace looming from that August. True, the July 2020 low was technically enough for all of a pullback, many of the names we follow clearly looked like merely b-wave bounces inside a wider and deeper consolidation. Sure enough, the sector faded further into Sep & Oct 2020 to our targeted support. It was at this point that Garrett & I became exceedingly bullish on the Energy sector for what should AT LEAST be a measured move equal or greater than that first move off March 2020.
Fast forward to December 2020 and (XLE) and (XOP), along with many of the key components we follow, had the makings of 1-2 start inside a much larger 3rd wave. We highlighted many of our favorite examples in this article here:
https://seekingalpha.com/article/4397923-riding-stock-waves-update-on-energy-sector
It was not until May 27 that I made a Special Update and even there said, ‘We have now started to raise awareness for our subscribers that we are heading into thick resistance as the confluence of Fibonacci price levels for the targets for most of those moves. There is still room for extensions, but the risk SKEW is no longer very favorable.’
You might not recall, but the sector only managed to creep a little higher from May 27 into early June and then dropped -30% which we counted as the "A" wave of [4] and were then looking for a B-wave bounce. Many members not only trimmed huge profits at the end of May and into early June but some even entered some speculative short positions based on our charts that did fantastic on that first sharp drop.”
So, where are we now? Let’s continue our journey with a current snapshot of the fundamentals.
Fundamental Analysis With Lyn Alden
Here is Lyn’s recent commentary:
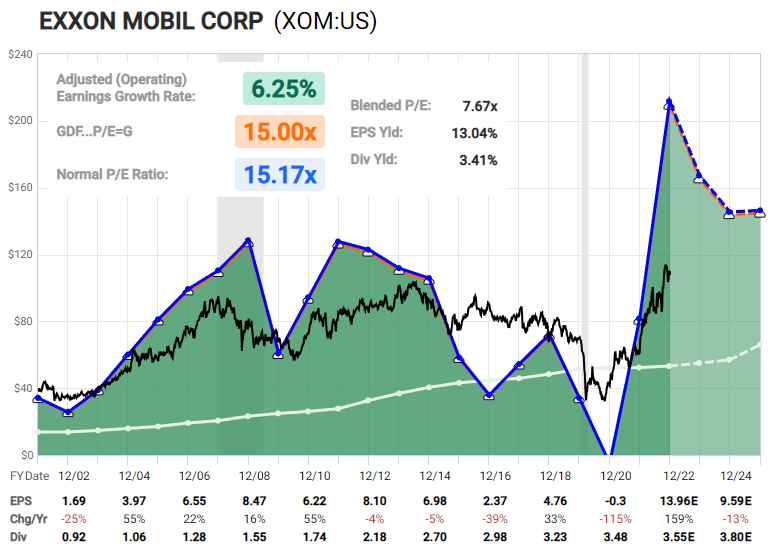
“The long-term fundamentals for many energy producers look great. The global oil and gas market is likely undersupplied, and the equity valuations of producers have not fully reflected the recent increases in cash flows and balance sheet strengthening for most names.
(See Fast Graph)
However, I am very uncertain for the year 2023, due to recession risk. I would point towards technical analysis if someone wants to try to trade them, or for risk management purposes.
In general, the US majors like XOM and CVX are reasonably-valued, but there are better values in smaller companies, in large Canadian companies, and in other global producers.”
The Technical Picture
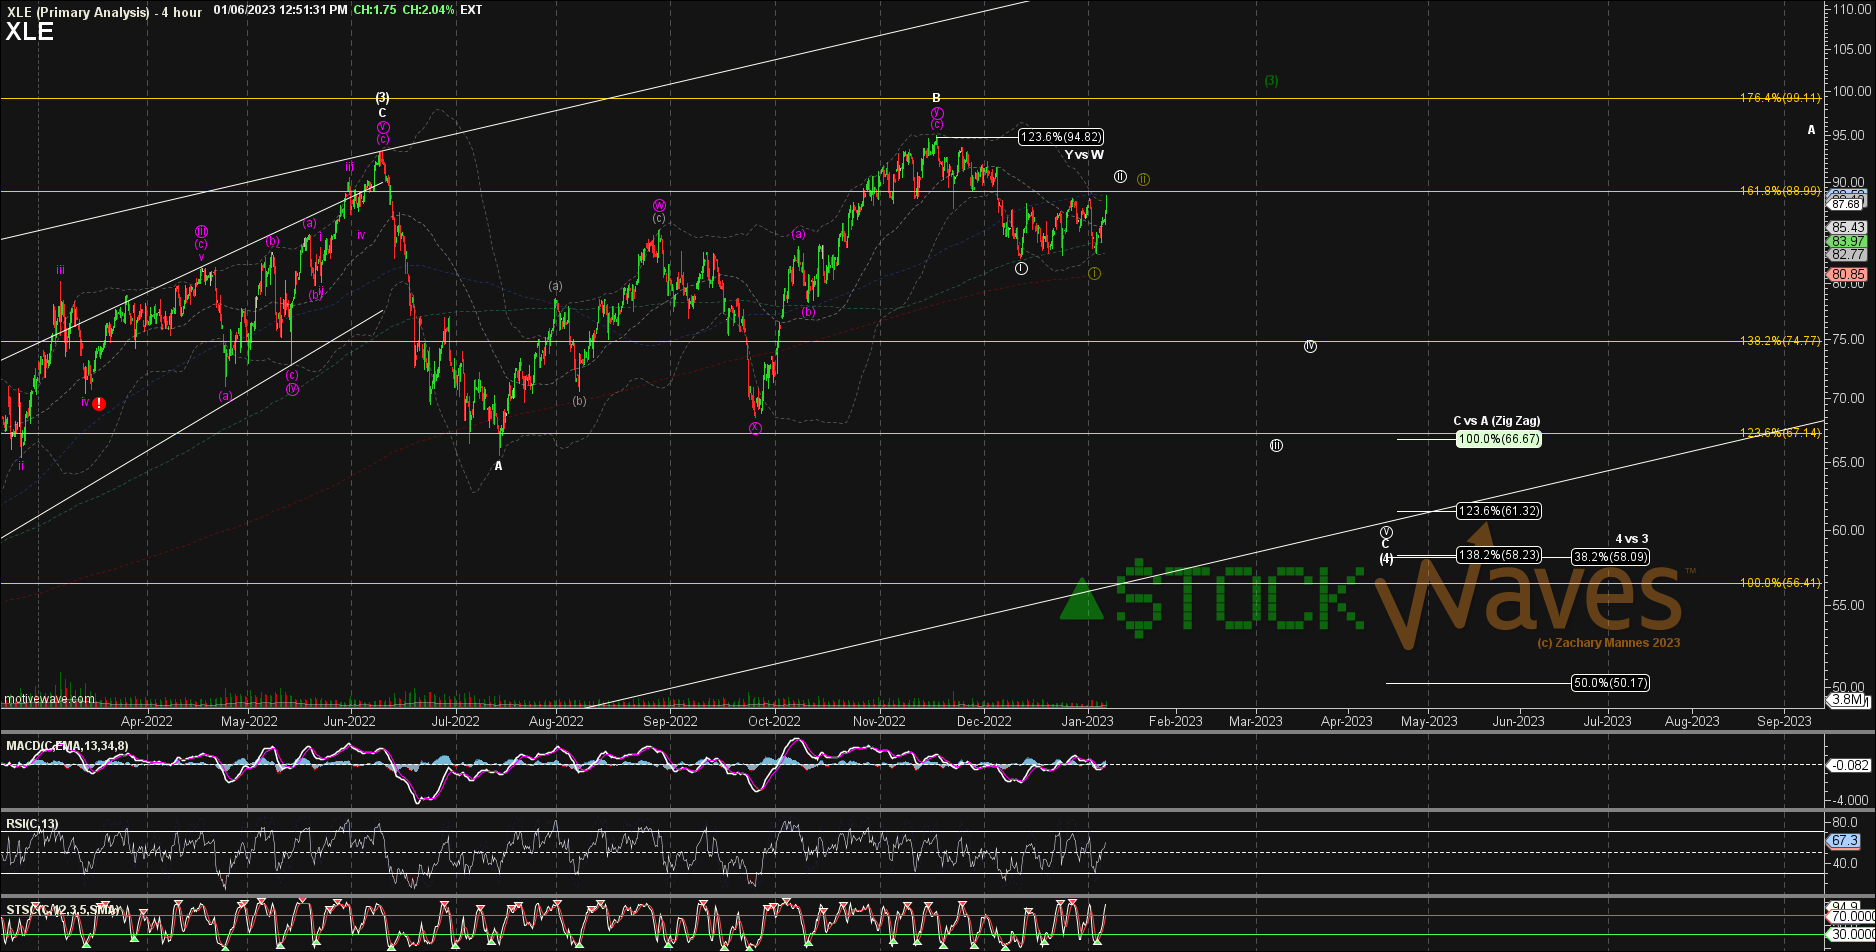
(See Zac XLE 4h)
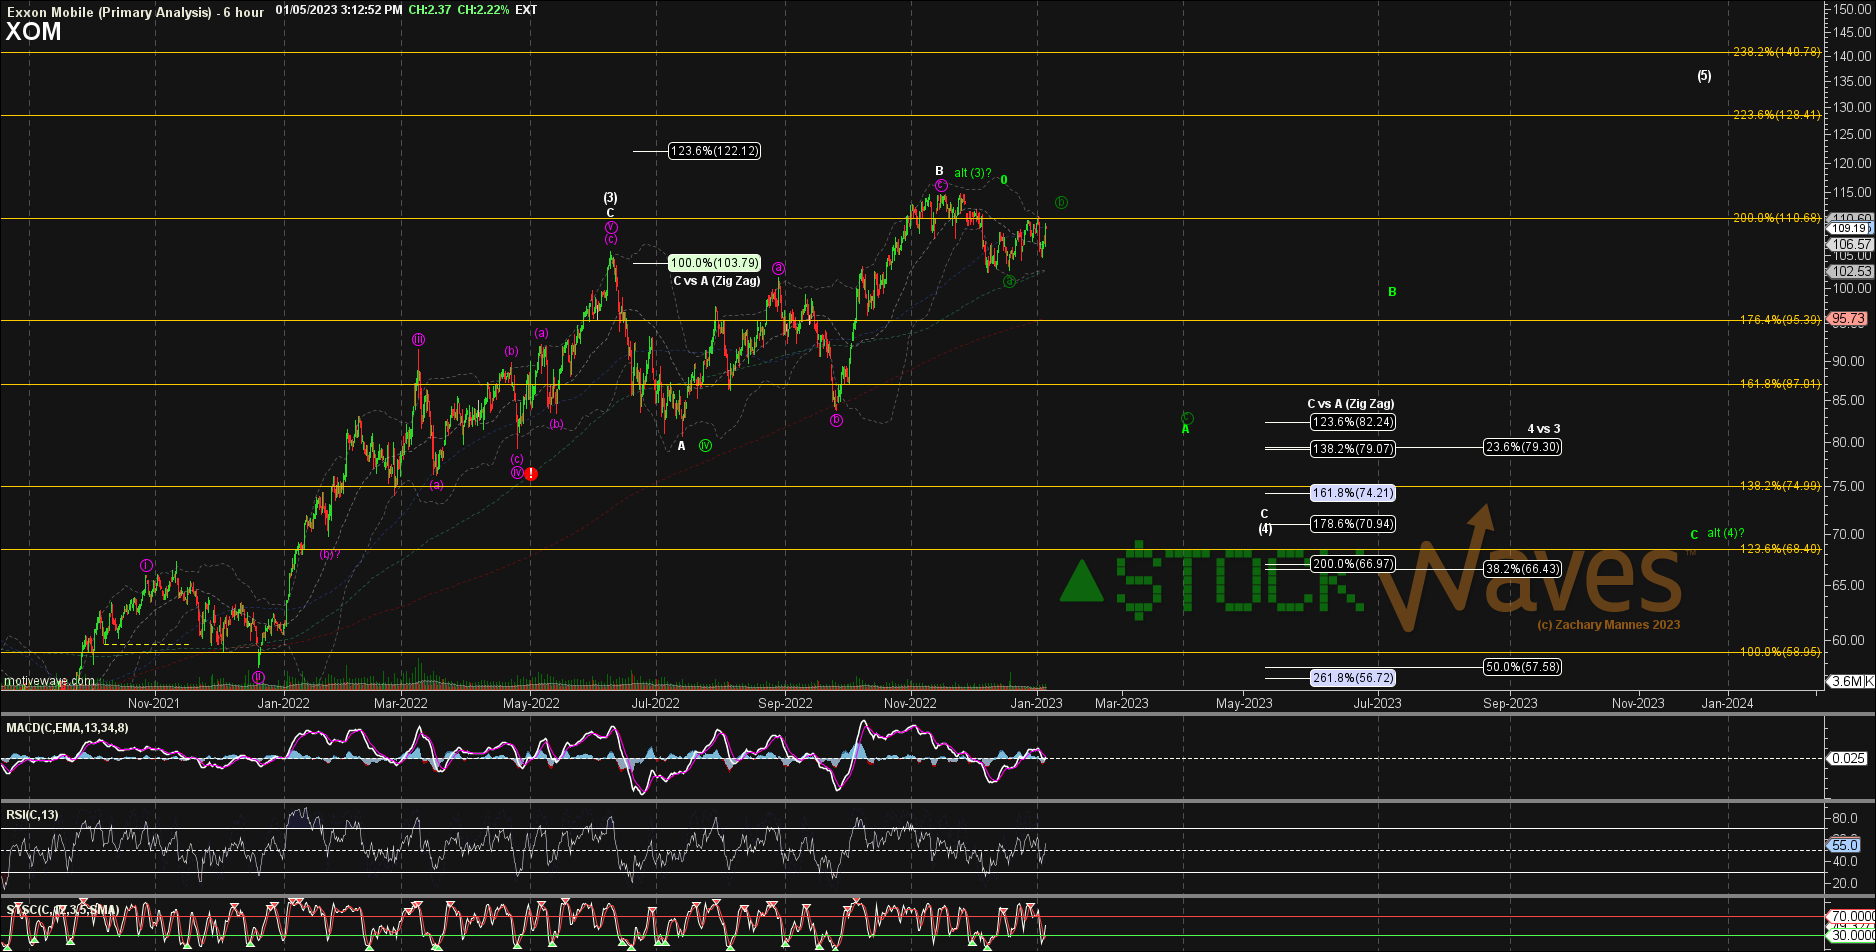
(See Zac XOM 6h)
As you can see in the attached charts, we are projecting much higher prices for most of the energy sector. But, first, the highest probable path we see in the near term is for more of a corrective structure.
Yes, in time, (XLE) could see $120+ and (XOM) has a structure that could point to as high as $140+. So, why do we see lower as the higher probability first?
Markets Are Fractal In Nature
What does this mean? Basically that there are specific and repeatable patterns that form at all time intervals. While no analysis method is infallible, we have come to observe over years of in-depth study that Elliott Wave analysis, when probably applied, is an amazingly accurate tool with dynamic adaptability to what the markets produce in their structure of price.
Detractors often decry the inherent subjectivity that seems to be apparent in some practitioners of Elliott Wave. Some believe that the the technician will simply explain what has happened in the past and then change the Elliott Wave count to fit his own preferred narrative.
Enter Fibonacci Pinball
Please allow me to share some comments from Avi Gilburt regarding how Fibonacci Pinball was observed and developed:
“While I was learning Elliott Wave on my own, I was trying to obtain a more ‘track-able’ and ‘tradable' understanding of the fractal nature of the markets. This is probably what many struggle with the most. Specifically, it is when we say that within a 5 wave move, each impulsive wave breaks down further into 5 waves each, with some waves becoming extended.
Well, after much analysis and observation, I identified a standardized method to trade waves 3-5, once waves 1 and 2 were in place. Now, remember that this is a standardized method that is a most common phenomenon in the market, but markets can and do vary from this standardized presentation. In fact, when we deal with commodities or the VXX, often, we see extensions that far surpass the standardized extensions I present here. But, again, this scenario is seen very often in the markets and individual stocks, so I believe it is worthwhile to have a basic understanding of this structure to build upon.
This is something that I observed within the Elliott Wave structure, and have adapted it to a trading methodology, which I lovingly call Fibonacci Pinball.
Since 3rd waves in the Elliott Wave structure are the strongest and most powerful of all the waves, it is the ideal wave to trade. Furthermore, since 3rd waves themselves have to be composed of 5 sub-waves, it helps us determine how we trade this structure in a relatively low risk manner. Let me explain.
After the market or stock finds a bottom after a correction, it begins a new uptrend. Such uptrends take the form of a 5 wave Elliott Wave structure, as represented by the two attached charts. And, since I hope most of you can count to 5, the general chart does not need much explanation.
However, what I do want to point out is that each of the impulsive waves – waves 1, 3 and 5 – are all comprised of 5 waves each, and waves 2 and 4 are comprised of 3 waves each. So effectively, each impulsive wave can be further broken down to a 5 wave structure ad-infinitum. This is what we mean by the fact that the market is fractal in nature. It means that the patterns are self-similar at all different degrees of scale.
Now, since wave 3 is subdivided into 5 waves, and once we have waves 1 and 2 in place, it makes trading the rest of waves 3, 4 and 5 relatively easy to prognosticate in a standard impulsive wave. This is what I refer to as Fibonacci Pinball.”
How We Use Pinball To Track And Trade The Energy Sector
It was the completion of a larger structure of price that led us to turn so bullish in the Fall of 2020. Then, the initial waves 1 and 2 up provided us with high-probability targets for the 3rd wave. We see this wave as complete. Yes, there is the chance that the 3rd wave has not yet found its high, but we view that as a lower probability. Why is this?
As shown on the charts attached in this article, the move down from what we are counting as wave [3] has been 5 waves. The bounce from there has been 3 waves. This is a classic setup for another 5 wave move down to support.
We can establish key support for (XLE) at $66 - $72 with as low as $58 possible. (XOM) has support at $87 - $89. However, what is more important is the structure of price from current levels. To sum up what we are looking for: 5 waves down from where we find ourselves now should complete this corrective move and set us up for the next launch in the energy sector.
Final Thoughts
There are many ways to analyze and track stocks and the market they form. Some are more consistent than others. For us, this method has proved the most reliable and keeps us on the right side of the trade much more often than not. Nothing is perfect in this world, but for those looking to open their eyes to a new universe of trading and investing, why not consider studying this further? It may just be one of the most illuminating projects you undertake.