Extreme And Dangerously So
To call this move in gold now “extreme” is beyond an understatement. Moreover, not only did we get the spike out of the channel in continuation of this parabola, but it has even accelerated further, which now places us in what I believe to be a dangerous environment. These types of moves usually end with a VERY strong reversal and drop to the region from which this diagonal began.
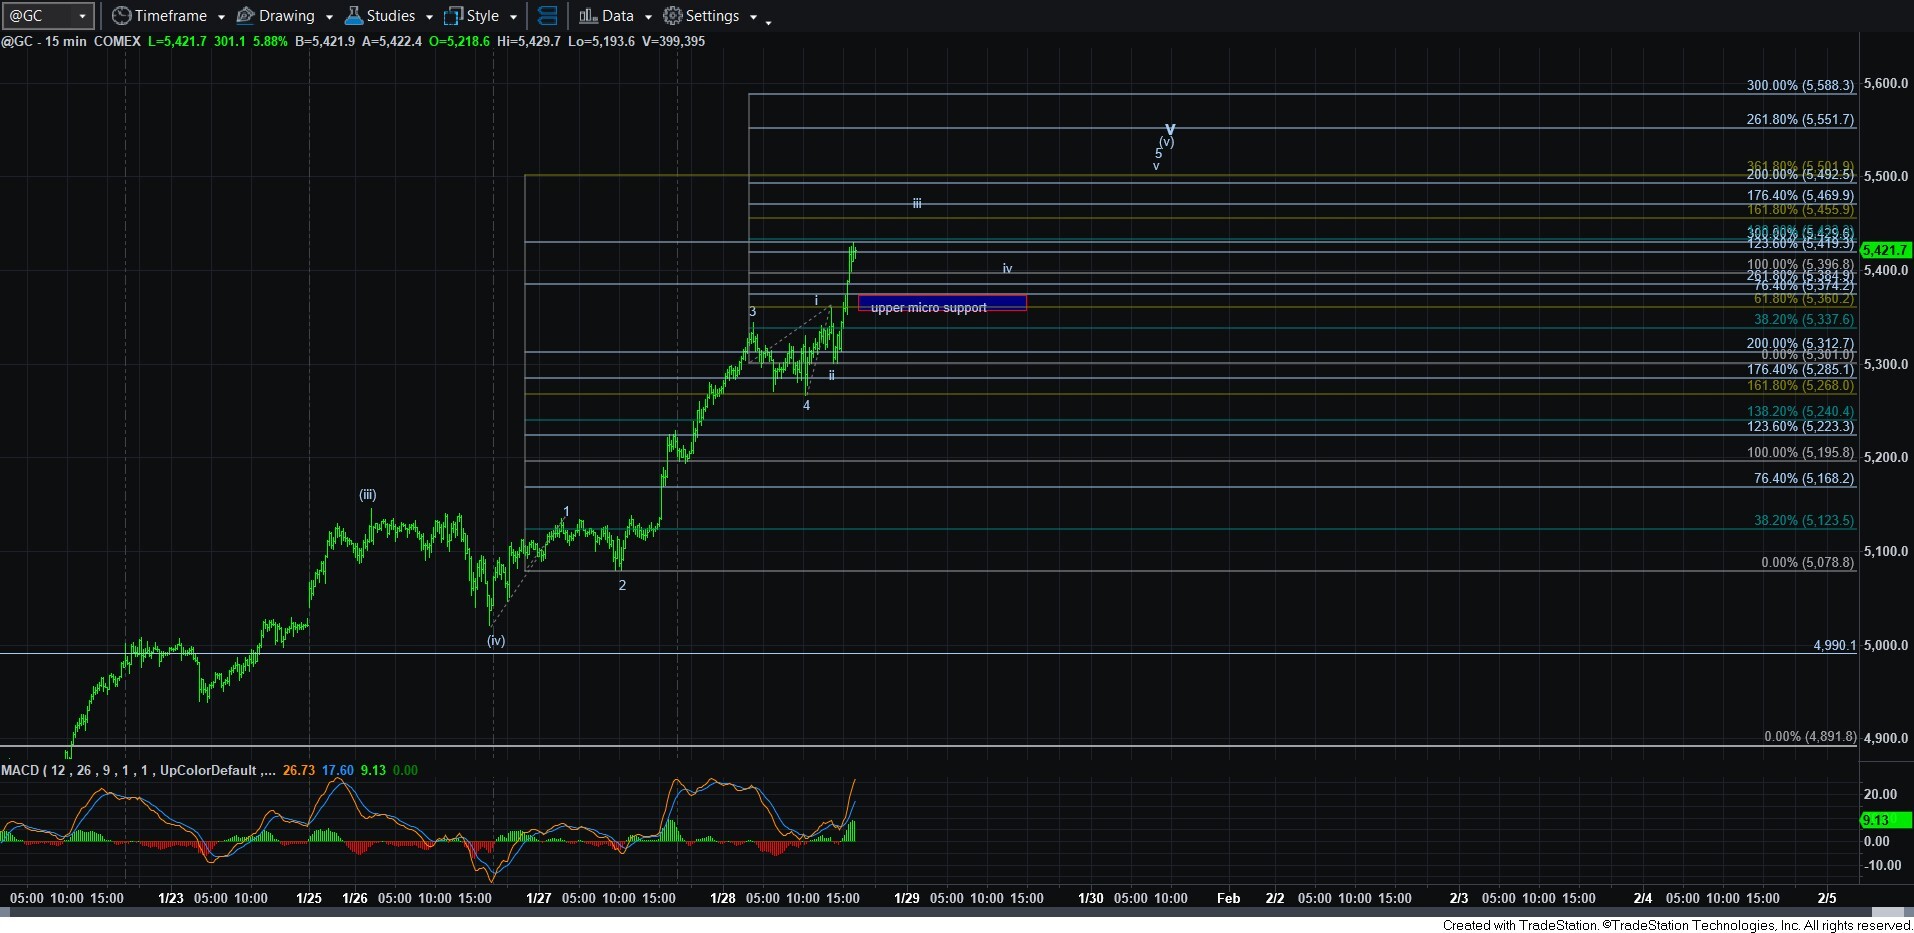
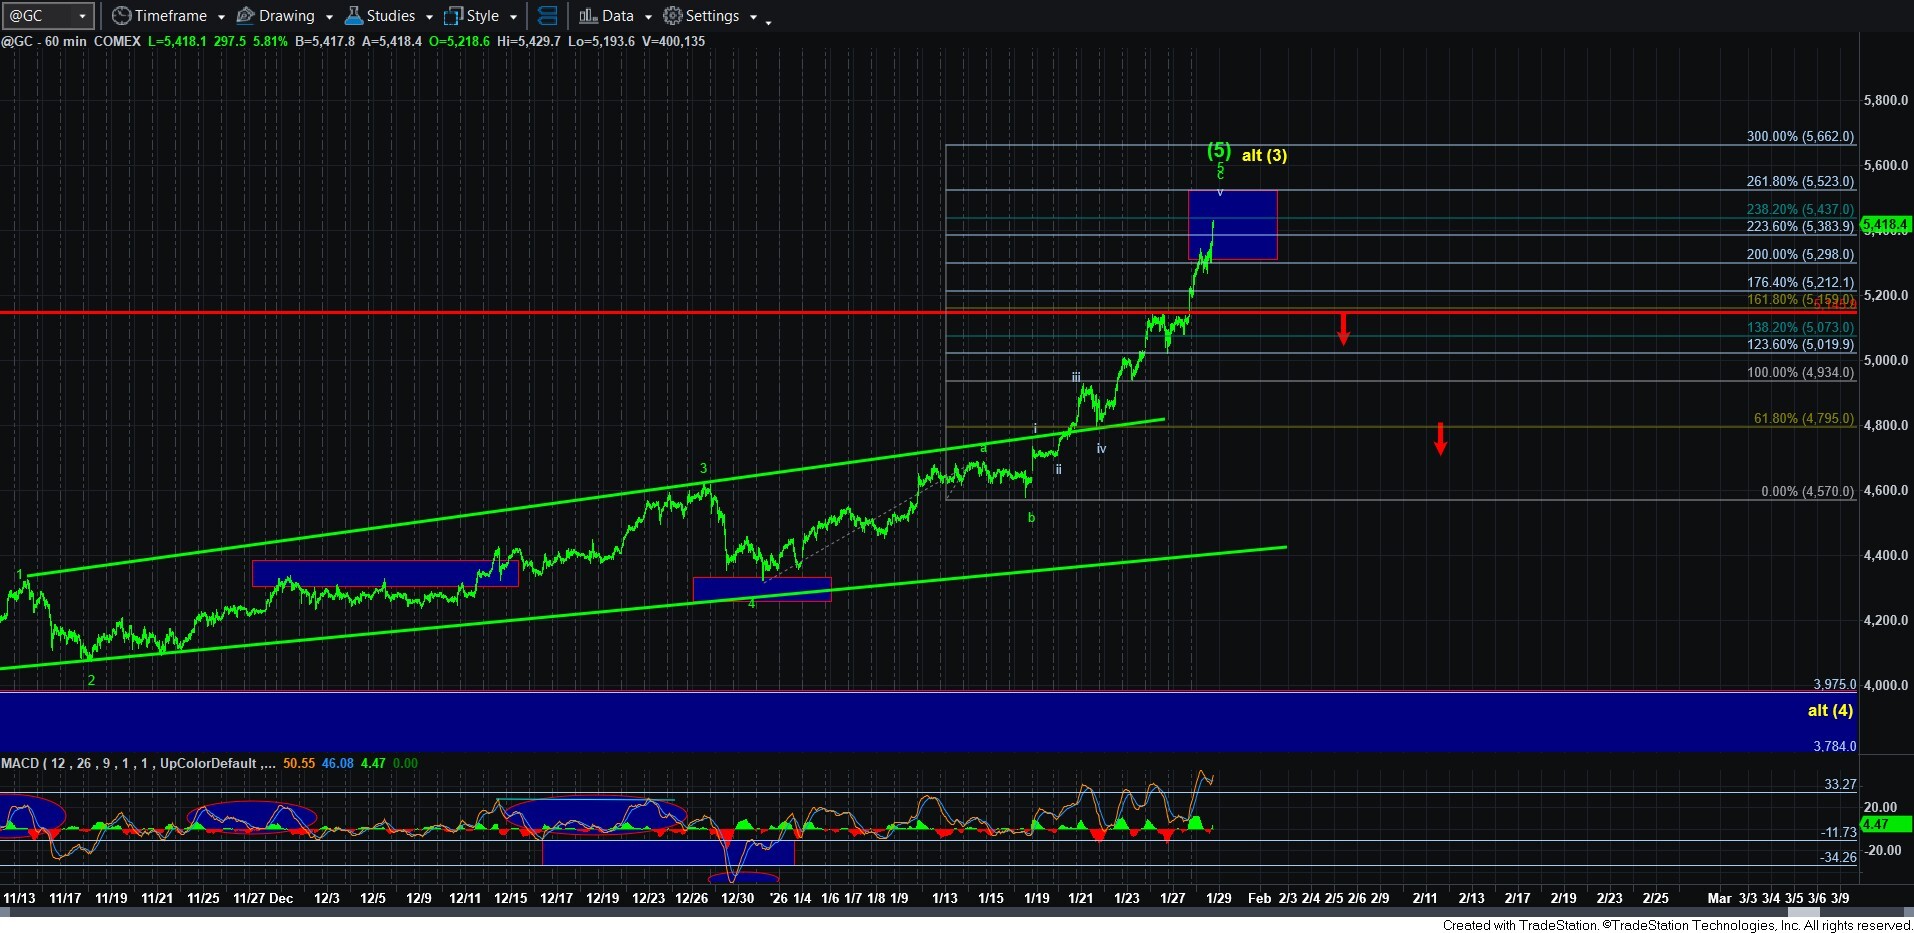
With regard to the wave structure in gold, I am seeing this as a very extended wave v of the c-wave of within the 5th wave of the ending diagonal, which you can see on the 60-minute chart. If you want to zoom in a bit more, I have added detail to the count in wave v, which suggests that we are completing that structure as well. Moreover, you can see that I have noted a micro support level, which has a bottom in the 5360 region. (PLEASE TAKE NOTE THAT THIS IS NOW BASED UPON THE APRIL CONTRACT). As long as we remain over that support, I think we still have higher to go to complete waves iii, iv and v. But once that support is broken, we have the catalyst for a potentially strong reversal as it could signal the end of this parabola.
Once this smaller degree structure completes, I have outlined the support levels on this new contract in red on the 60 minute chart, which must be strongly broken in a clearly sharp reversal to suggest a likely return towards the 4000 region.
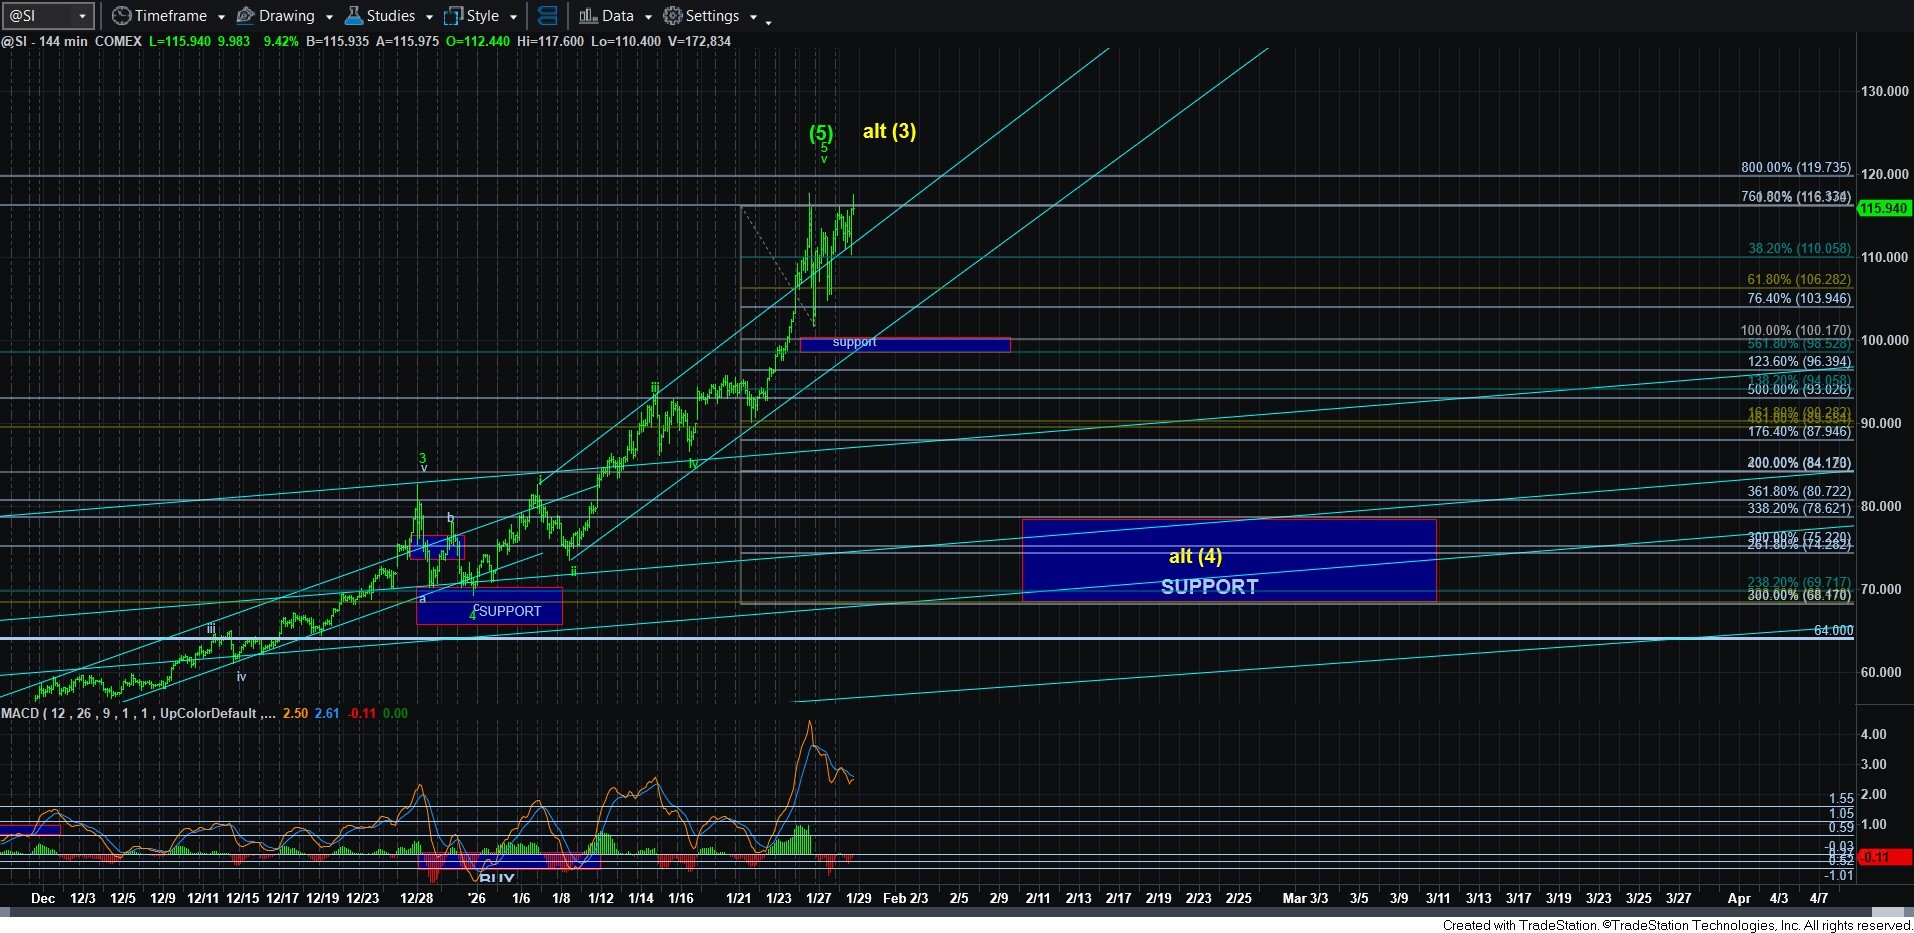
As far as silver is concerned, there is some potential that it has already completed its parabola, as it is struggling to make higher highs. Moreover, the structure is overlapping during this segment of the rally, which does lend to that potential. But, it is entirely possible that it is tracing out an ending diagonal to a higher high while gold completes its structure. I would not get in its way in either case right now.
Support for silver is the 98.50-100 region, which when broken, will likely suggest that this upside is done, and a very large correction will likely ensue. Again, it could mark the conclusion of this entire rally, but I cannot yet make that determination. But, the potential of that is quite high at this point.
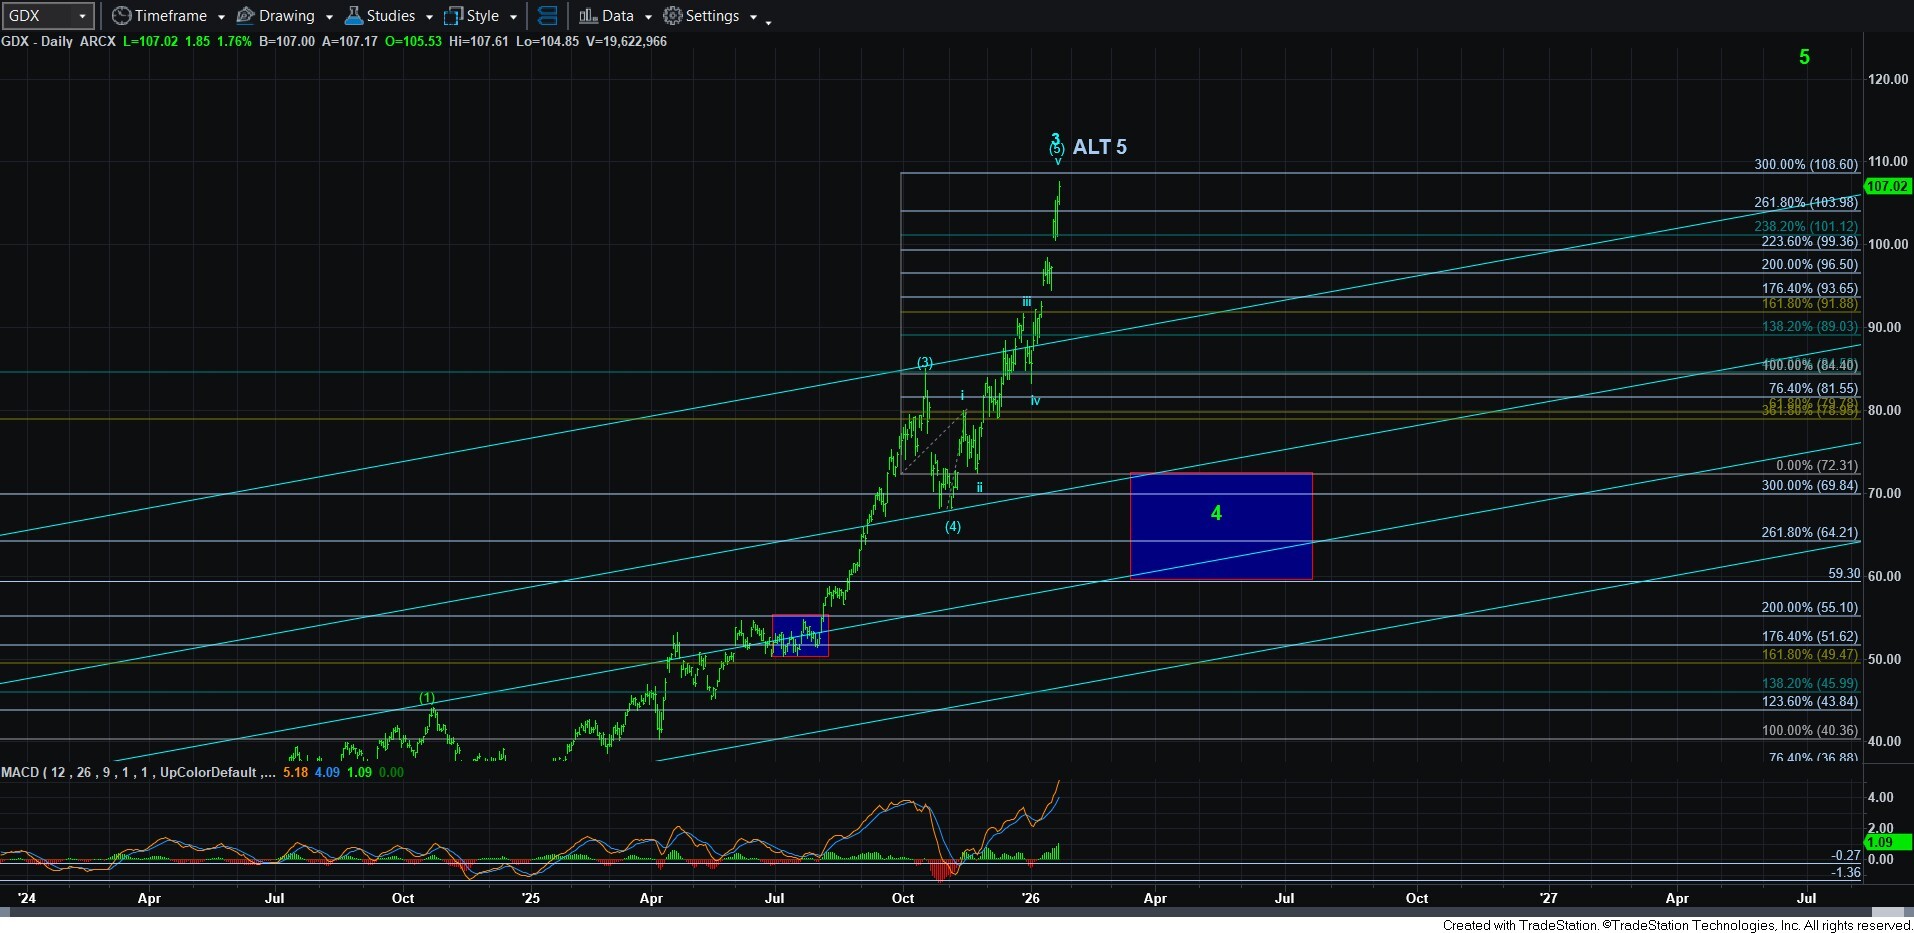
The only chart that still has me relatively confident in a 4-5 yet to come is still GDX, but I am starting to question that if this continues much higher. It like silver has been struggling while gold is pushing higher, which means it may have finally completed its 3rd wave already. A strong break of the 100 region with continued strong follow through below 96.50 should point us back down towards the low 70’s and potentially even as deep as the 60’s for wave 4.
So, in summary, I think we are in a very dangerous point in this parabolic rally, which can really end at any time now, for which a reversal can be quite destructive to those that are still strongly looking higher. I still think the best potential for another 4-5 remains in mining stocks, but even in those there are ones with a higher degree of probability than others for that potential 4-5, whereas some may be topping in this move. I am still quite cautious on the long side, and have been continually reducing my exposure to this complex, and will focus my energies instead on looking for one more buying opportunity in those stocks with the best probability for 4-5 set ups.