Expect Surprise Moves and Whipsaw
 By
By
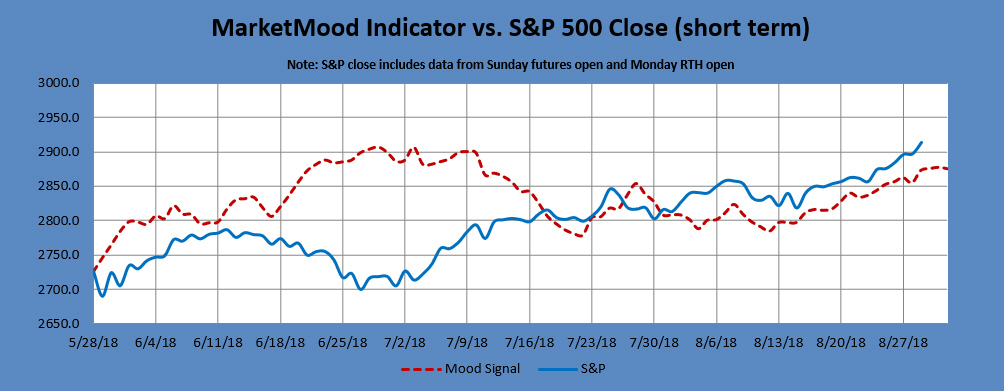
Wednesday's mood pattern highlighted the irrational, and if there's such a thing as a breakout of irrationality, today should have been it. Our Market Mood Indicator (MMI) gave a slight edge for the upside on Wednesday, with the primary expectation from the mood pattern being either a breakout or breakdown (so slight edge to the breakout). The S&P 500 closed up 0.57%.
Where We're Heading:
Thursday's pattern implies government related concerns or geopolitical turmoil prior to a signal flip from down to up. That means downside is expected overnight and /or early tomorrow prior to further upside. However, bulls should not be complacent here. Friday's MMI is calculated as close up; however, a Thursday-Friday bearish "New Paradigm" mood pattern should come into play by sometime Friday and continue into the weekend. Overall, the next couple of days could be really tricky to navigate with surprise moves and whipsaw likely.
MMI for Thursday: flip from down to up
Reminder of the weekly outlook: This week is another mixed picture. The mood pattern implies a "New Paradigm" or the beginning of a new chapter. The markets usually reflect this with a trend change and the beginning of a new Elliottwave subwave. This particular new paradigm configuration is usually bullish, but the presence of a second component calls this into question. It points to a focus on the government and / or geopolitical concerns and is usually bearish. Also, the pattern showing for the week after this, the week of September 3 reflects a serious mood that most often appears near market lows. Hmmm.....
MarketMood Data Info:
Internet search theme MMI inputs (mood vs effect inverting): shooting, murder, injury, suicide, police
Short Term Forecast:
Next 3 Days:
| Date | Daily MMI |
|---|---|
| 8/30 | flip from down to up |
| 8/31 | close up (caution advised) |
| 9/3 (open) |
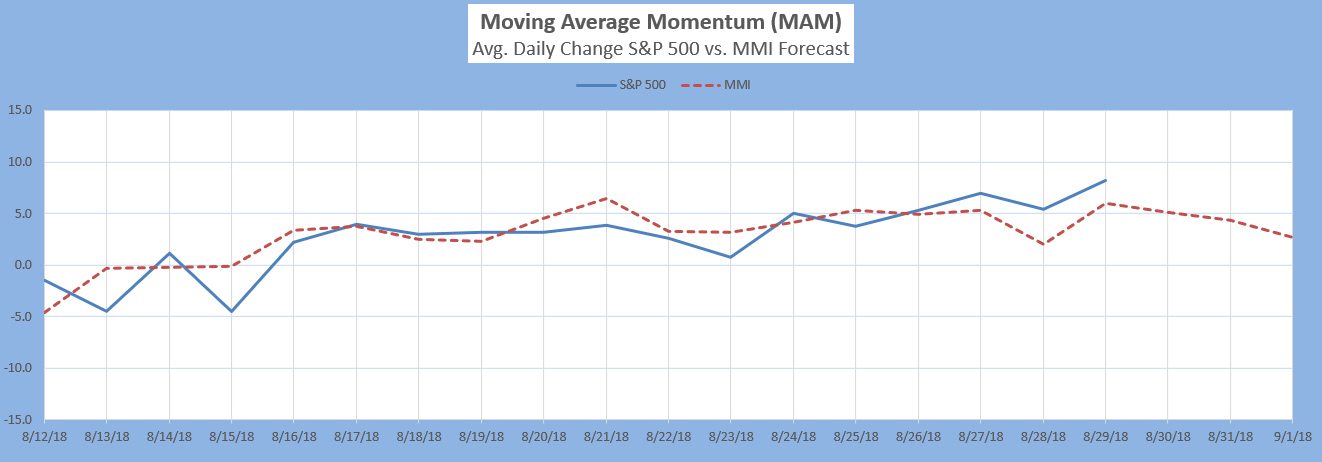
The Moving Average Momentum (MAM) Indicator last signaled a major trend change with a major LOW indication between April 18-25 (there was a closing low on the 25th which repeated slightly lower on May 3-- a major low).
The last few MAM signals (significant trend change, no direction specified) have only confirmed that the current move in the S&P is most likely an Elliott Wave diagonal.
Note: Changes to next day MMI signals occur about 5% of the time, and will be announced in updates as well as the daily report should they occur. Same day signals will not change. Day 2 and 3 signals reflect the most current information, and are subject to change. The default trade per the daily signals is executed at market on close. except on Mondays, as there is a signal for Monday open (i.e. "weekend close") and Monday close. The daily MMI signals are correct as daily direction calls about 63% of the time. Please manage your trading risk accordingly.
Intermediate Term Forecast:
The primary outlook is that a corrective move is in progress. Weekly charts are looking for a near term top or pause. Monthly charts show (roughly) August as a high and October as a low.
MM MACD signal is BUY and the intermediate trend is UP. The swing trade signal is continued buy at or above 2918 SPX.
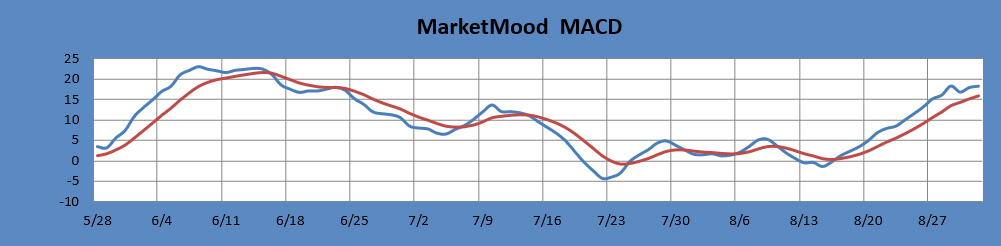
The MM MACD is similar to a standard MACD, except that it uses the MMI signal data to extend several days beyond today, while the standard MACD relies solely on historical market data.
Long Term Forecast:
The long term forecast remains strongly bullish. The bullish long term trend is indicated by the generally positive divergence between the stock market and the mood generated forecast (see long term chart below). The MM Long Term Trend Indicator (bottom chart) which is derived from this divergence, indicates: Bullish Trend, hold long positions. The MM LTTI has had this same bullish indication since 12 Sept., 2016.
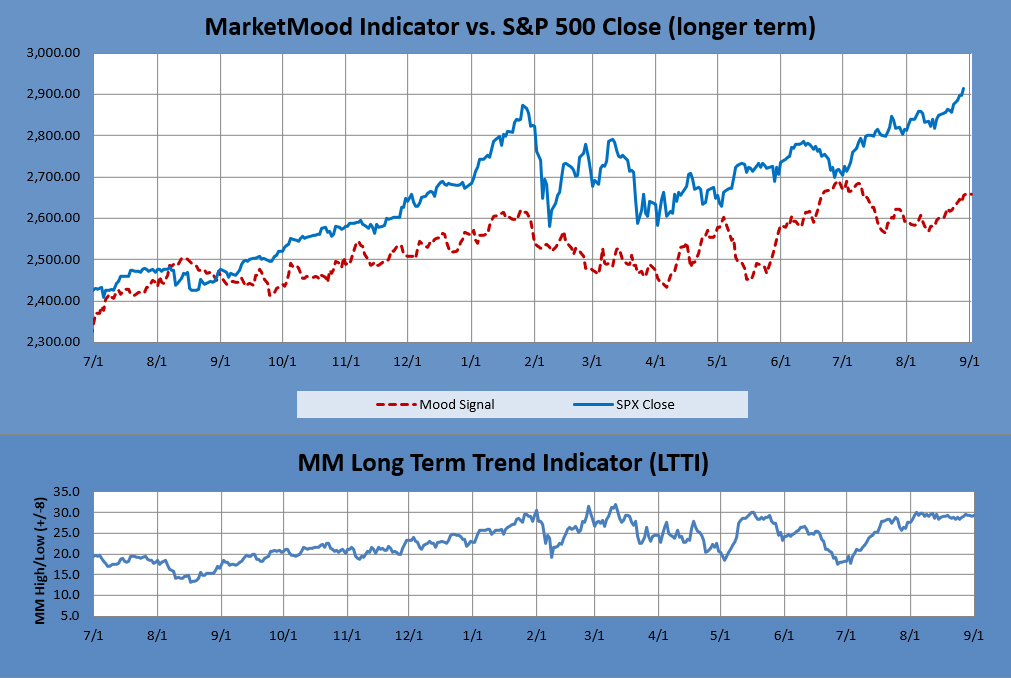
The MM LTTI measures trend strength using the divergence between the market trend and the forecast trend. A move above +8 or below -8 is bullish or bearish respectively. A value over 10 or under -10 followed by a move back through +/-8 signals a high or low is likely in. A subsequent move below +5 (or above-5) signals a trend change to bearish (or bullish).
