Energy: The Strongest Sector In The S&P?
 By
Levi
By
Levi
By Levi at Elliott Wave Trader; Produced with Avi Gilburt
In the weeks to come, you will likely see quite a few more setups and discussions regarding Energy sector stocks. We are showing the likelihood of an important low being struck across that portion of the marketplace. Let’s take a look at the general landscape of the sector in (XLE) and (XOP). Also, an update on one of our recent articles to the readership (DVN).
What Is The Current Fundamental Landscape?
Lyn Alden closely tracks the Energy sector and will frequently share her views with our members. Her latest comments are below:
“XLE and oil producers more broadly look very strong from a long-term fundamental point of view. The equities in general are priced at great valuations for current oil prices and having strong balance sheets, and oil prices have a pretty strong floor.
Deceleration of growth (especially manufacturing) in some regions of the world has curtailed demand to some degree, but that's a temporary/cyclical phenomenon. The longer-term structural supply/demand situation for oil is tight on the supply side, decent on the demand side, and thus bullish overall.”
* Be on the lookout for a new article soon from Lyn in her featured series, “Where Fundamentals Meet Technicals”. This will also have some specific Energy sector stocks to study.
Let’s Take A Look At The Technicals
Zac Mannes and Garrett Patten are regularly scouring across all sectors for solid setups with defined risk vs reward. These setups are then shared in the Wave Setups feature for our members. At any one moment in time, the Wave Setups table may have upwards of 50 active setups, both long and short in positioning.
Just a few days ago, Zac shared a new setup for (XLE).
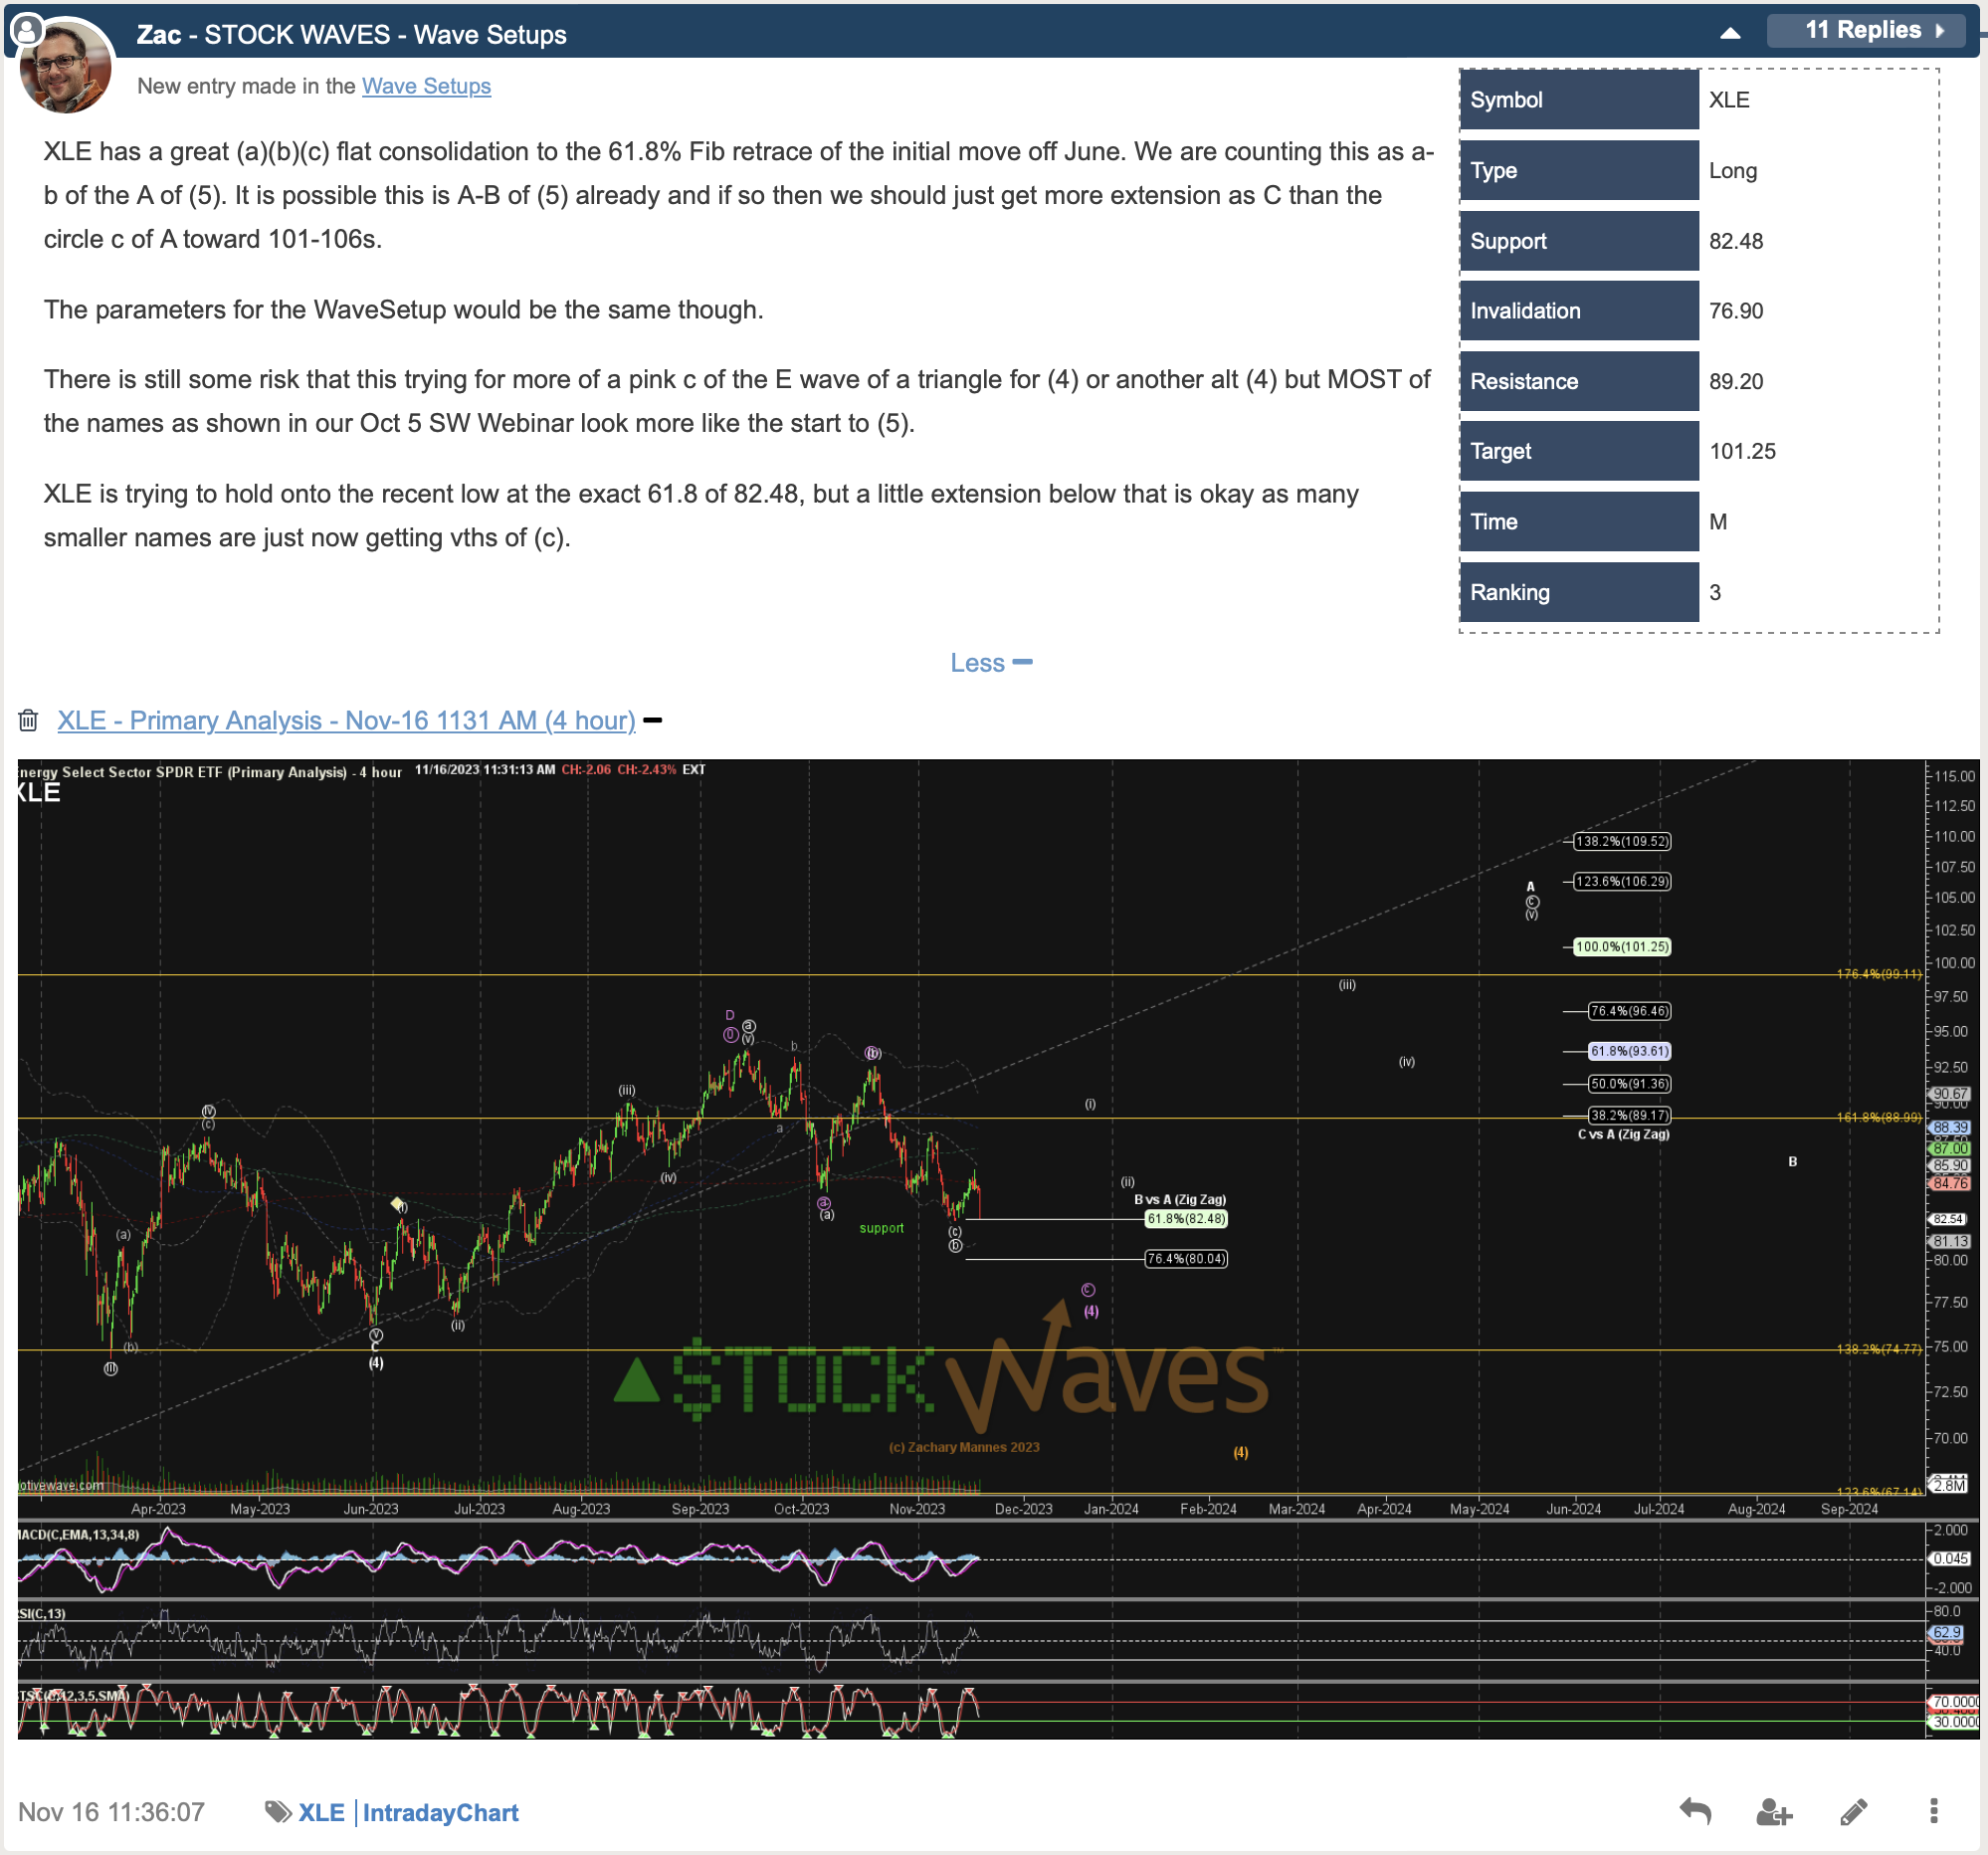
Many comment that they find the table at the upper right of these setups highly useful. You can see that we have clearly defined support, invalidation, resistance and the target.
Risk can be defined here as any move below $76.90 in XLE.
As well, we can see the latest chart that Zac has shared with our membership here:
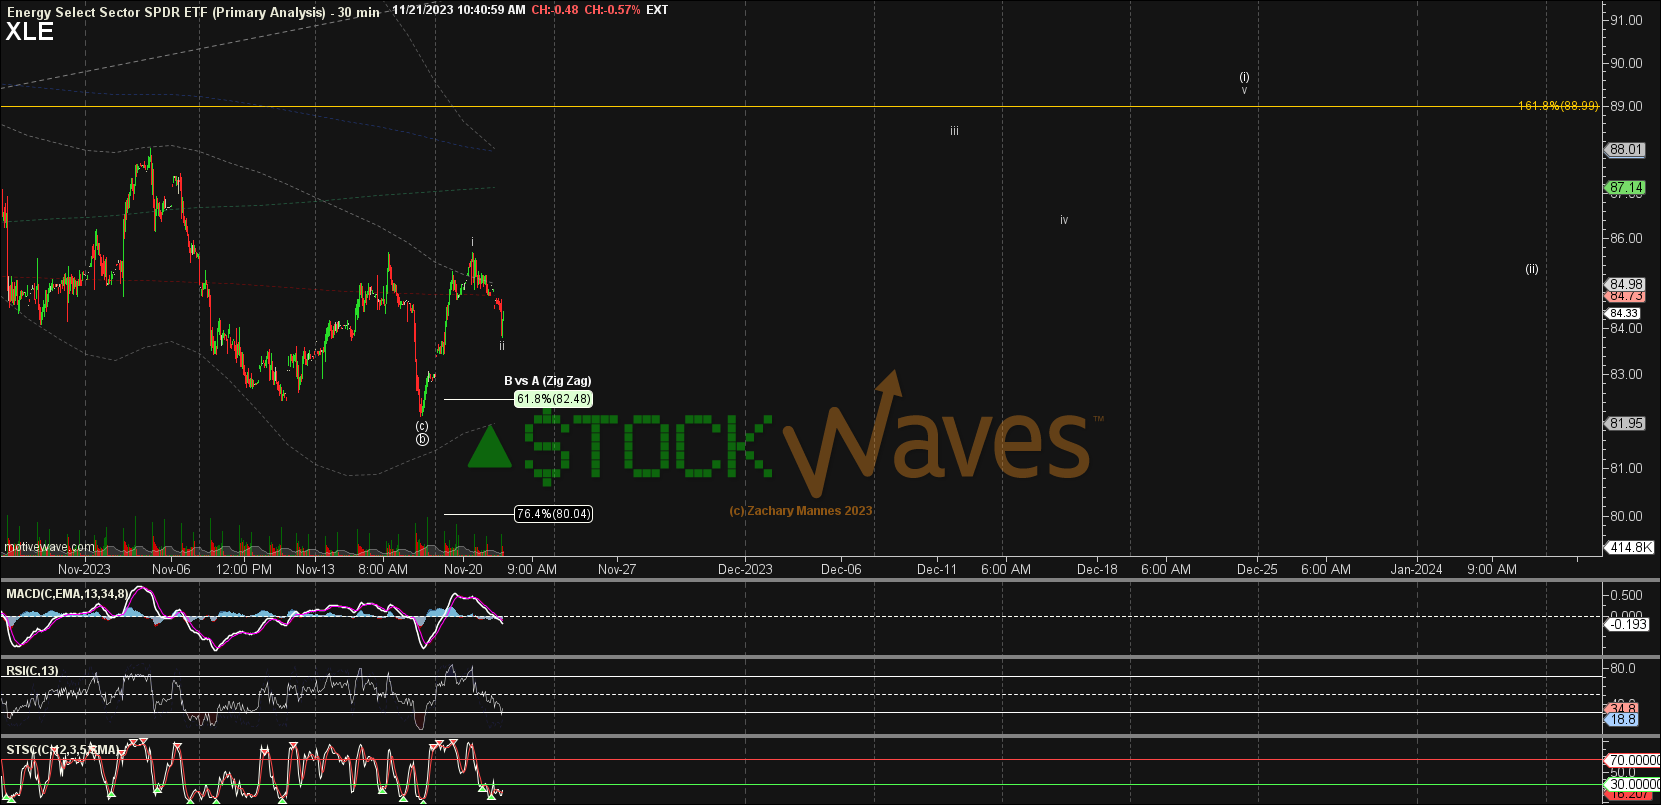
Note that we anticipate a 5 wave move up to the $89 area before a larger pullback. That pullback would give us a larger breakout setup pointing to $105 or higher in the larger picture.
The XOP chart may be slightly ahead of XLE.
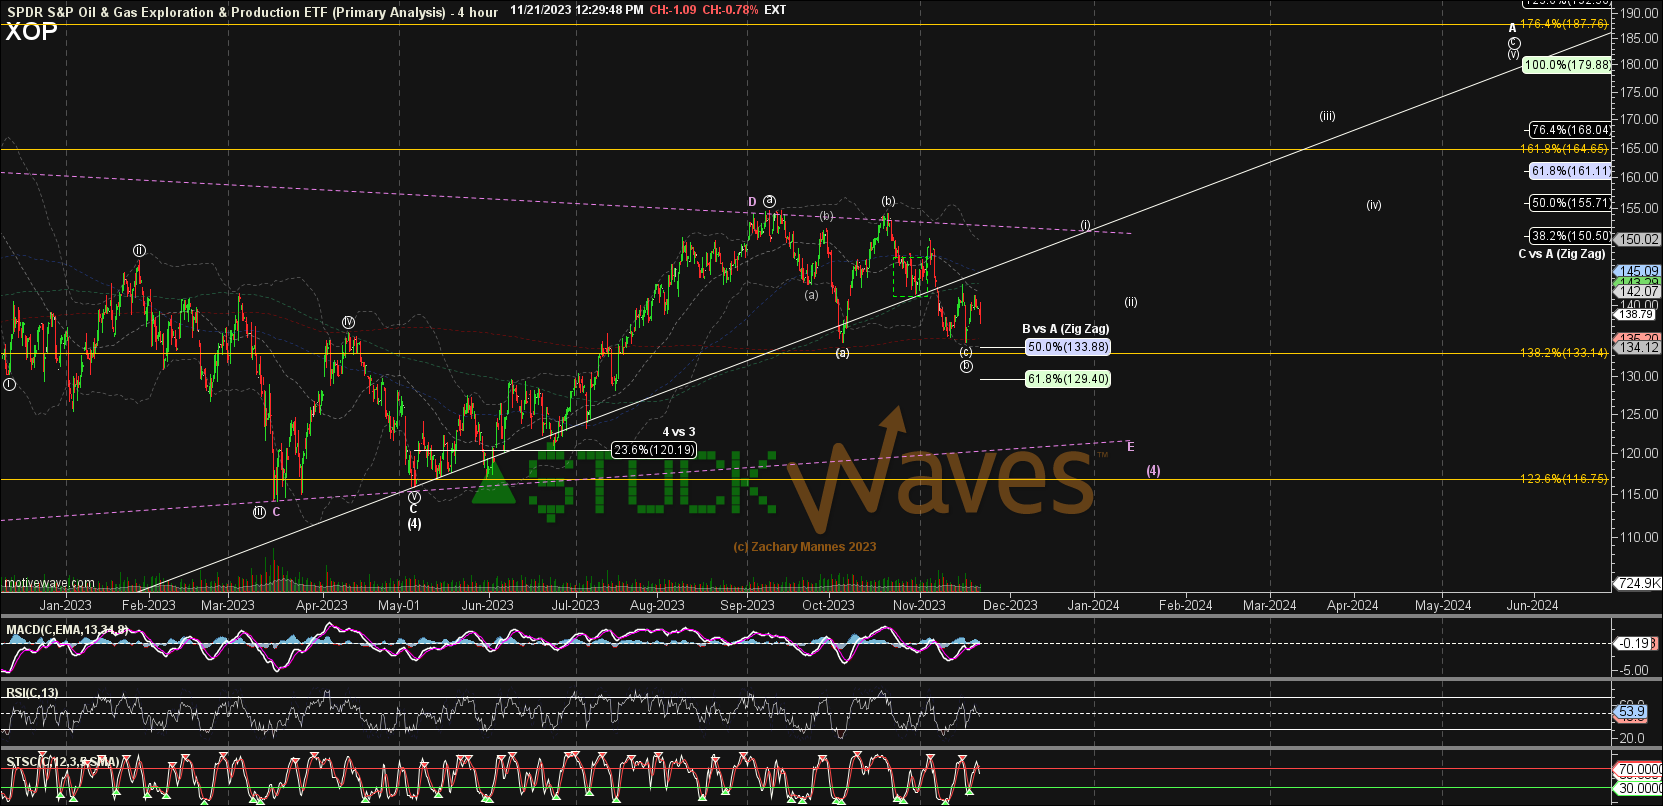
The next larger rally there may take price to the $180 level.
What about (DVN)?
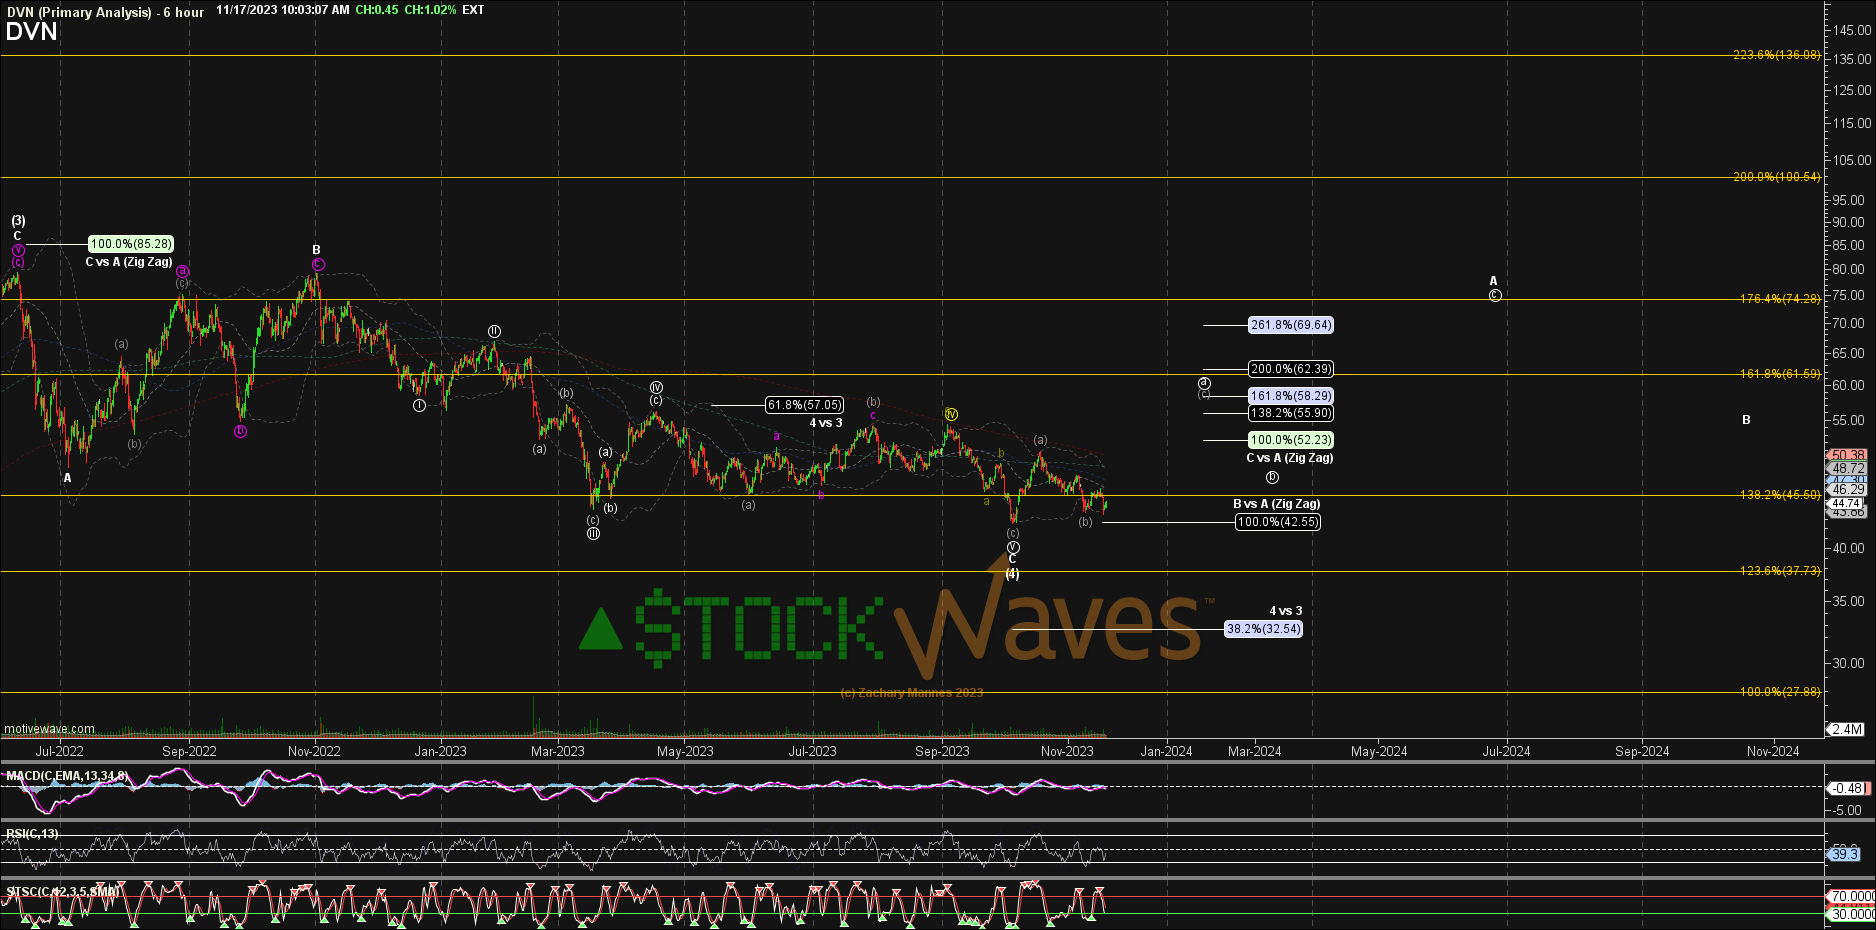
We are still tracking this one as either being very near to or already having struck an important low. This ticker was highlighted 4 weeks ago in the article here.
At this moment, there are dozens of possible other setups across the Energy sector. Some will outperform the overall XLE ETF, others will be underwhelming. We will be focusing on those potential out-performers over the next months and will continue to identify the favorable risk vs reward setups as they come to bear.
Do You Have A System In Place?
Those that have experience forged by time in the markets will tell you that it is imperative to have a system of sorts in place. You need to be able to define how much you are willing to risk versus how much gain is likely. Those that survive across the decades in the greatest game on earth will also inform you that preservation of capital is paramount.
While there are multiple manners of doing this, we have found Fibonacci Pinball to be a tool of immense utility for traders and investors alike.
Avi Gilburt has shared a 6-part article with the readership. This series fully explains how our preferred analysis methodology came into existence and how we use it every day. You can read the entire 6-part series to obtain a basic understanding of how to track human behavior as it unfolds in front of us. Part 4 (here) and Part 5 (here) of the series specifically discuss Fibonacci Pinball and how we use it to help keep us on the right side of the markets.
Why Don’t More People Use Elliott Wave Analysis?
Have you ever asked this? Avi Gilburt penned a response to this very topic. Here is a brief excerpt from that article (this piece is available in its entirety in our Education section).
“First, many may not know this, but there are quite a few ‘name' investors who do use Elliott Wave analysis in their decision making. One of the most popular is Paul Tudor Jones of Tudor Investment Corporation. Jones was quoted as saying:
"I attribute a lot of my success to Elliot Wave Theory. It allows one to create incredibly favorable risk reward opportunities” - Paul Tudor Jones.
“Let’s start with the understanding that it takes a lot of detailed work and calculation in order to perform a proper Elliott Wave analysis. Moreover, it is a very complicated method to learn. So, the entry into this methodology is not easy and to perform a proper analysis is not easy. But, then, show me anything that is truly worthwhile that does not require an initial investment and hard work.”
In addition to the articles provided to the readership here, we have an extensive Education library available at Elliott Wave Trader. As well, we want to teach others this methodology. Three times a week we have beginner and intermediate-level videos where we show the exact way we count the waves and give in-depth analysis techniques. This methodology, if you give it the chance, will change the way you invest forever. More on that can be found here.
There are many ways to analyze and track stocks and the market they form. Some are more consistent than others. For us, this method has proved the most reliable and keeps us on the right side of the trade much more often than not. Nothing is perfect in this world, but for those looking to open their eyes to a new universe of trading and investing, why not consider studying this further? It may just be one of the most illuminating projects you undertake.
