Enbridge Over Troubled Water
 By
Levi
By
Levi
- We are neutral to bearish near term on the Energy Sector overall and view it as troubled water for the moment. What is different about Enbridge?
- Lyn Alden discusses fundamentals and why Enbridge may fare better than some.
- The technical viewpoint provides us with overhead price targets and where this scenario might need revision.
by Levi at StockWaves; produced with Avi Gilburt
It was back in late May of 2022 that StockWaves turned cautious the Energy Sector (XLE). Rewinding a bit further, we had been uber-bullish nearly all things energy from the Fall of 2020. Yes, (XLE) and most energy related stocks fell sharply into mid-Summer of 2022. (XLE) fell nearly -30% from peak to trough only to rebound and retest those peak highs in the Fall of 2022.
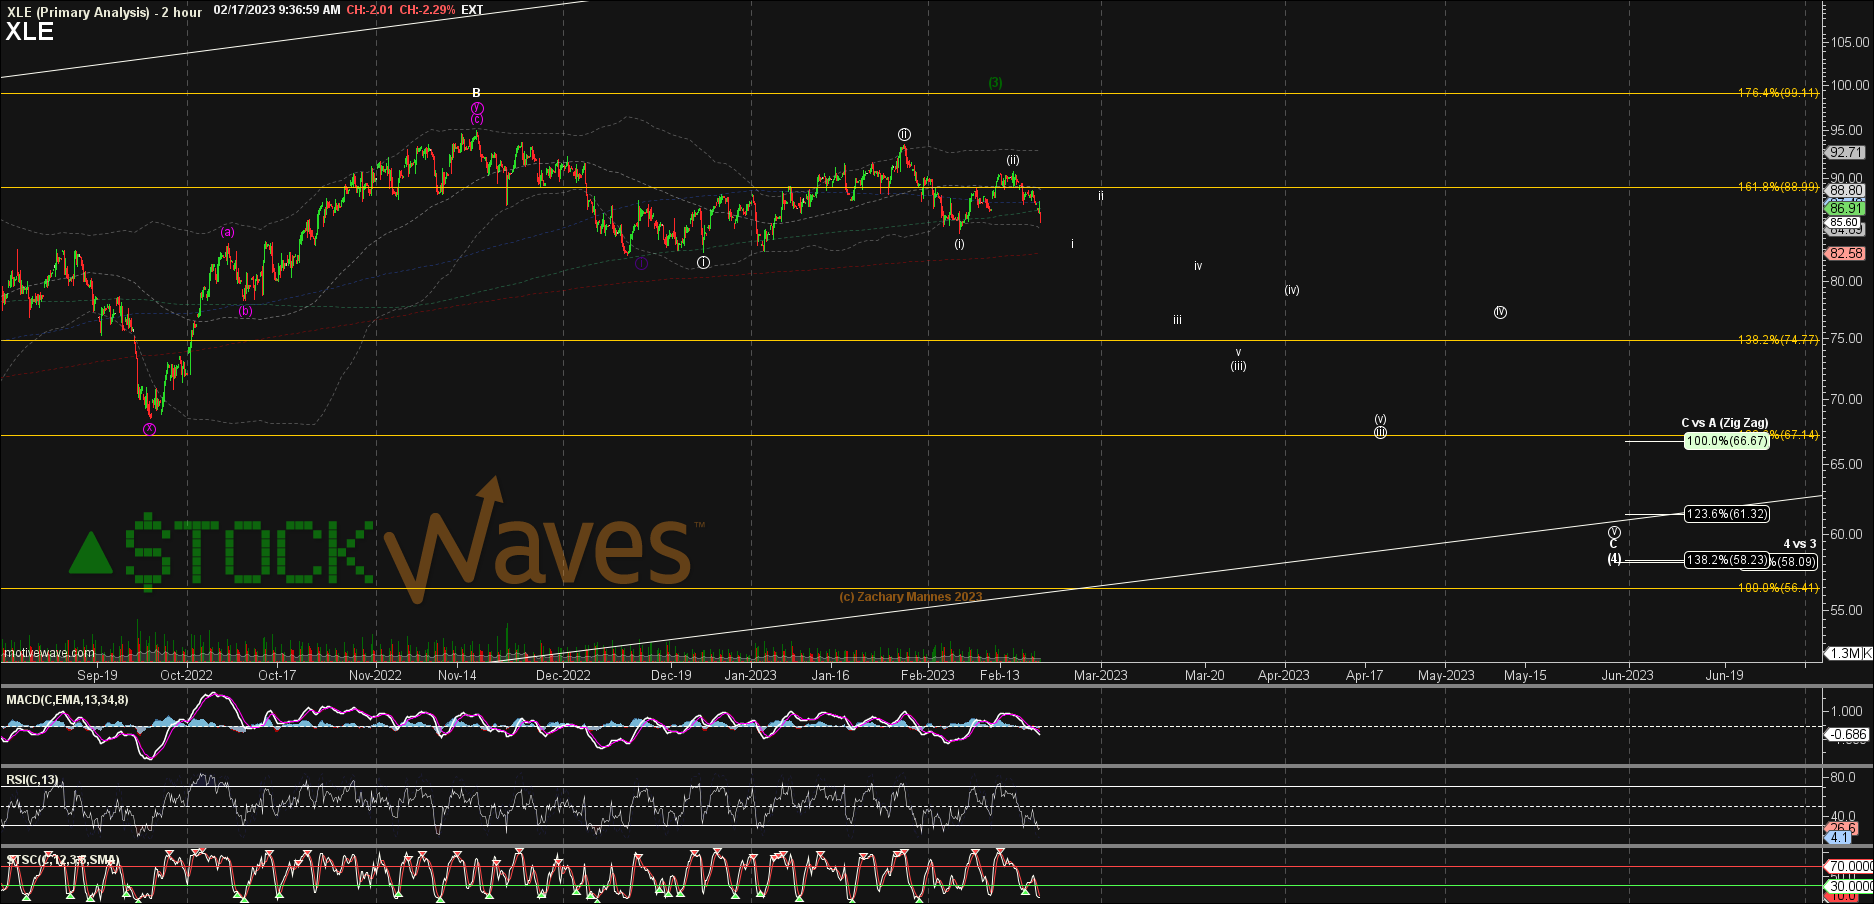
We are still cautious most energy stocks and continue to update them on a daily basis. Our primary scenario for (XLE) is still for a continued correction as shown below by our lead analyst, Zac Mannes.
(see Zac XLE 2h)
So, what’s different about (ENB)? Let’s first take a look at the fundamentals with Lyn Alden.
Enbridge Valuation And Outlook With Lyn
“One of the areas that I think can do pretty well this decade is pipeline stocks. My favorites are Enterprise Products Partners (EPD) and Energy Transfer (ET), but because they are partnerships rather than corporations, they've not for everyone. There are, however, some ETFs and corporations that focus on pipelines.
It's not that I expect massive growth from pipelines, but rather, I expect them to chop along sideways while paying 6-7% yields or more, and slightly increasing their distributions each year. The industry has been washed out a number of times, with excess valuations cleared out, resulting in decent income plays going forward.
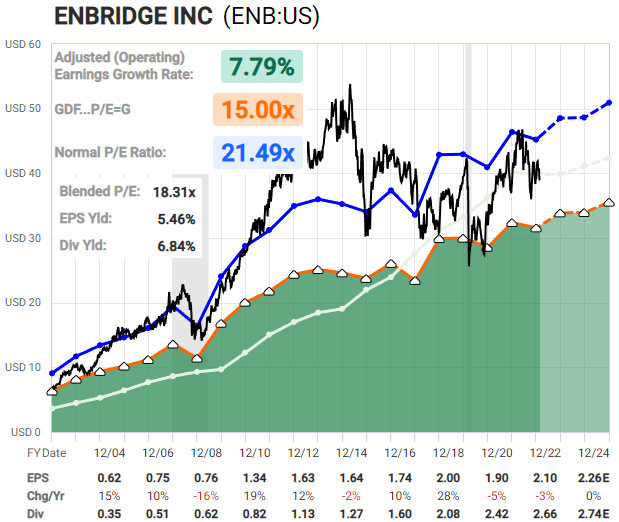
(see FastGraph)
Enbridge (ENB) is one of the biggest, with a BBB+ credit rating (tied for the top rank in the industry), and offers a yield well north of 6%. My expectation is that, much like the S&P 500, Enbridge's share price will likely muddle along this decade, with the difference being that it'll pay a sizable dividend along the way.”
Recent Statements From Enbridge
Here is an excerpt from their website regarding dividends:
“Enbridge has paid dividends for over 68 years to its shareholders. In December 2022, we announced a 3.2% increase to our dividend per share, increasing the quarterly dividend to $0.8875. This translates into $3.55 dividend per share on an annualized basis for 2023. Over the past 28 years, the dividend has grown at an average compound annual growth rate of 10%.
Equally important, our dividend growth has not come at the expense of our financial strength as our dividend payout ratio is expected to remain within our target dividend payout ratio which is between 60 and 70% of DCF, providing a healthy balance between returning income to shareholders and retaining income for reinvestment in new growth opportunities.”
The Technical Viewpoint
Note here what our two lead analysts are anticipating as the most probable path forward for (ENB).
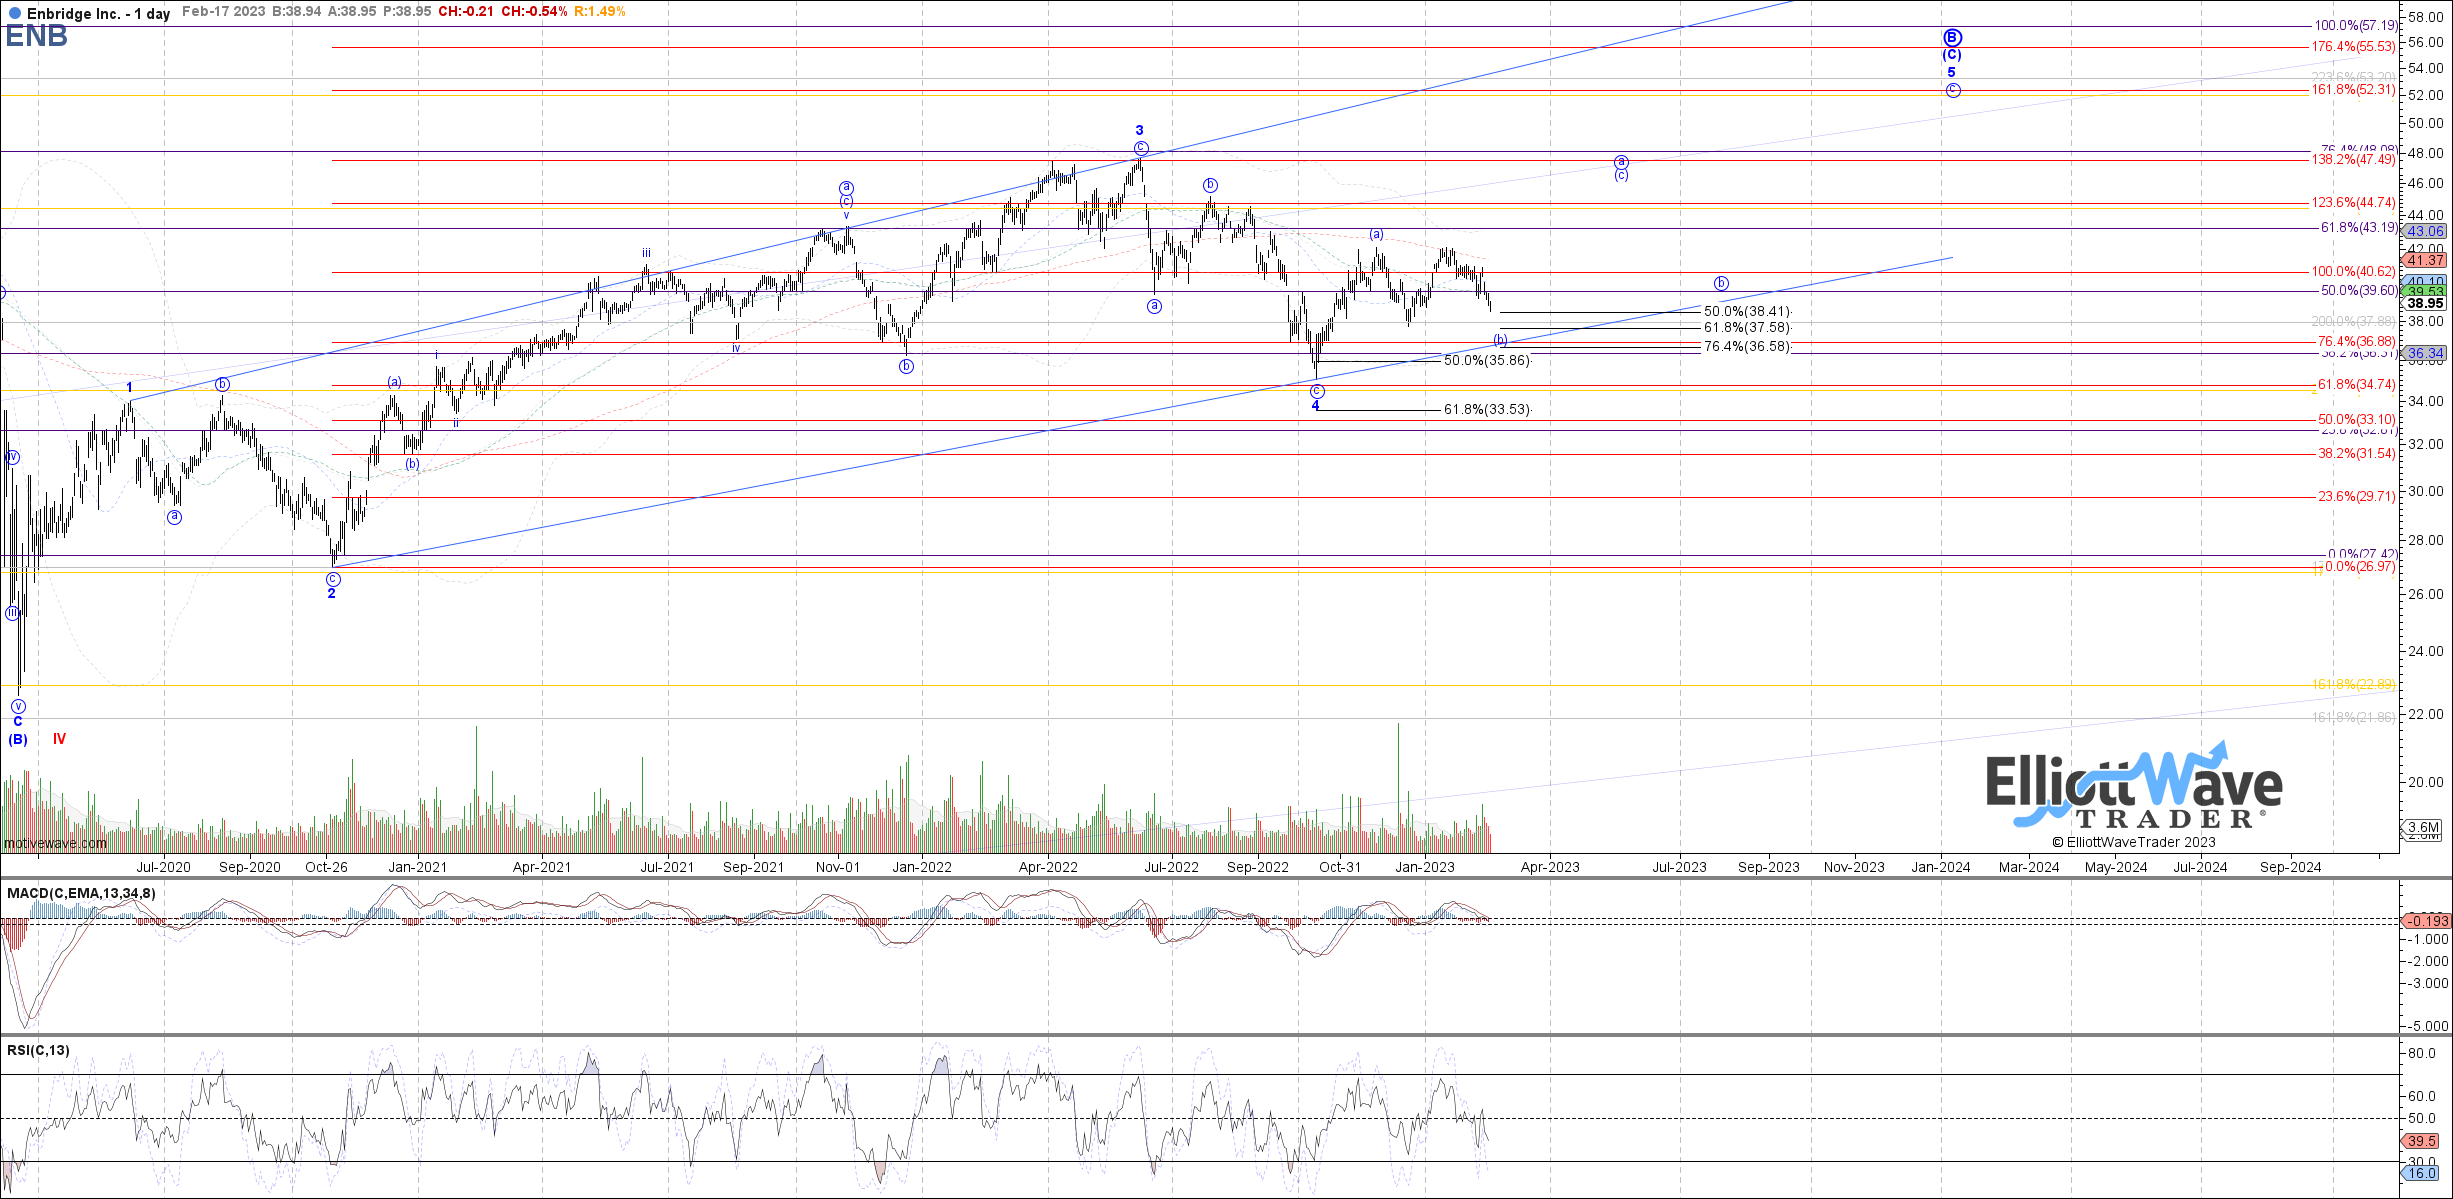
(see Garrett ENB Daily)
You will see on the daily chart that Garrett is anticipating a potential low in wave [b] of a larger circle ‘a’. The ideal support for this [b] wave is $36 - $38.
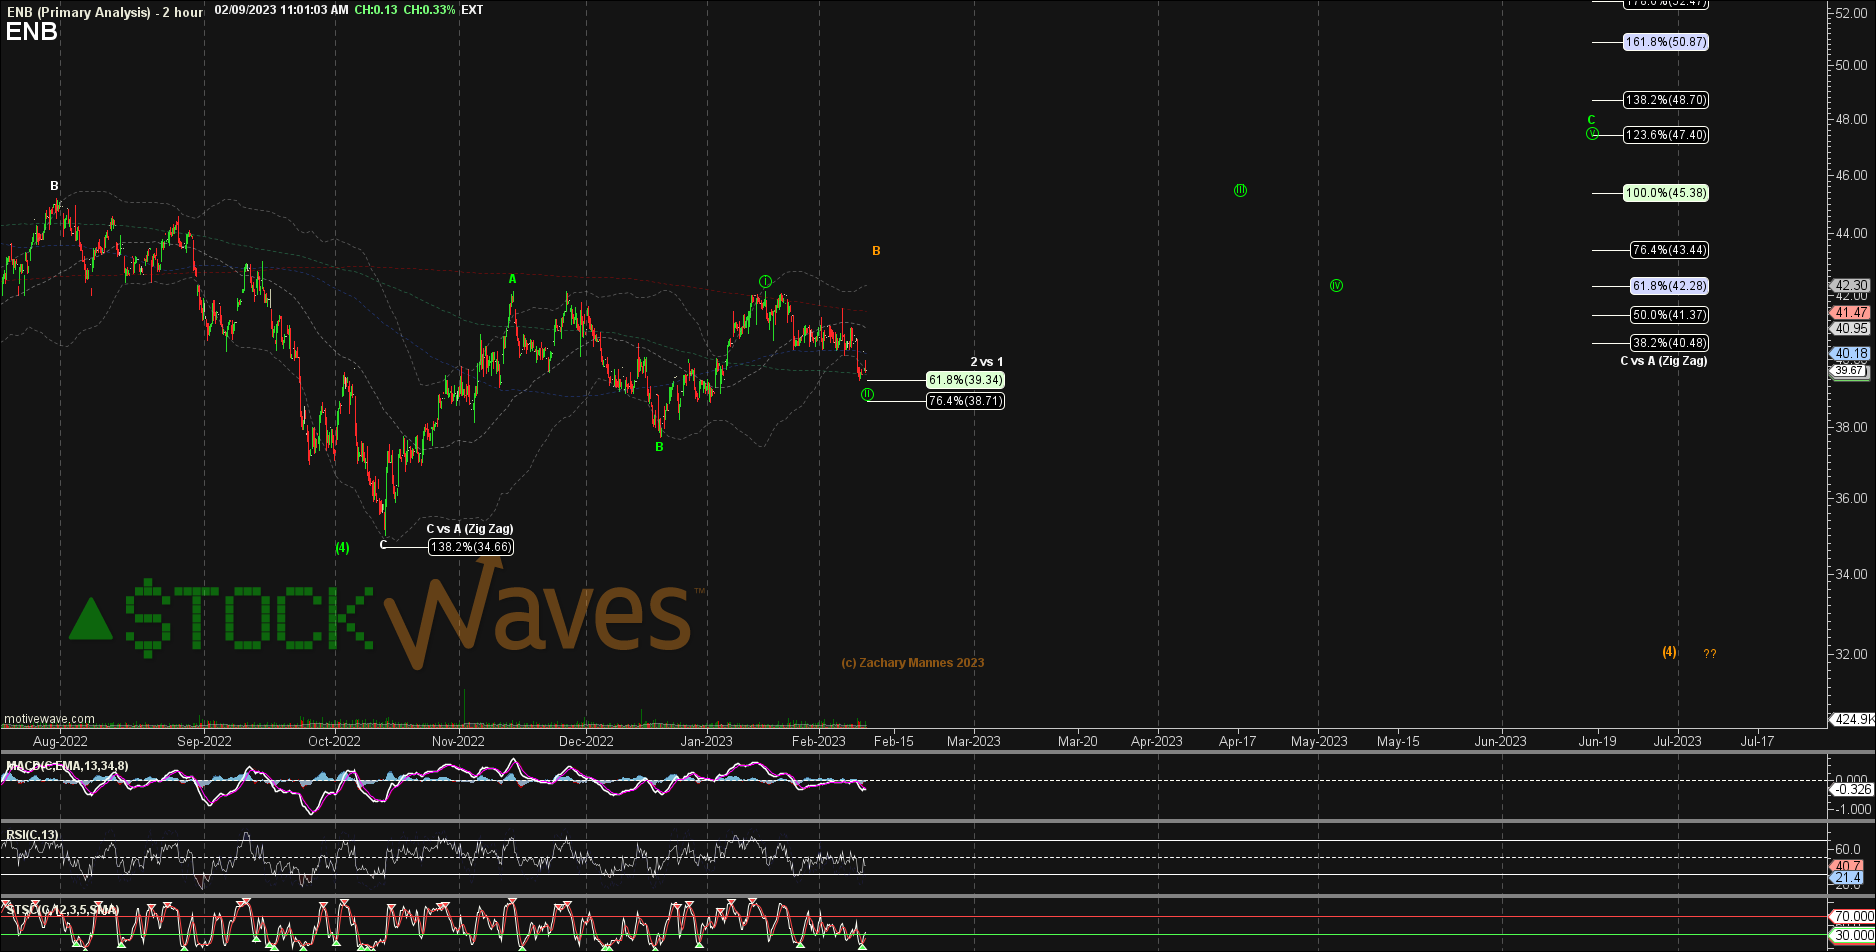
(see Zac ENB 2h)
Zac’s chart also shows the alternate potential orange path which suggests (ENB) would be dragged down with the energy sector as a whole. The primary path shown in green agrees with Garrett’s chart above and suggests that there are higher prices for as long as the $36 region or better holds.
Risks
Likely, the most prominent risk to the stock price would be a dividend cut. Given their recent declarations and forward-looking statements, this does not seem to be the most likely outcome, but one must remain vigilant to any warning signs.
Also, from the technical viewpoint, should (ENB) break below $36 it may signal that a wider 4th wave is forming and would possibly target down to the $32 area in a larger correction.
Where To Turn More Cautious On Enbridge
While it would appear that (ENB) is now nearing an important support level, there will likely be a more important moment in the future where investors will likely need to turn more cautious regarding the stock. As you can see from the charts attached above, the next high seen in price, perhaps in the $48 - $52 area, would be a significant high. Also, it would fit the scenario that fundamentals would even appear to be at their best ever when that new high is struck.
So, if fundamentals were to be at their ‘best ever’ then why turn cautious? Avi Gilburt, founder of ElliottWaveTrader.net, has written extensively about this topic. Here is an excerpt from an article entitled, “When To Properly Use The F-Word (Fundamentals) When Investing”. You can see the entire article here.
“Now, let me start by saying that there are very few fundamental analysts that I think are any good. The best of the breed that I have seen is someone we all read and respect, Lyn Alden Schwartzer. So, I am quite proud that she is a leading analyst on our StockWaves team.
But, allow me to explain where I see the role of fundamentals, and when I think they should be discounted or looked at as a secondary or coincidental factor. Remember that market sentiment is the primary driver when we are dealing with investment products wherein mass sentiment is evident. However, this is not an absolute perspective. Rather, it is based upon a continuum of sentiment.
You see, while the (SPY) is an example of an investment product that presents us with the ultimate in mass sentiment, a microcap biotechnology company may be on the opposite end of that continuum of sentiment. Within the example of the microcap, sentiment can be a factor, but the fundamentals of the company are going to be the primary driver of this stock. And, all products run somewhere within that continuum. The greater the mass sentiment being evident within the buying and selling of that product, the greater probability that sentiment will be the driver of price. And the reverse is true.”
So, we continue to track the path that (ENB) traces out and once the structure of price fills out the next high, we will turn much more cautious. In the meantime, (ENB) seems to represent decent value and income for investors looking for exposure in the energy sector at this moment.
I would like to take this opportunity to remind you that we provide our perspective by ranking probabilistic market movements based upon the structure of the market price action. And if we maintain a certain primary perspective as to how the market will move next, and the market breaks that pattern, it clearly tells us that we were wrong in our initial assessment. But here's the most important part of the analysis: We also provide you with an alternative perspective at the same time we provide you with our primary expectation, and let you know when to adopt that alternative perspective before it happens.
There are many ways to analyze and track stocks and the market they form. Some are more consistent than others. For us, this method has proved the most reliable and keeps us on the right side of the trade much more often than not. Nothing is perfect in this world, but for those looking to open their eyes to a new universe of trading and investing, why not consider studying this further? It may just be one of the most illuminating projects you undertake.