Emerging Markets Look Like Sick
I don’t often write about emerging markets, but I think the EEM should be addressed at this point in time.
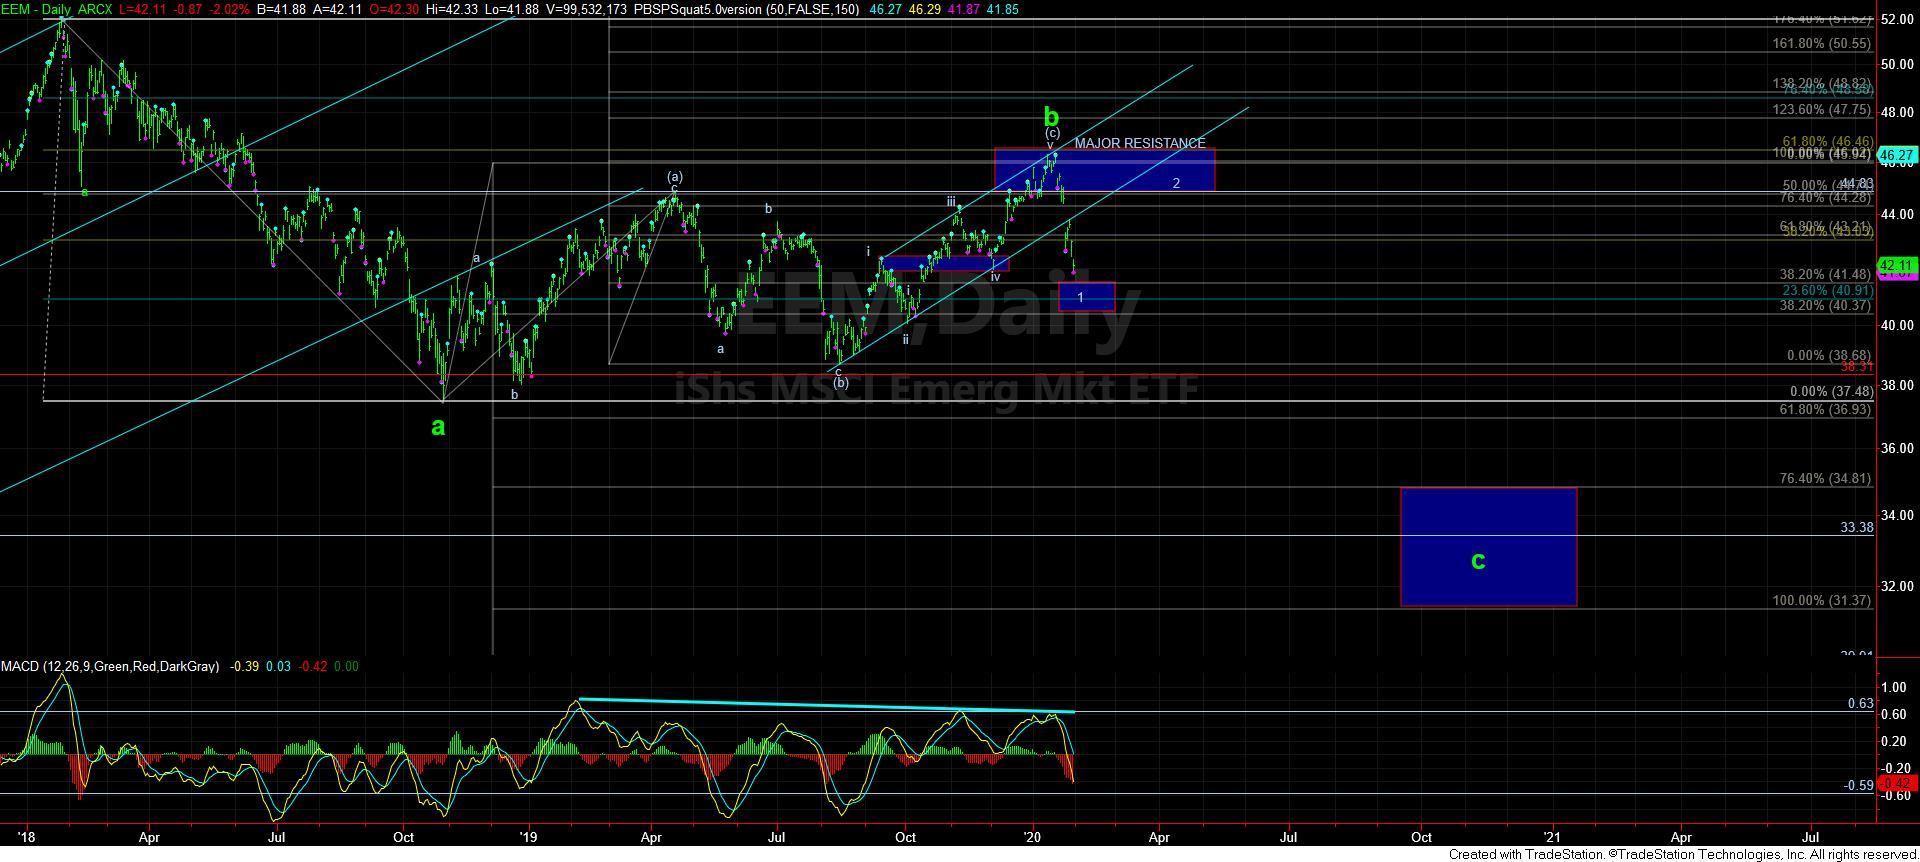
While many of you may read my analysis and conclude that this recent bearish action has been caused by the recent outbreak of the Coronavirus, I would suggest you consider that this structure has been building since 2018, and is nothing that has been “caused” by a recent news event. So, while I think that the EEM chart looks “sick,” I do not believe it has contracted the Coronavirus. Rather, its sickness has been developing over the course of the last 2 years.
Now comes the kicker. Since the market struck this corrective top several weeks ago, I can now count 5 waves down off that high. While we can always see another 4-5 for a larger 5-waves down, the structure to the downside provides us with a strong warning that a corrective retrace seen in the coming weeks back up towards the bottom of the major resistance region overhead could set up a decline akin to the one seen in 2018, but potentially even stronger, as it would be a c-wave decline, rather than an a-wave decline. The target for this decline would be the 31-35 region, which represents the region of the a=c and c=.764*a points of reference, as outline by the larger c-wave blue box below.
So, whereas the IWM may also be signaling something quite similar, I would say that the EEM seems to be a much stronger argument for a larger decline which can be seen later this year. This is another chart that we should be keeping a close eye on, as it certainly is not telling a bullish story at this moment for the 2020 calendar year.
However, if EEM is able to move through the January high on the next rally, it would invalidate the immediate bearish set up presented on the chart, and could provide us with a multi-year bullish interpretation. But, for now, this chart is presenting us with a very concerning structure and message. I will be watching this chart very carefully in the coming months.