EPD: A Pipeline Of Income Into Your Portfolio
 By
Levi
By
Levi
- With prior leverage and high valuations already washed out, we like EPD to move up over the next several months.
- Paying a higher dividend, the stock can provide a steady stream of income into your portfolio.
- What are the upside targets possible and what would be a warning to investors?
by Levi at StockWaves; produced with Avi Gilburt
These are the stocks that can provide us with high-probability setups. Why? We are able to find the synergy between fundamentals and technicals. Lyn Alden searches out the companies with the strongest foundations and then our lead charting analysts in StockWaves mesh those picks with technicals to paint a complete picture. Let’s look at what Lyn is seeing at the moment in EPD.
The Fundamentals With Lyn Alden
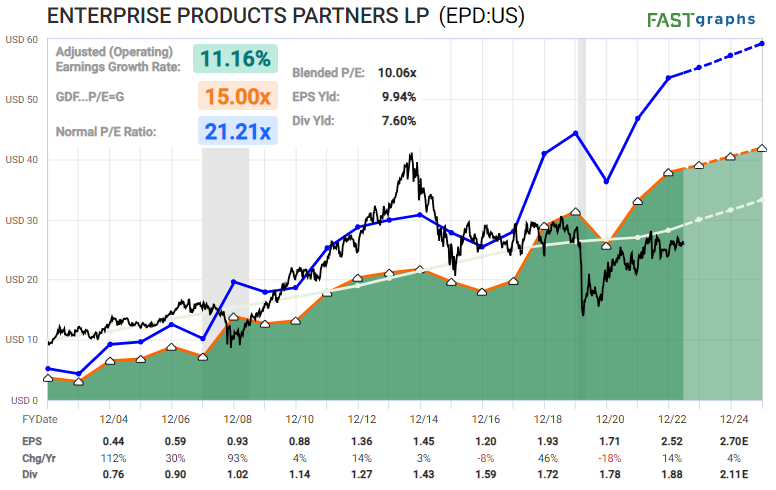
“Energy pipelines continue to be boring, high-yielding investments that have already washed out their prior leverage and high valuations. They’re boring but lucrative 5-10 year income vehicles with better yields than T-bills and whose distributions grow a bit each year.
I remain constructive on diversified pipeline companies, particularly including ones that have a lot of non-oil business lines. Enterprise Products Partners (EPD) for example has a large NGL and petrochemical transport business. It pays a 7.6% yield which is higher than T-bills, and has low double-digit annual distribution growth with a 25-year consecutive track record of annual growth. I continue to like it as part of a diversified portfolio.
(a note about stocks that provide a K-1: “Many of the c-corp pipelines currently offer mediocre valuations. The best pipelines currently are not c-corps, and instead have a bit of friction in them: they still have an MLP structure and issue a K-1 form during tax season. This keeps them out of a lot of ETFs and other funds, and gives them a lower average valuation.
For investors that buy into them with that lower valuation with a plan to hold for the long run, they get higher distribution yields, and any buybacks that occur are more impactful. The tax treatment, despite being more complex, is generally a bit better too [at least for American investors].)”
Now we need a specific structure to help us define risk vs reward and possible upside. As well, we show where this bullish scenario would need reassessment.
The Technical Picture With StockWaves
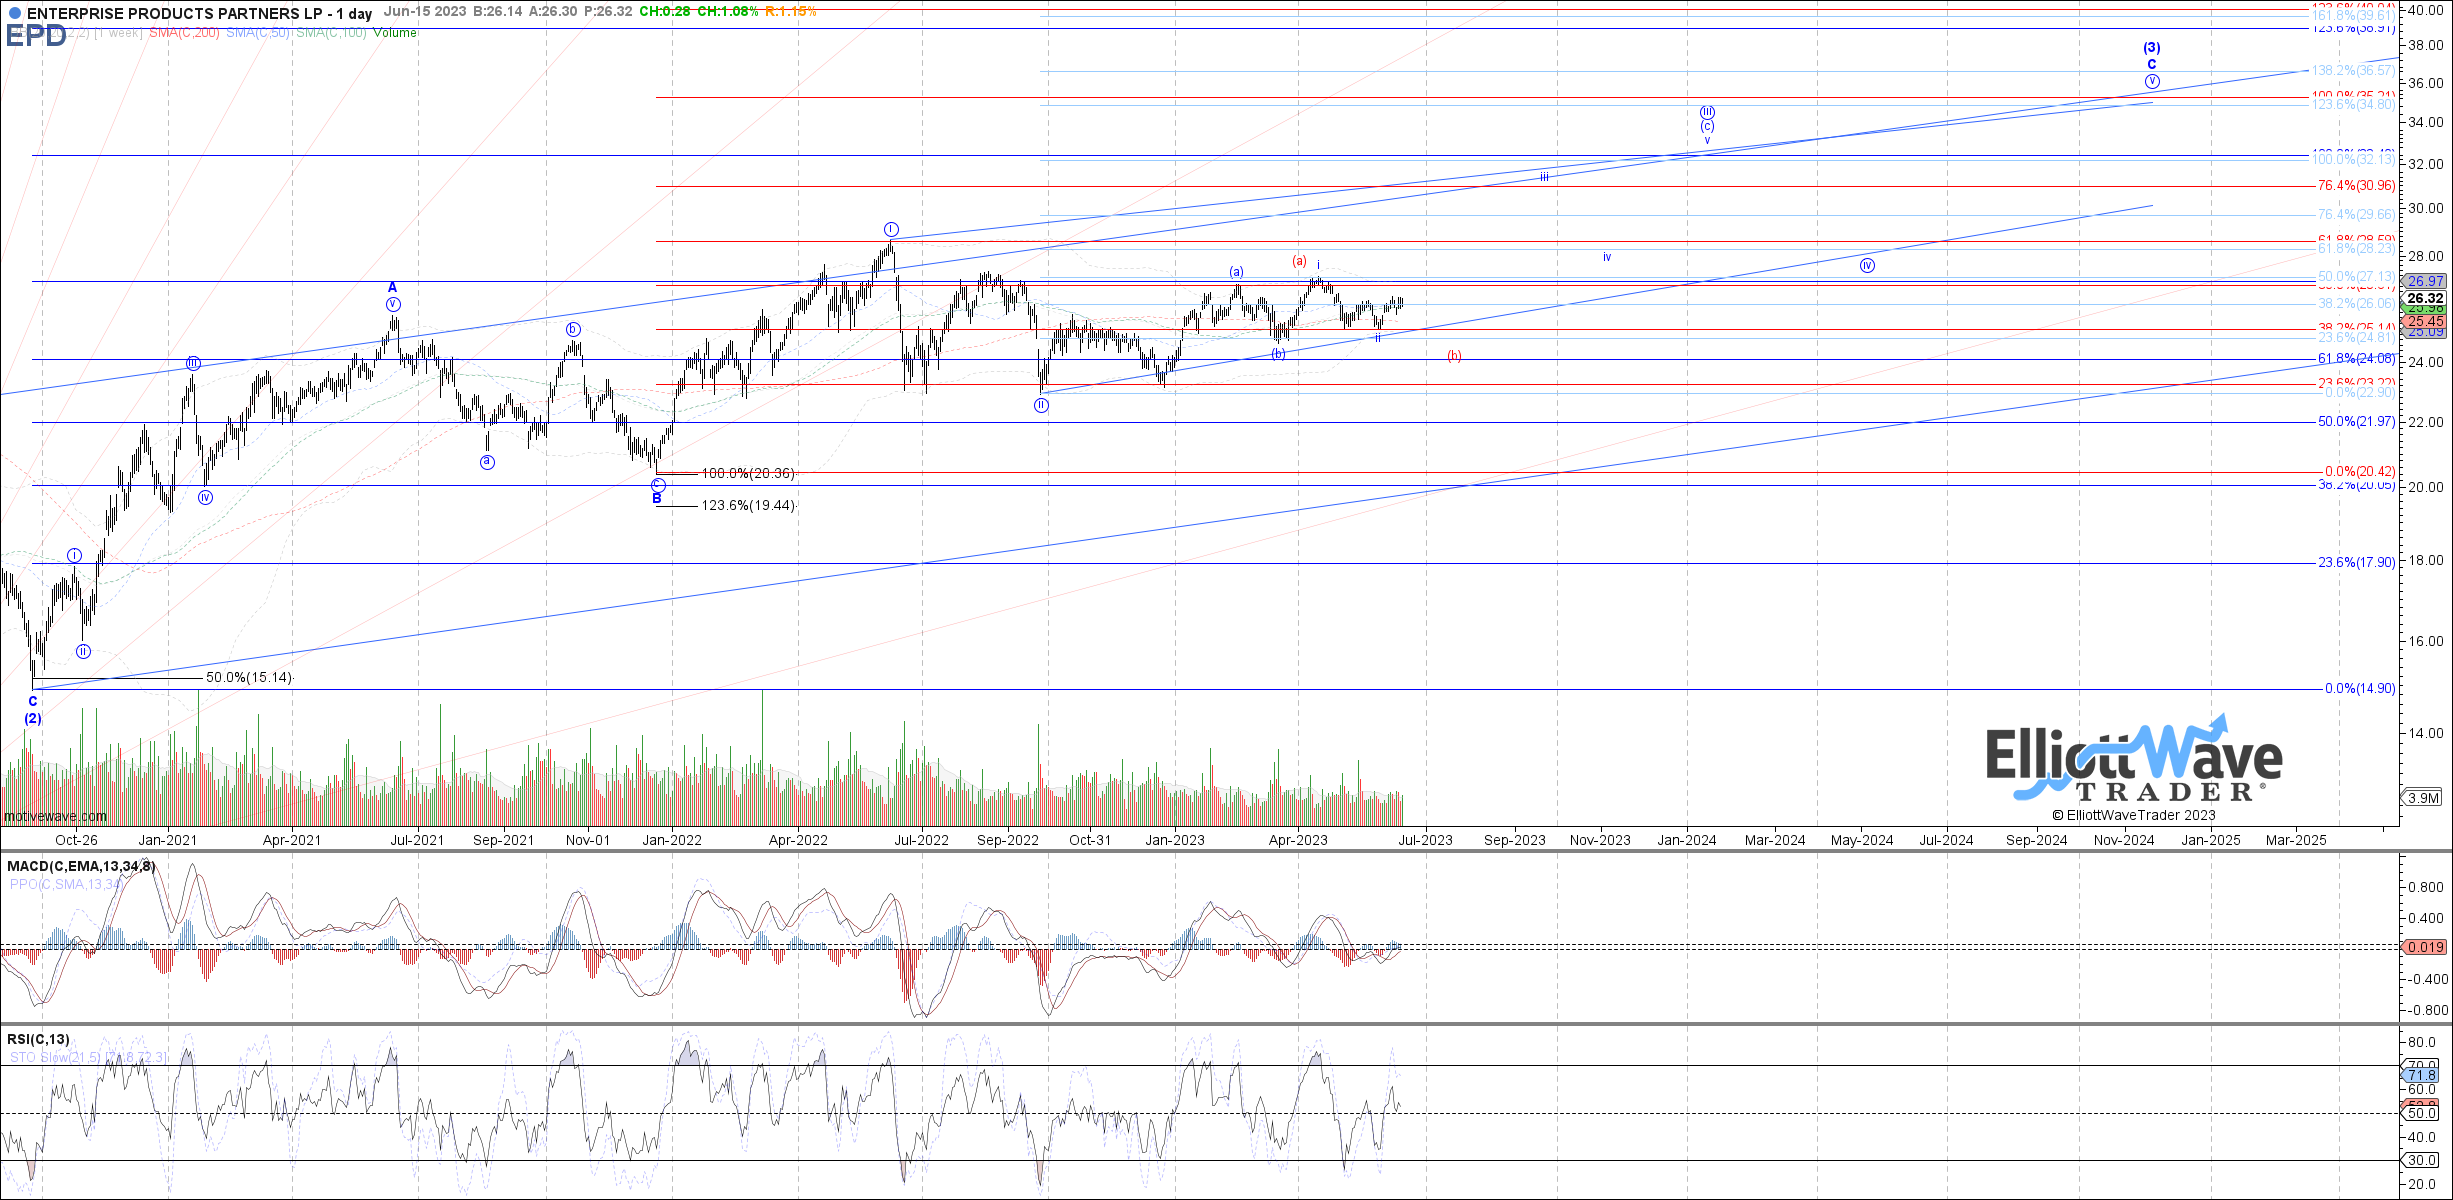
You can see that the low from the end of 2020 is the starting point for the current wave [3] rally. Typically, this 3rd wave should reach the 1.236 - 1.382 extension of the prior waves [1] - [2]. That points to the 32 area and ultimately to 36 to complete this portion of the move. While there may be some near term gyrations, ultimately this is a high-probability structure.
Why do we make this affirmation? This is based upon thousands of individual case studies across charts from all market sectors. We will briefly discuss this in the next portion below.
Risk: should price make a sustained move below the 20 level it would cause us to reassess this bullish scenario.
Phi and “Fibonacci Pinball”
Avi Gilburt has written extensively to the readership about our methodology and why it consistently provides key turning points in the market and the stocks in it. Here is a brief excerpt from our Education section at Elliott Wave Trader:
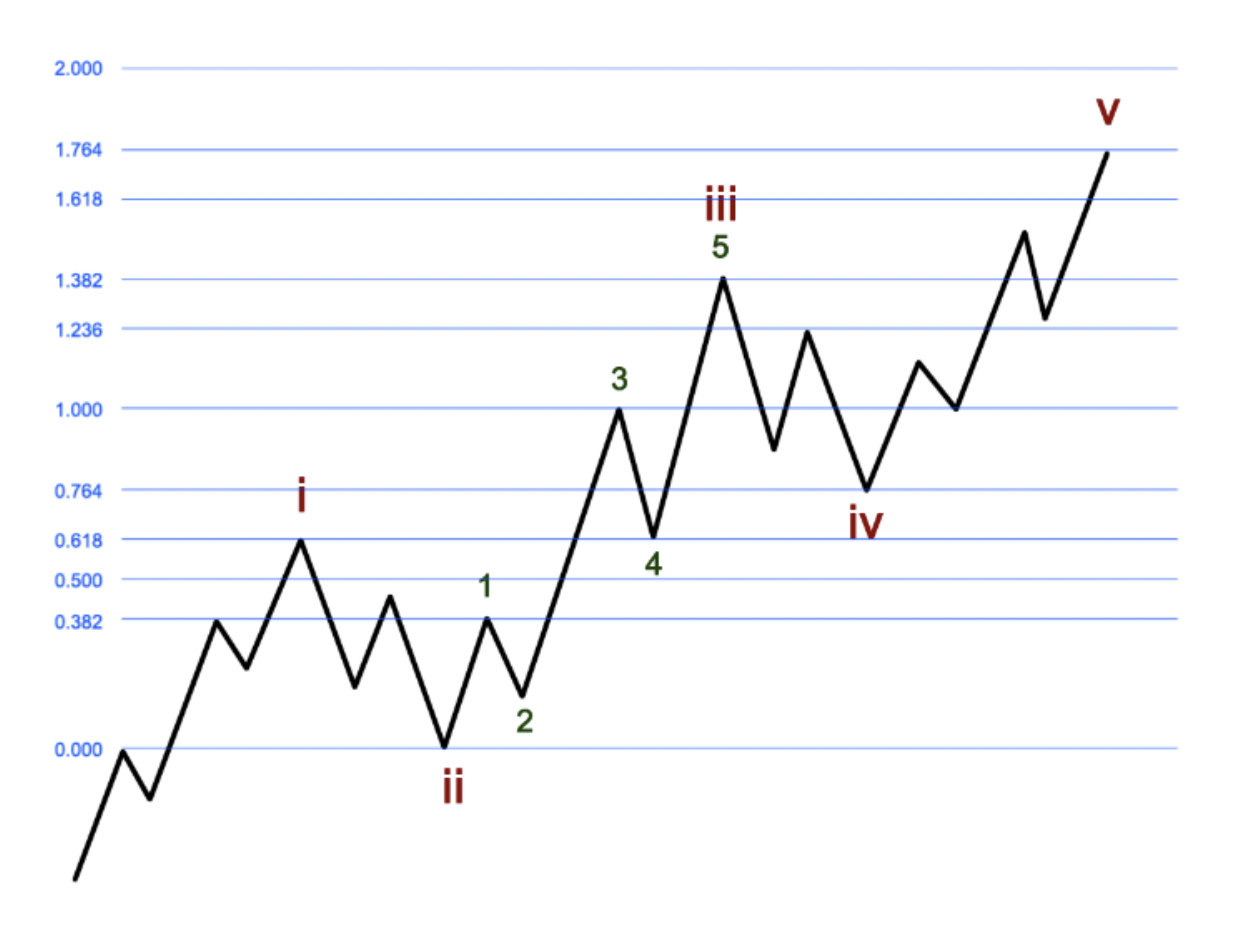
“When following impulsive or corrective counts, Fibonacci calculations of extensions and retracements, based upon Phi (The Golden Ratio), are essential when following a 5 wave or 3 wave move.
In effect, a 5 wave move usually moves in the direction of the trend, while hitting Fibonacci levels and reacting. For example, the standard Wave 1 will extend to the .382 or .618 extension of the entire move. It then pulls back in a Wave 2, generally to the .500 or .618 retracement level of the Wave 1. It is then followed by a 3rd wave that subdivides, and this is where an Elliottician makes the distinction between an impulsive 5 wave move or a 3 wave corrective move.
This is something I lovingly call ‘Fibonacci Pinball’. Ultimately, the way that we know that a movement within the market is going to be a 5 wave move as opposed to a 3 wave move happens during the potential Wave 3.”
How Does This Help Us?
Back in January of this last year when EPD moved through the 1.00 extension of the initial waves [1]-[2], it signaled that, after a pullback, it would eventually move higher. It also showed us that the 22 level was key support. In time, the stock pulled back to 22.90 and has since rallied again, currently at 26.50 at the time of this writing.
Yes, EPD could see another pullback before breaking to new highs above 27. But we find it more likely that 22.90 is already an important low and that EPD will find higher prices into the end of this year and perhaps into 2024.
Conclusion
Avi has also shared this fundamental point regarding our methodology:
“This theory has been proven time and time again throughout history. This is the basis behind the Elliott Wave, which is enhanced through the concept of Phi ; the Golden Ratio. These concepts have been understood by Plato, Pythagoras, Bernoulli, DaVinci and Newton. Historic structures have been built by architects of famous Greek structures, such as the Parthenon, and even as far back as the architects of the Great Pyramid of Giza in Egypt, who recorded their knowledge of Phi as the building block for all man nearly 5,000 years ago.
For a more detailed understanding of this concept and application, I highly suggest reading Elliott Wave Principle, by Frost & Prechter.”
There are many ways to analyze and track stocks and the market they form. Some are more consistent than others. For us, this method has proved the most reliable and keeps us on the right side of the trade much more often than not. Nothing is perfect in this world, but for those looking to open their eyes to a new universe of trading and investing, why not consider studying this further? It may just be one of the most illuminating projects you undertake.
