Dutch Bros Coffee (BROS): Break Time
 By
Levi
By
Levi
By Levi at Elliott Wave Trader; Produced with Avi Gilburt
Currently there is a strong growth narrative in play for Dutch Bros Coffee. They have stated that it is their intent to double their current footprint by 2029. To be sure, an ambitious and lofty goal. Reachable? That remains to be seen. In any event, it would seem that current sentiment believes in this end objective for the company. Why can we say this and what is likely next for the stock?
Let’s put this out there from the get-go: a narrative is a completely separate creature from sentiment. A narrative is a story. In the case of Dutch Bros it’s a story in motion that may or may not play out as drawn up. But quite openly it won’t be the story that leads the stock. Sentiment, i.e. crowd behavior, will show us the likely turning points on the chart.
Ultimately we can believe in a growth story with all our heart but if crowd sentiment does not follow, beliefs will only get us so far up the field running against the movement of the market. So, we use both sides of analysis, fundamentals and technicals. Then we seek the synergy between them to find the best setups.
More About Dutch Bros Strategy
Barron’s had an interesting piece regarding many of the metrics that (BROS) is stretching in its current strategy (see full article here).
Some key comments from the article:
“Cheerful workers known as ‘broistas’—a play on the word barista—chat with customers who line up at drive-through lanes or walk-up counters and sometimes deliver the drinks to their cars.
The business model is helping Dutch Bros gain market share in a sector dominated by a few big players. Since 2021, Dutch Bros has doubled its footprint to nearly 1,000 stores, primarily in the West and the South. In 2024, it expanded to the East Coast, opening new stores in Florida.
The company’s total revenue has increased by more than 30% each year since 2020 and is expected to do the same in 2024. Wall Street expects the momentum to continue, forecasting at least 20% annual sales growth in 2025 and 2026. Earnings are expected to jump from 30 cents per share in 2023 to 71 cents in 2026.”
Ebbs And Flows Of Emotions
Whether we realize this or not, crowds behave in a much different manner than individuals. This has always been the case along all of human history. However it was just recently, relatively speaking, that certain keen observers took note of how to measure these behaviors using mathematics.
Avi Gilburt has studied this field extensively and frequently shares his findings and conclusions with our readership. You can peruse our entire education section here:
In amongst the many articles, you will come across some fascinating history in the development of our methodology and why it works. Here is an excerpt from an introductory article regarding Elliott Wave Theory and how we use it. Now, please keep in mind that when this theory is correctly applied, it will provide context to where we find ourselves in the markets at any one point in time. We know of no other methodology that can do this. This is not hocus-pocus, balderdash, poppycock, or anything of the kind. It is rudimentary human behavior playing out before our very eyes via the structure of price on the charts. Here is the excerpt:
“So, if you are interested in a methodology which will open your minds and eyes as to how markets really work, then let’s move right into the overview.
Back in the 1930s, an accountant named Ralph Nelson Elliott identified behavioral patterns within the stock market which represented the larger collective behavioral patterns of society en masse. And, in 1940, Elliott publicly tied the movements of human behavior to the natural law represented through Fibonacci mathematics.
Elliott understood that financial markets provide us with a representation of the overall mood or psychology of the masses. And, he also understood that markets are fractal in nature. That means they are variably self-similar at different degrees of trend.
Most specifically, Elliott theorized that public sentiment and mass psychology move in 5 waves within a primary trend, and 3 waves within a counter-trend. Once a 5 wave move in public sentiment has completed, then it is time for the subconscious sentiment of the public to shift in the opposite direction, which is simply the natural cycle within the human psyche, and not the operative effect of some form of ‘news’.” - Avi Gilburt
Let’s Put This To Work For Us
Theory is wonderful but we need actionable intel to put into practice for our trading and investing. Alright, let’s do exactly that. In StockWaves we regularly share both bullish and bearish scenarios in Wave Setups. This feature will clearly spell out what we are seeing on each individual chart along with key price levels that will either further confirm said scenario shared or where it might invalidate. Here is the recent Wave Setup for (BROS):
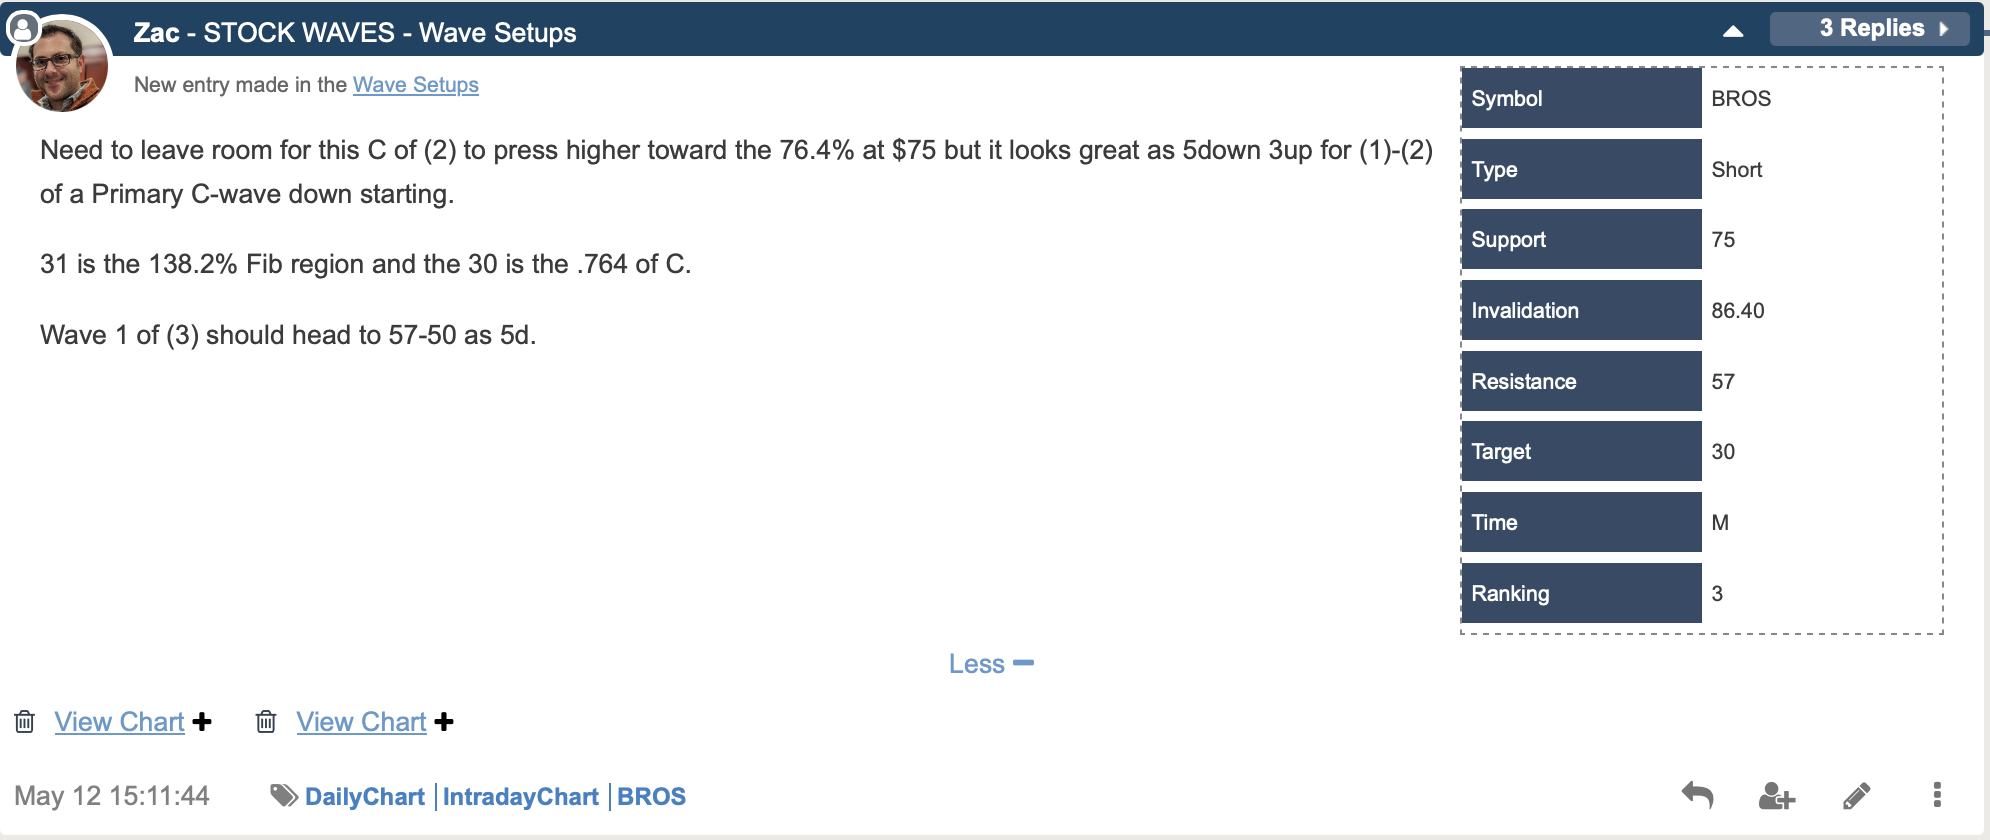
Note that Zac commented about the possibility of a near term bounce to complete the corrective move up after the initial decline. It would seem that we are potentially nearing the finish of that bounce. Here are the latest chart updates from both Zac and Garrett.
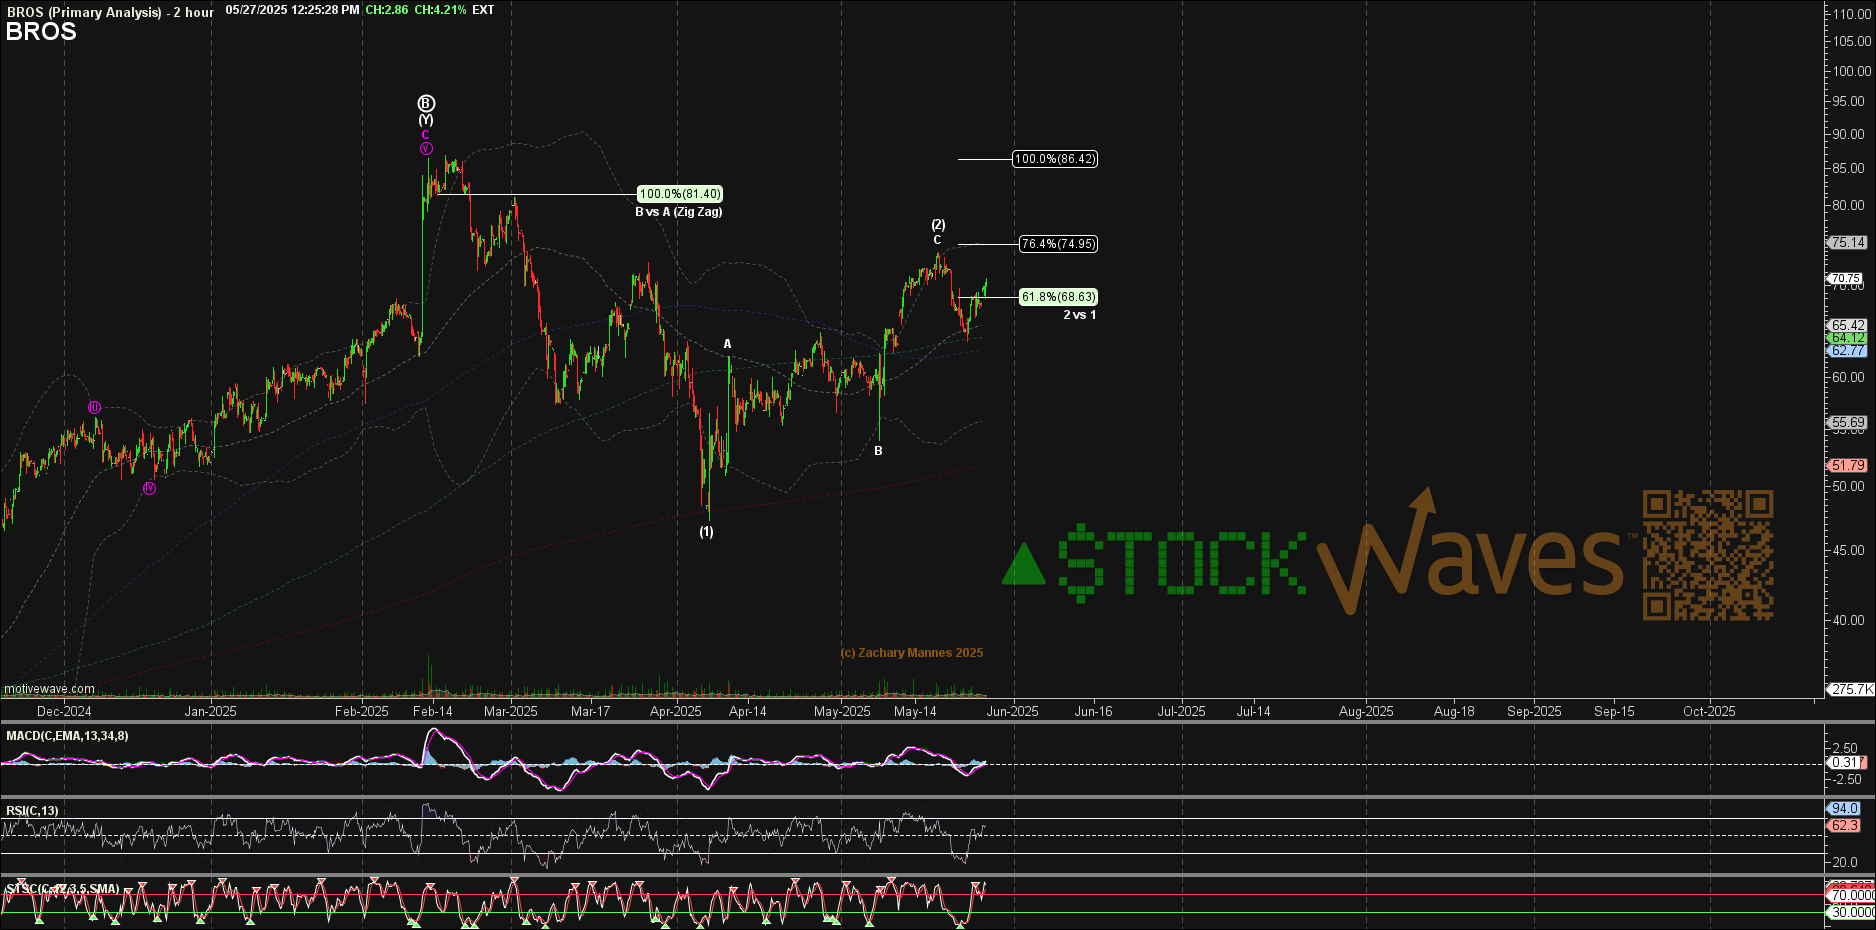
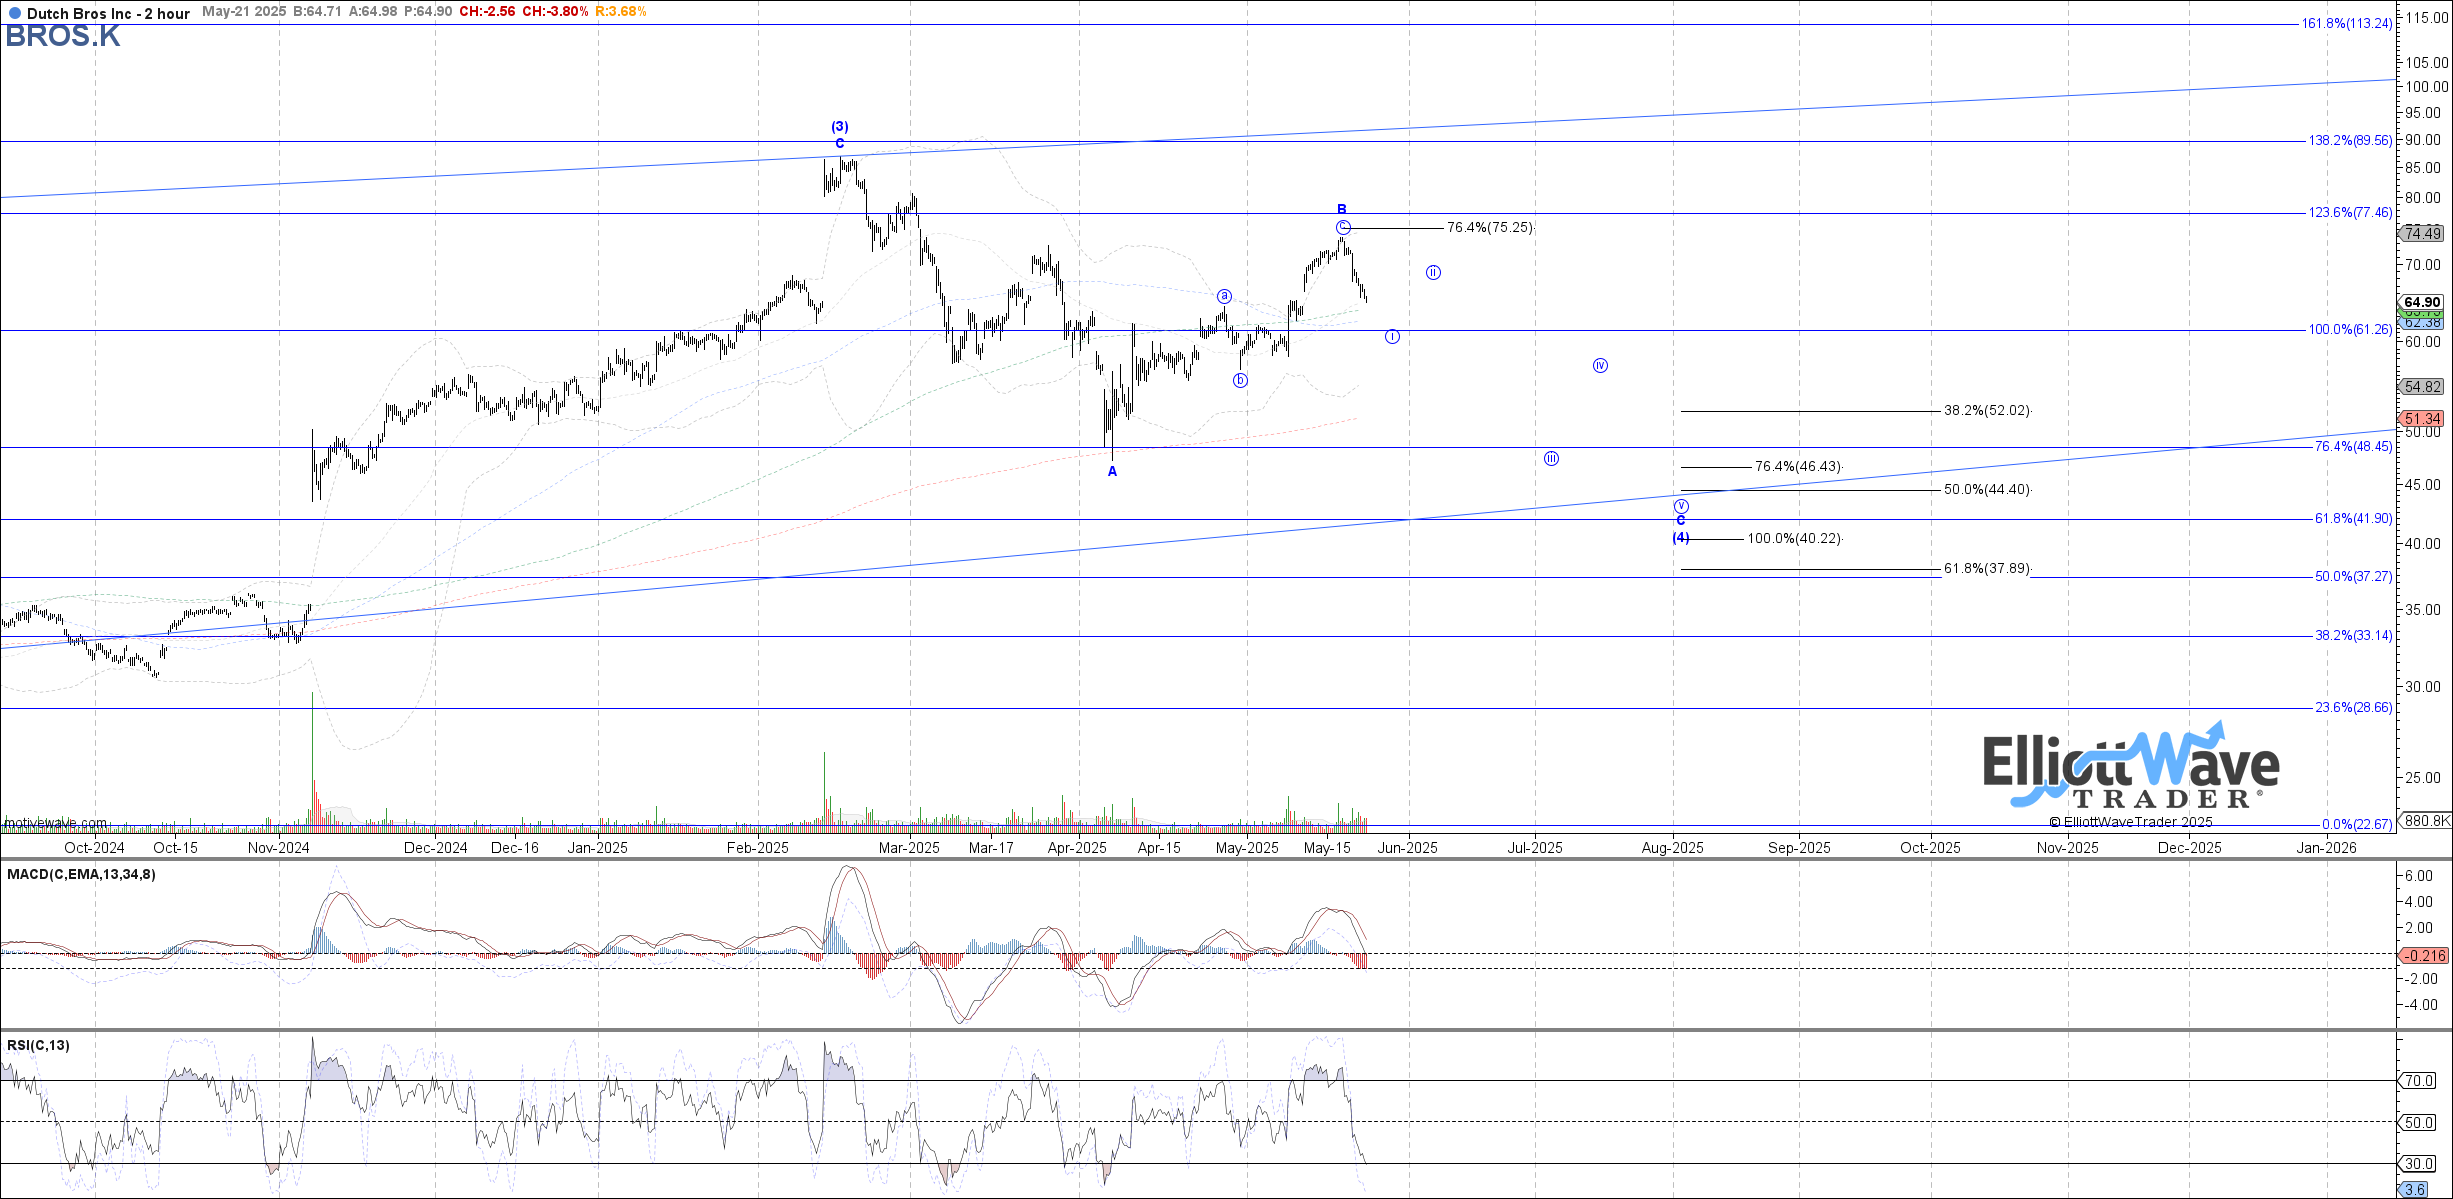 While each analyst has a slightly different read on what the last major high represents, both are inline with the idea of a near term correction in price. So let’s focus on what they are both seeing over the next several weeks. Once complete the structure of price thereafter will help clarify what the next likely larger move will be.
The near term caveat to the downside setup would be if price moves above the recent high at the $74 level. Should this take place then the $77 area opens up as possible. To instead see a sharper downside move, price should break below $64. This would then likely open up the possible targets of as low as $40 over the next several weeks to months.
The reason for this current caution is the move up from the low struck back in early April is clearly 3 waves. This suggests that it is the beginning of a corrective bounce. Where that bounce terminates is what we seek at the moment. Once complete, (BROS) shows a higher probability of a deeper correction before attempting the resumption of the larger rally structure over the long term.
Do You Have A System In Place?
Those who have experience forged by time in the markets will tell you that it's imperative to have a system of sorts in place. You need to be able to define how much you are willing to risk versus how much gain is likely. Those who survive across the decades in the greatest game on earth will also inform you that the preservation of capital is paramount.
While there are multiple manners of doing this, we have found Fibonacci Pinball to be a tool of immense utility for traders and investors alike.
I might also suggest giving this methodology a fair shake. Why? If you have heard of Elliott Wave Theory, what was the source? Surely, you would want to consult someone who has performed an in-depth study of the how's and why's of the method. As well, this comprehensive investigation would be backed up with published studies on the matter and a body of work that shows the utility of said methodology in real-time. Give this new-to-you way of viewing the markets a chance. You may just find a wonderful ally to accompany in your trading and investing journey.
