Don’t Get Too Excited Just Yet
If I may remind you, this was the conclusion of the metals update from the past weekend:
“So, I think it is reasonable to expect a rally to begin in the coming week. And, clearly, we will track the nature and structure of that rally to offer a bit more clarity to the smaller degree structures we have presented on our charts. But, the main point I want to convey is that I want to urge each and every one of you to maintain patience over the coming weeks. The GLD/GC chart is presenting us with a very bullish structure, portending a major rally will likely be seen, likely starting in early 2024, and likely carrying us through the year. Yet, we may still have some further frustrating action to be seen in the coming weeks before that rally can take hold.”
And, we are now seeing that rally I expected. However, just because we are getting a rally does not mean that the market is ready to break out into the heart of the 3rd wave just yet.
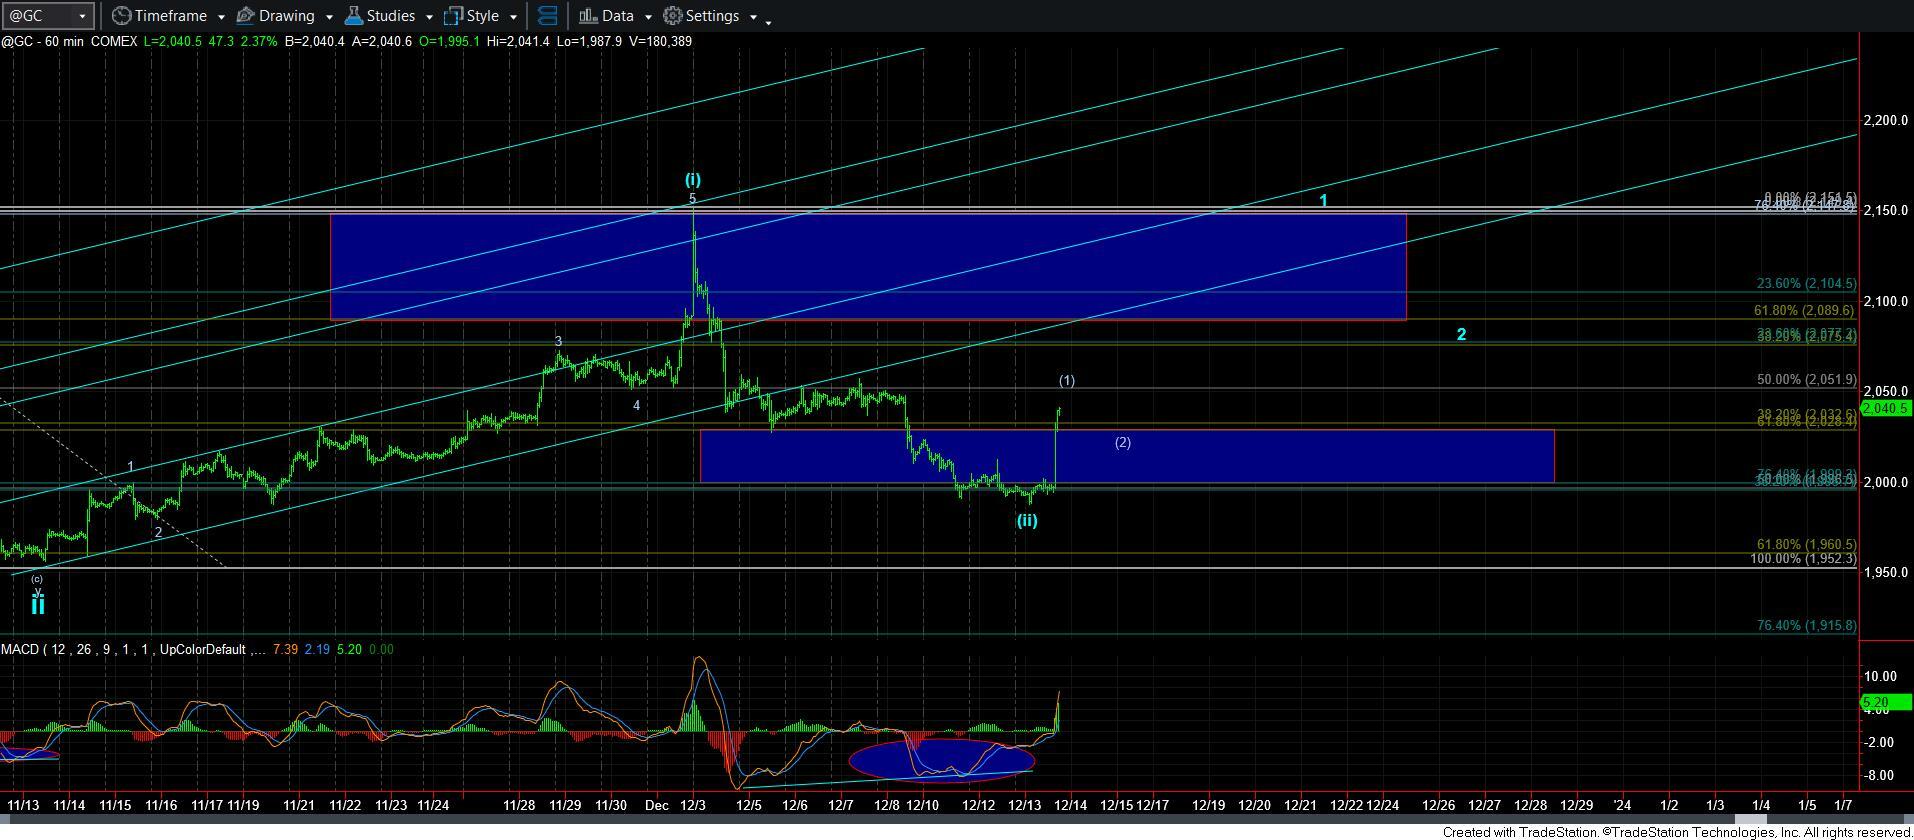
Let’s start with GLD again. During the week, I noted in an alert that I am now viewing the potential presented in the GC chart as a lesser probability. But, I will say that the rally thus far off the low is looking relatively impulsive. I would like to see a 4th and 5th wave take us a bit higher towards the 2050+ region for me to consider that potential again. (But, at the same time, remember that a-waves can be 5-wave structures as well, in the minority of circumstances.) However, I will continue to track this potential on the 60-minute GC chart. And, as you can see, that (1)(2) would project a larger wave 1 of [iii] back up towards the highs. Should that complete in the coming weeks, then we will go on a break out alert.
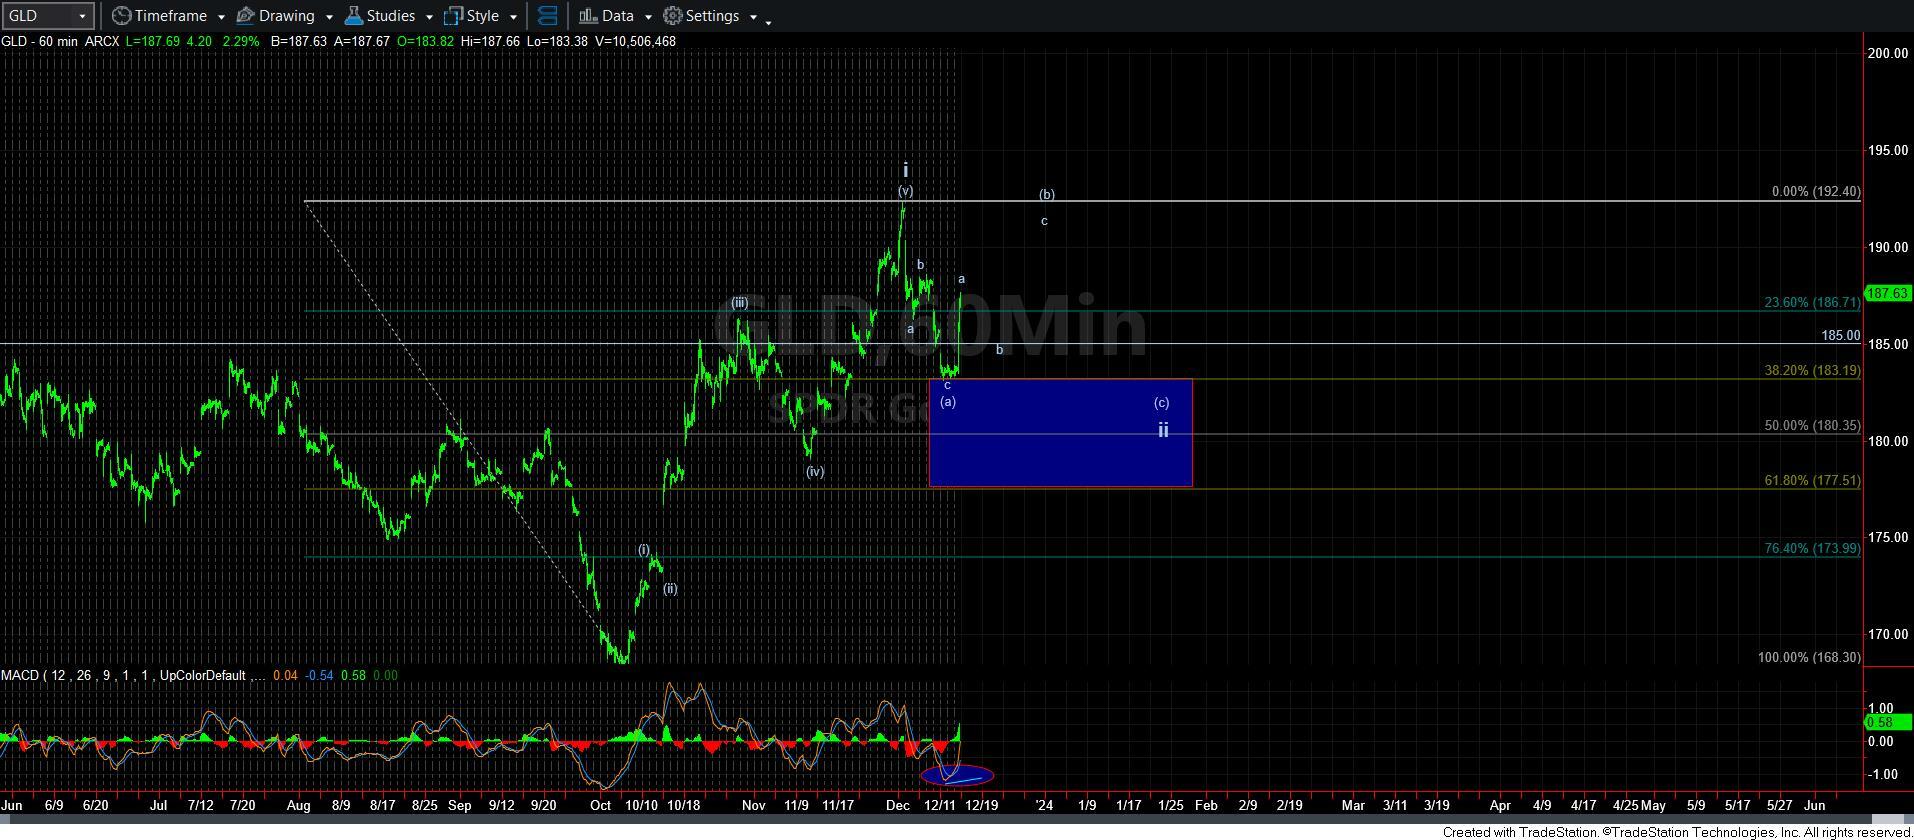
So, for now, I am sticking with the 60-minute chart on the GLD, until proven otherwise. On that chart, we have reached the .382 retracement of wave i, which is the standard target for the [a] wave of a 2nd wave. Thereafter, as you already know, I am expecting a [b] wave rally. And, this rally is likely the a-wave of that [b] wave.
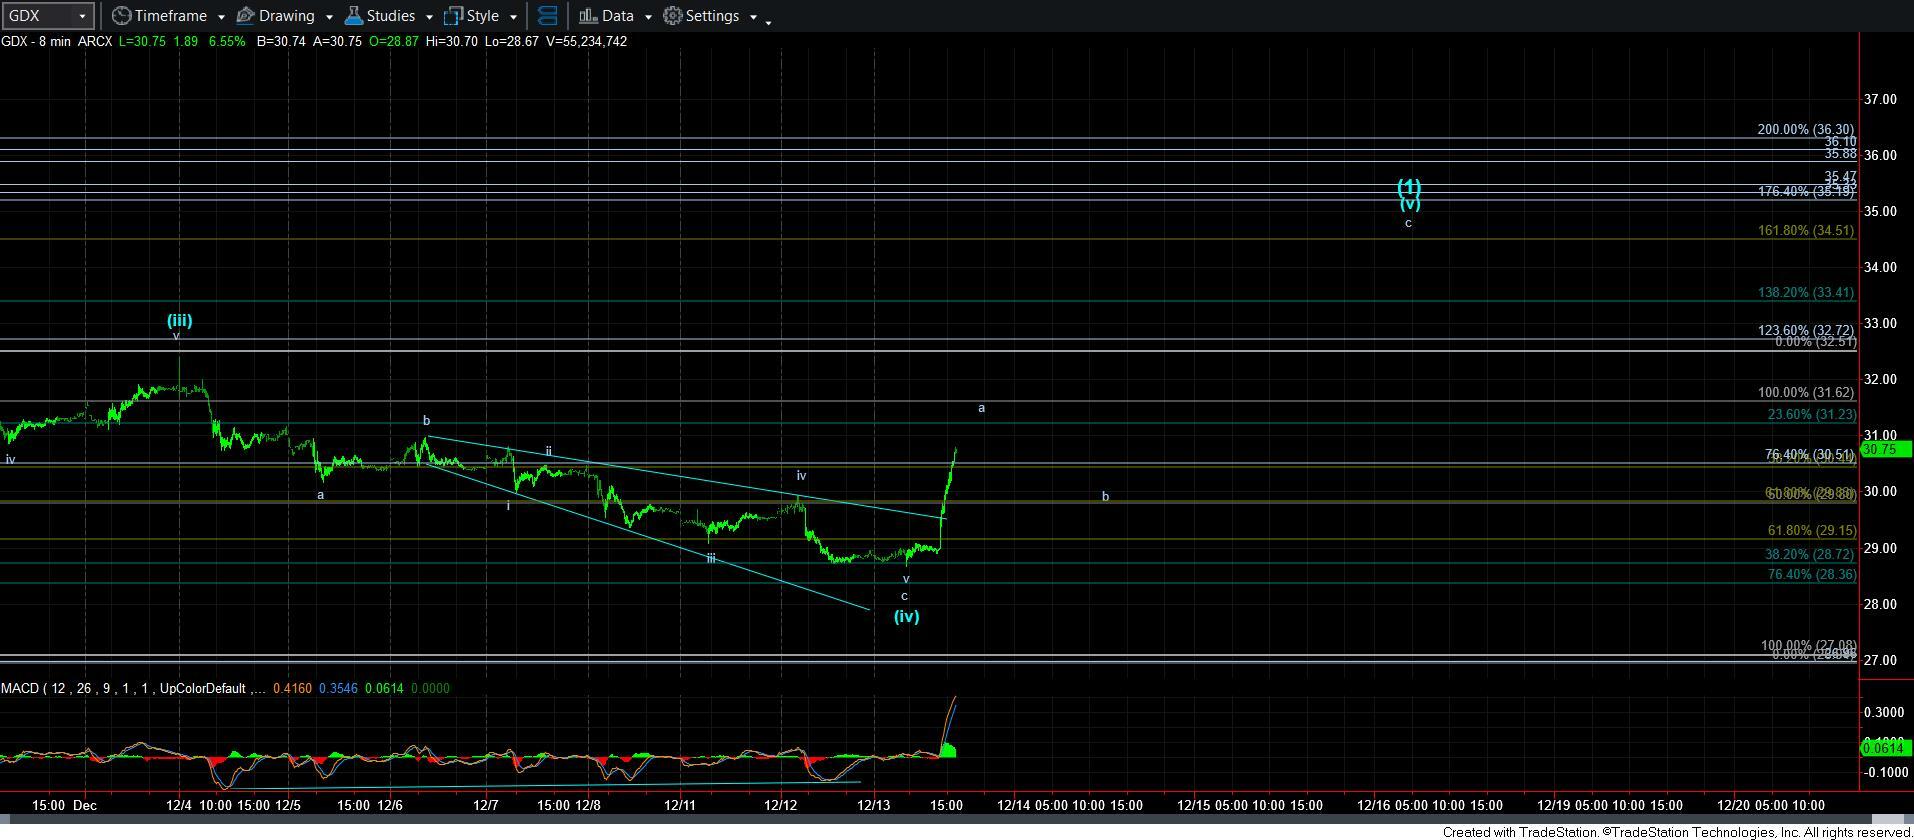
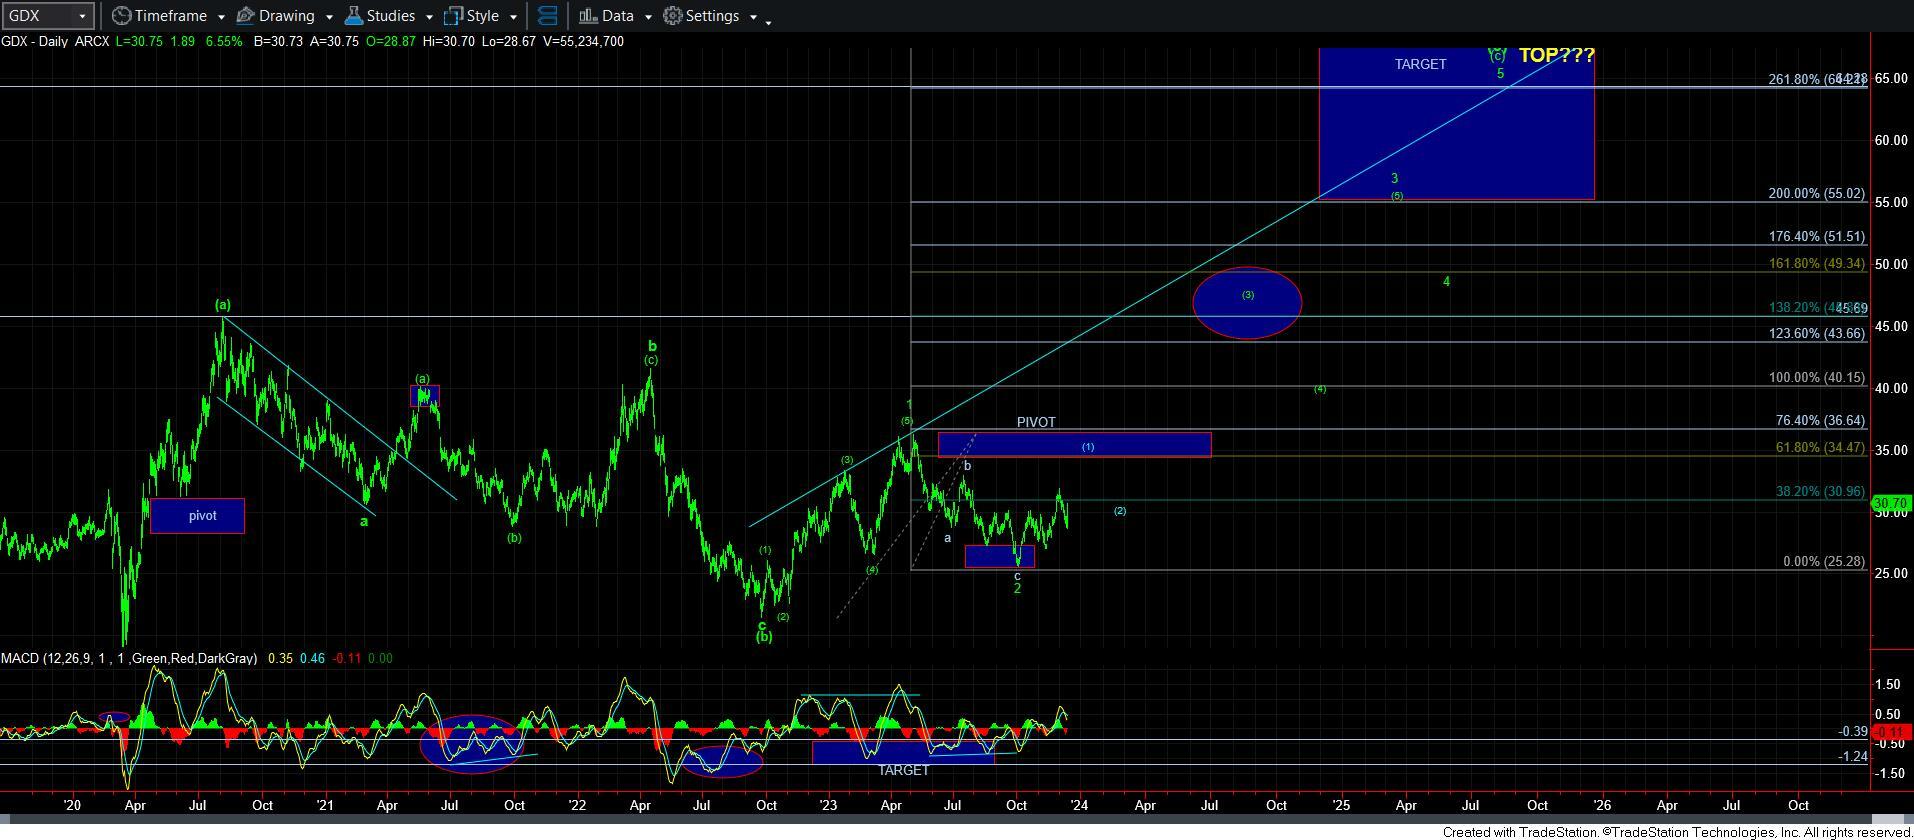
Moving to the GDX chart, I am now thinking that the structure that makes the most sense for a bullish set up is the leading diagonal for wave [1].
First, I want to remind you that we are seeing a theoretical move in GDX that I would like to highlight. As I have been outlining, the c-wave of this pullback had been taking shape as an ending diagonal. And, when an ending diagonal completes, it often retraces quite quickly to the region from which it began. And, I think that is what we are now seeing in this rally off today’s low.
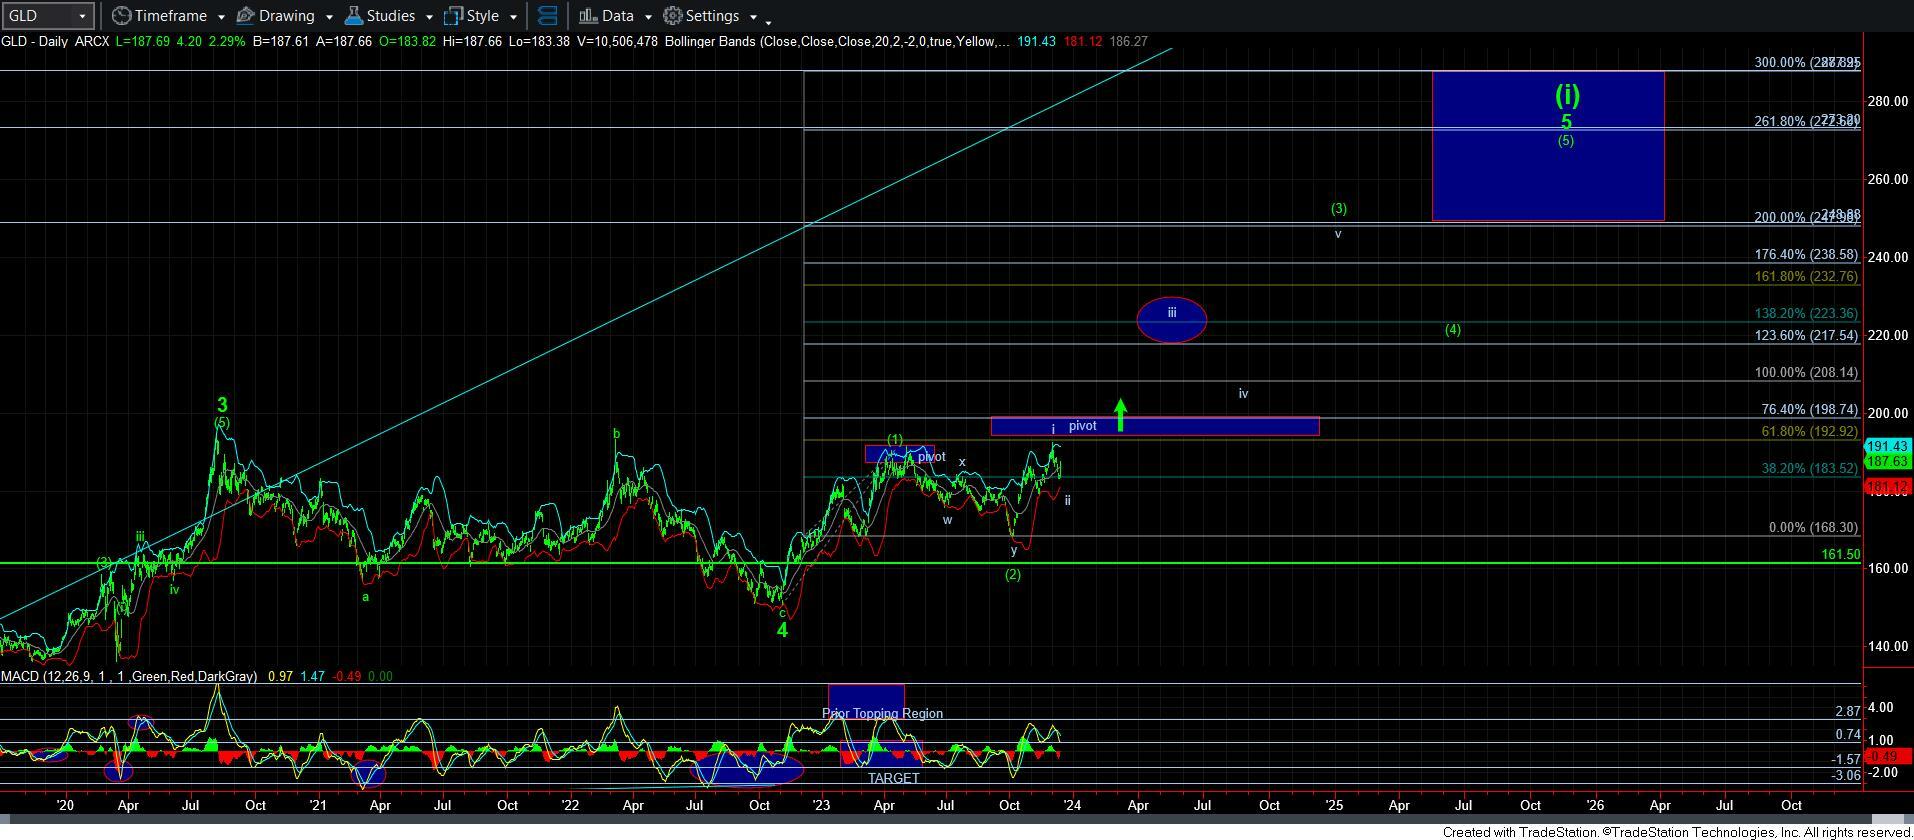
I am counting this rally off the low as the a-wave of wave [v] in the leading diagonal wave [1]. That means we should soon see a corrective pullback in the b-wave, and then begin a c-wave rally to the 34.50 region. The reason I have that as a target is two-fold. First, that is the 1.618 extension of waves [i][ii], which is the minimum target we usually expect for a 5th wave in a leading diagonal. Second, since wave [1] of a 3rd wave often targets the .618 extension of the larger degree waves 1-2, as can be seen on the daily chart. That is also the 34.50 region. So, this provides for some nice confluence for a target for this 5th wave, assuming we do get it.
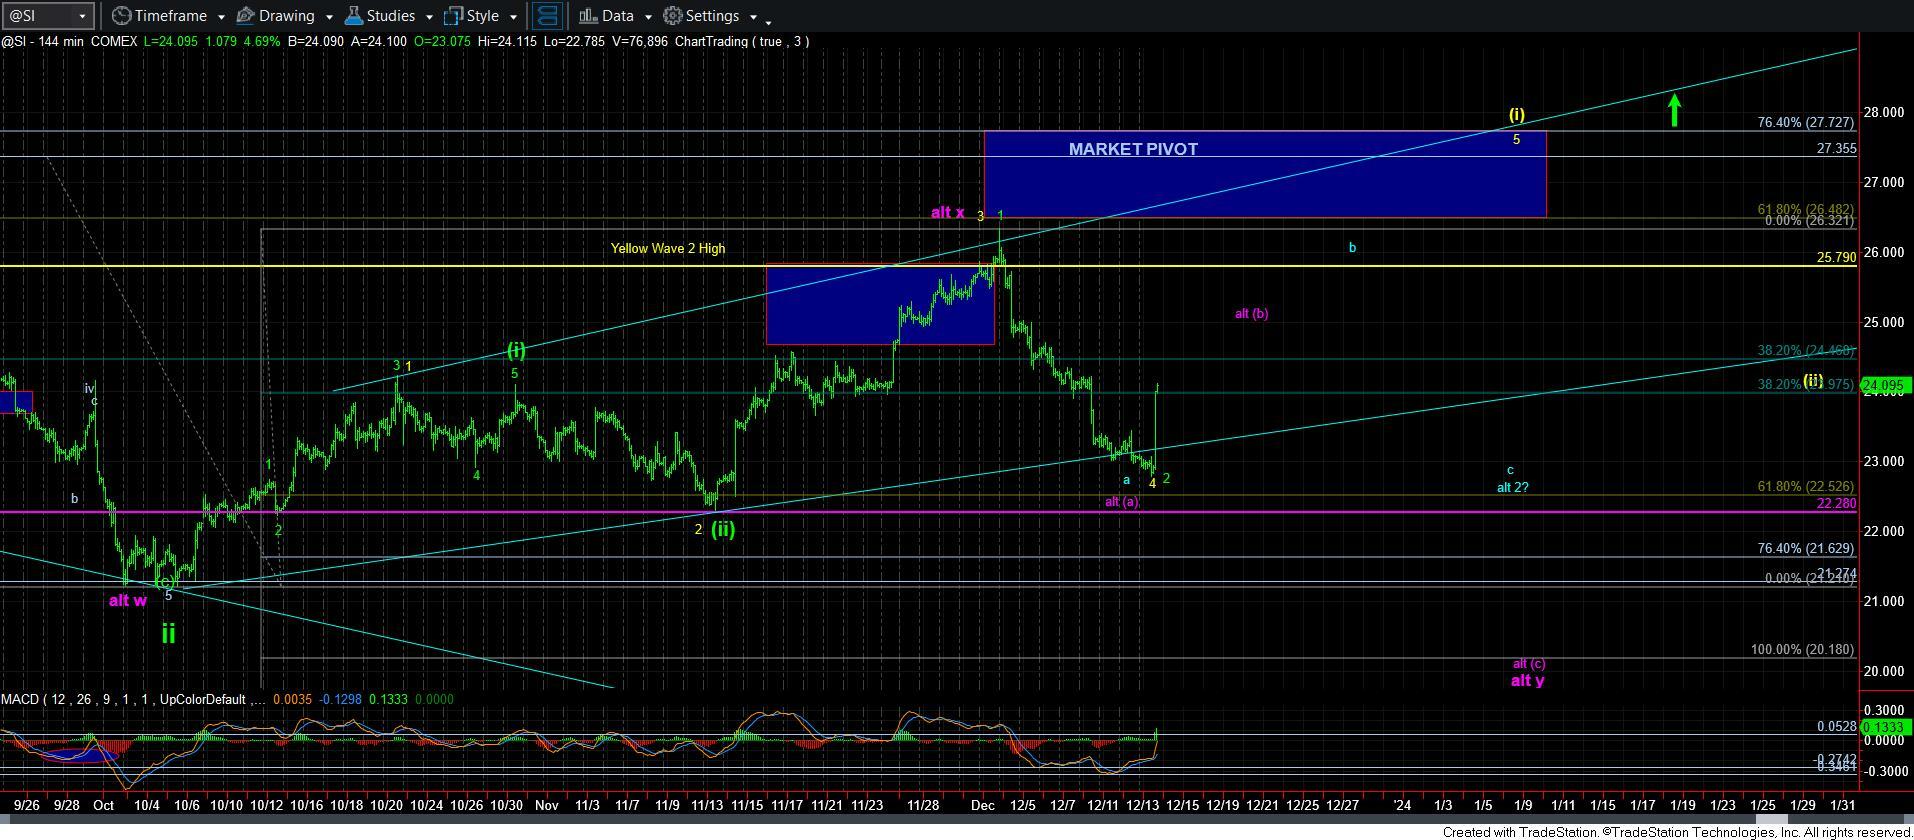
This now brings me to silver. And, this is the most messy of all the charts at this time. If I was to have my druthers, I would say that we are starting a 5th wave in a leading diagonal in silver as well, which is outlined in yellow. But, we would have to see some massive extensions in the coming weeks in silver, and some massive out-performance in silver for this to occur. And, it would also likely coincide with the more bullish count in the GC chart as well.
However, I still have to be a bit concerned with the purple count. While I had expected that a break of the prior alternative yellow count would have avoided another trip down to the 20 region in silver, I clearly was not able to foresee this potential that I am now outlining an alternative in purple. So, my apologies for not being able to foresee this potential earlier.
However, in the event that we break down below today’s low, then it likely points us down to the 20 region to complete a larger and more protracted wave ii. And, I would suspect this would coincide with the bigger wave ii I am tracking in GLD. But, even if this does occur, I am going to surmise that you will not likely see a 20 handle for very long. I would expect that the reversal off that low to be quite strong and signal that a 3rd wave has finally begun in silver.
In other words, I do not think it will take us beyond January until silver is going to give us a strong indication that the 3rd wave we expect to begin in 2024 is taking hold. So, I will urge you not to get too cute with your silver positions.
In the meantime, it seems that the rally we expected to begin this week is now underway. There are several paths this rally can take, and I will clearly be tracking them over the coming several weeks. Should the market provide to us more of an immediate bullish expectation in silver and gold, then we will be preparing for a break out in the heart of a 3rd wave sooner rather than later. But, for now, I am going to be starting by tracking the more conservative approach being presented on the 60-minute GLD chart. And, should that play out, and silver not provide us with a massive move higher, then it would increase the potential for the more expanded purple count for the slightly deeper wave ii down to the 20 region before we are ready for the 2024 rally I expect.