Do The Bears Have A Surprise In Store?
There are times when the market is set up in a posture that makes analyzing its next move rather easy. At this time, we are in such a posture. And, the coming action will be governed by our Fibonacci Pinball structure.
While we use Fibonacci Pinball to provide us with rather accurate levels at which we can expect turning points in the market on both the upside and downside, we also use it to differentiate between an impulsive structure or a corrective one.
Most specifically, we use the .618-.764 extension of waves [i] and [ii] as our market pivot to guide us in our market analysis. When the market rallies to the 1.00 extension of waves [i] and [ii], a break back down below the market pivot tells us that we are not likely in an impulsive structure, but, rather, in a corrective one. However, if the market pulls back correctively to the market pivot, and then continues beyond the 1.00 extension thereafter, then it is strongly suggestive of an impulsive structure continuation.
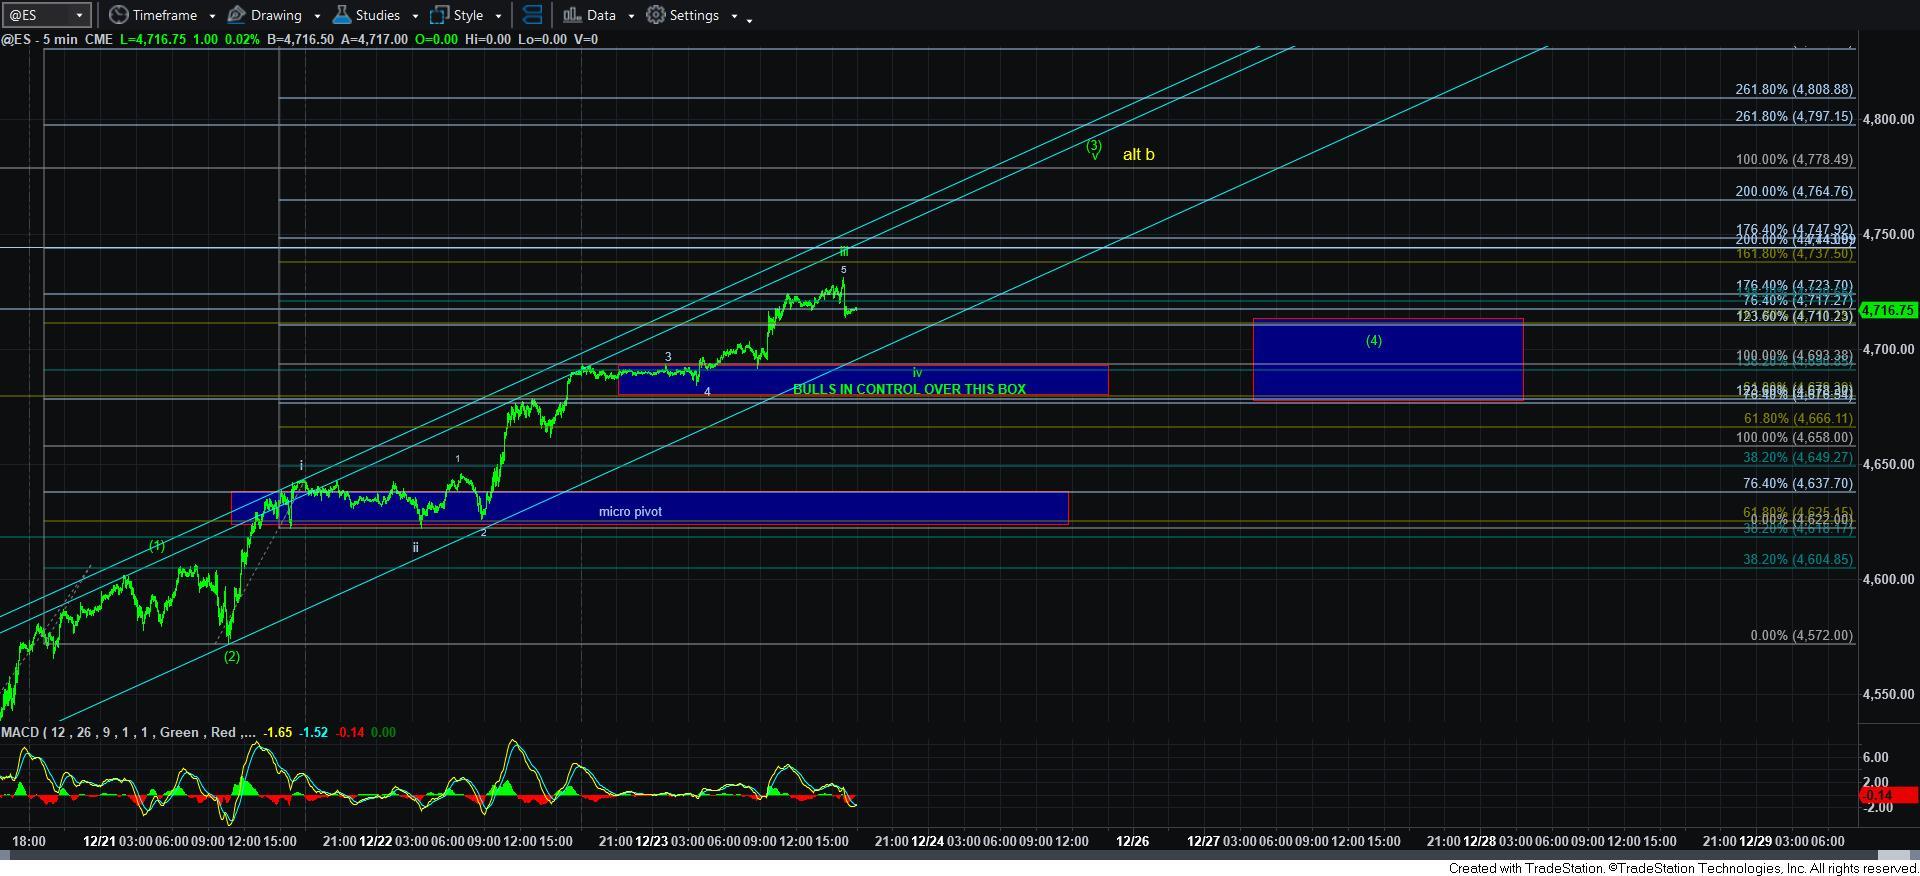
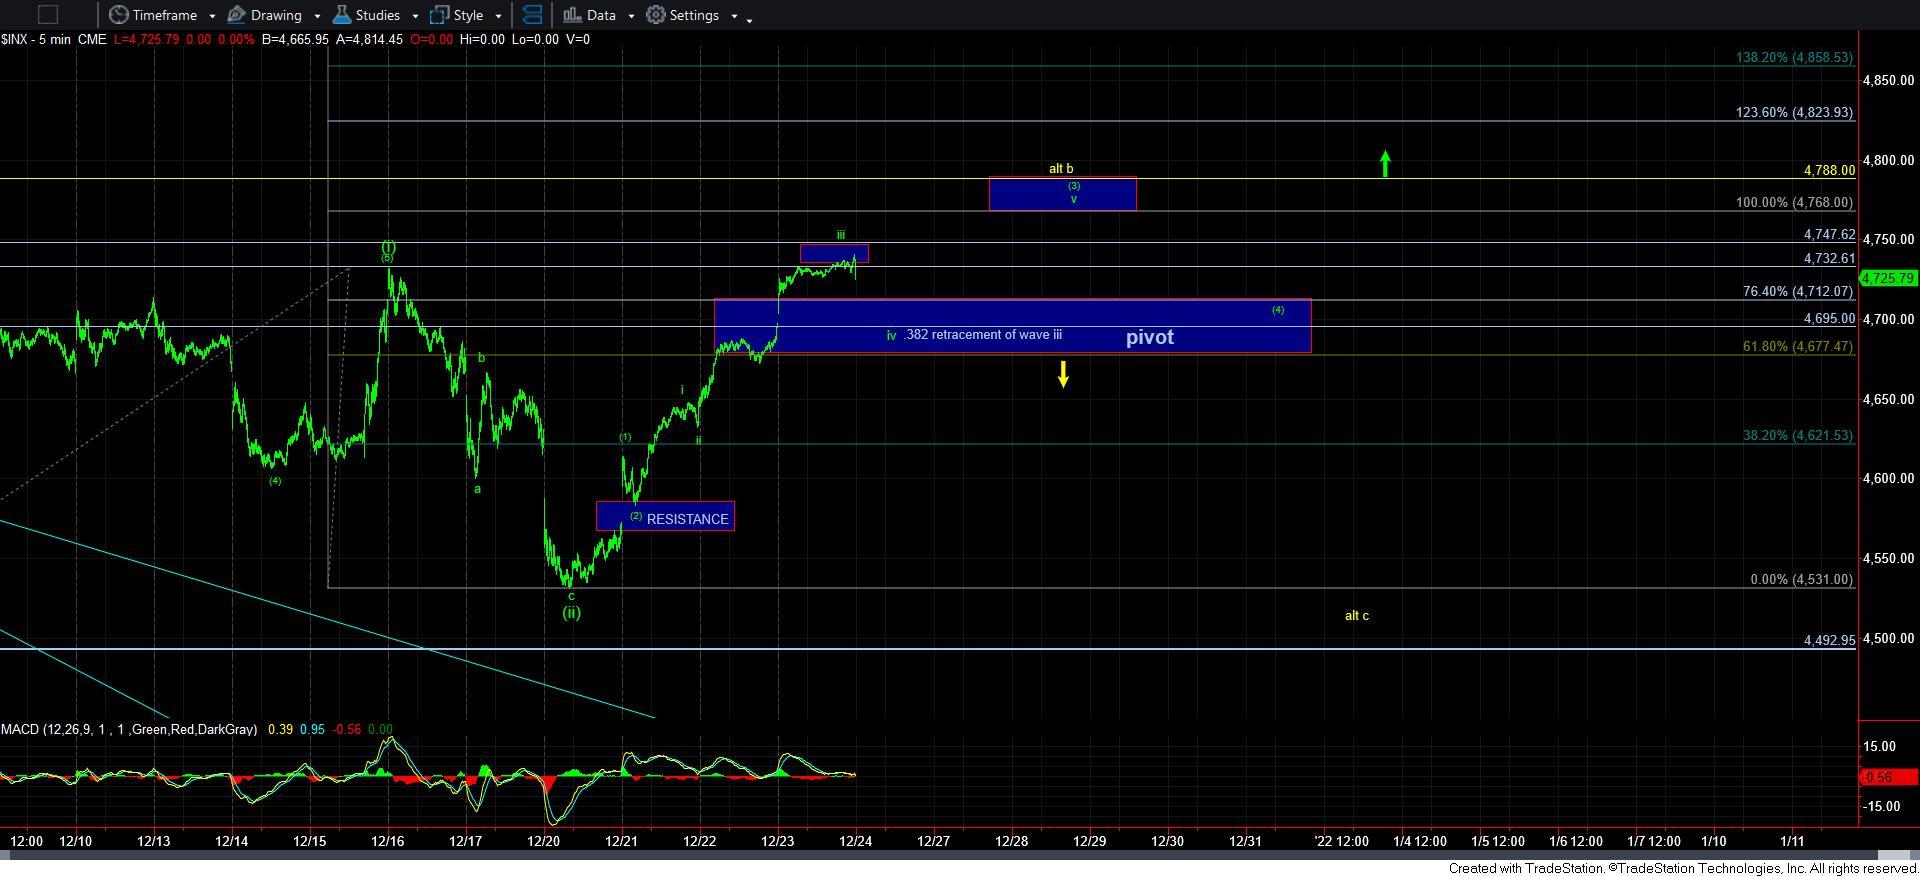
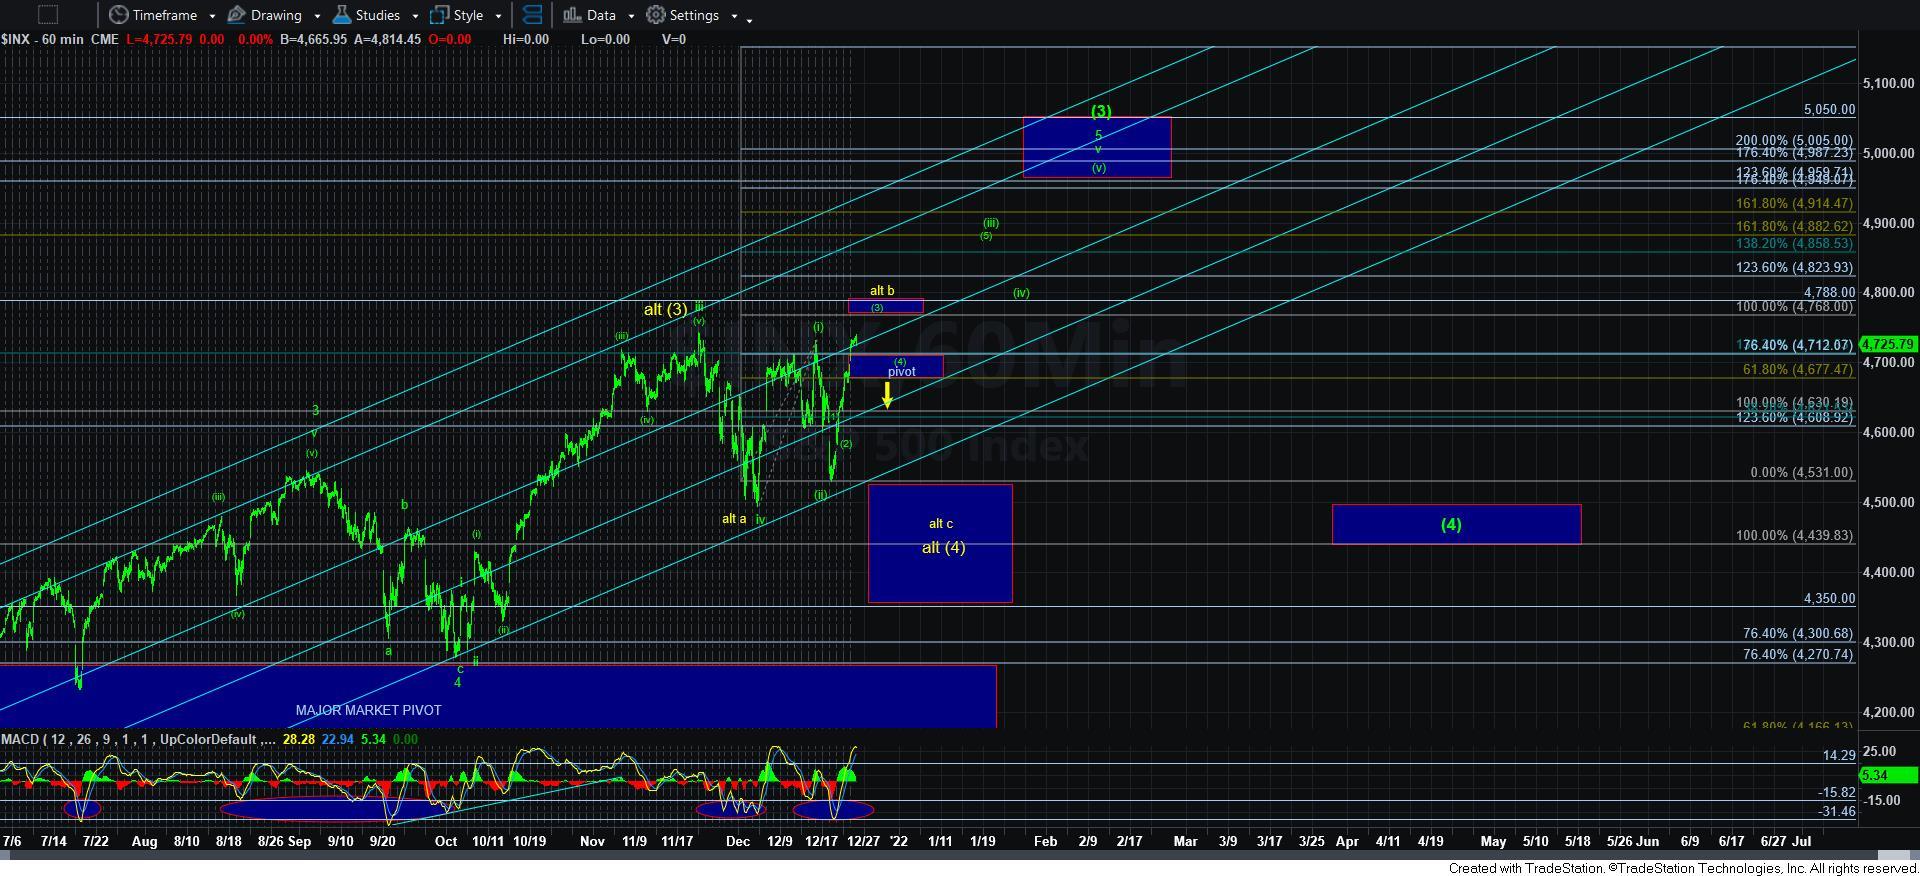
In our case, we have our potential waves [i] and [ii] in place, which has been the green count we have been tracking off the early December low. And, this past week, we have moved through the market pivot of that wave degree. You can see that pivot delineated by a box on the 5-minute SPX chart, as well as on the 60-minute SPX chart.
As I noted earlier this past week, the former yellow alternative count we were tracking became significantly less likely once we broke through the resistance region I outlined earlier, therefore, I have taken it off the chart as it was presented before. Moreover, I also took the triangle count off the chart once we broke over the 4732SPX region. While there is another triangle pattern that could still be in play, I am trying to keep the analysis simple this weekend. But, keep in the back of your mind that if we see a breakdown below support (4677SPX) in the coming week in a corrective fashion, then I will bring back the triangle count.
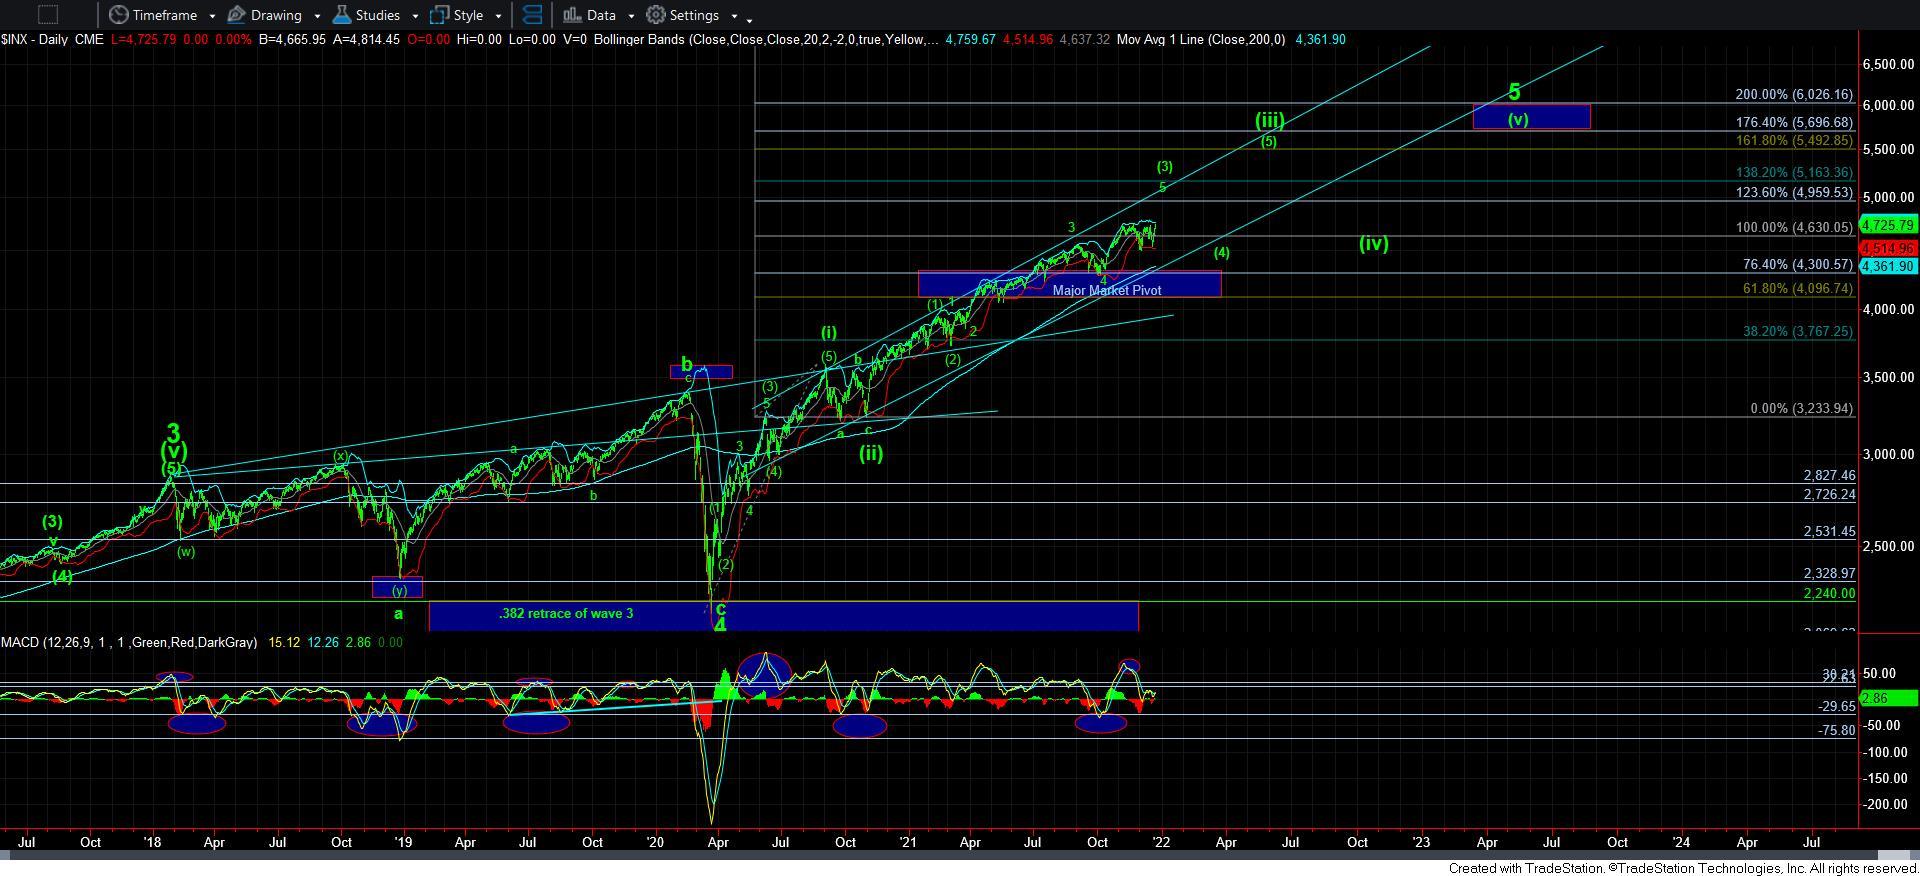
In the meantime, we are still very much in the impulsive green count. If you look at the 5-minute ES and SPX charts, you will see that this count had us completing wave iii of [3] of [iii] in the smaller degree structure off the early December low. And, my expectation for early in the coming week is for a test of the 4695SPX region in a wave iv pullback (the .382 retracement of wave iii). As long as the market pulls back correctively and holds support, I would then expect another rally to take us to the major resistance point which will decide if we continue on to the 4900+ region to complete all 5 waves in green, or if we have a new alternative that can take hold.
The next resistance region right now is the 4768-4778SPX region. While the 4768SPX region is the 1.00 extension of waves [i] and [ii], the 4778SPX region is the relative 1.00 extension represented by the futures action in the ES. The reason the 1.00 extension is higher when using the futures structure is because the futures struck a higher top in the middle of December than did the SPX. So, it’s 1.00 extension is slightly higher.
This now brings us to the meat of the analysis. As the 4677SPX region is the .618 extension of waves [i] and [ii], this is the main support upon which we are going to be focusing upon in the coming week or two. As long as all pullbacks hold that support, then we can continue on in the green count to attack the 4900SPX region in the wave [iii] off the early December low.
However, this is where the bears can provide the market with a surprise attack. While most people see a new all-time high as a bullish indication once we strike the 4768-4778SPX region, there is a new alternative count in yellow that I will be tracking, which would count that high as an expanded b-wave, now presented by a yellow count. Should the market top in that resistance, and then drop in impulsive fashion below 4677SPX, then I will be shifting into the alternative count. While the a=c target in that alternative count would be the in 4530SPX region, it is still entirely possible we could get a very extended 3rd wave down in that yellow c-wave, which can have that c-wave target the original target we had for the yellow [4] in the 4350SPX region. But, I will not be able to make that determination until we see how the market breaks down below 4677SPX, if it even does at all.
So, let me summarize this as simply as I can. Our support for early in the coming week is 4695SPX for a wave iv pullback. Our resistance is in the 4768-4778SPX region, which represents the various 1.00 extensions. Our lower support for the market is in the 4677SPX region. Therefore, the market will likely be testing both support and resistance in the coming week or so, and how it resolves at these levels will provide us with not only the expected action for the coming several weeks, but it will likely set our patterns for the rest of 2022.