Divergences Continue To Build
While I have pointed out divergences in the past, when a market does top, we may see the market continue to build divergences until it actually turns. That is why I continually stress a break of support to signal a top being in place rather than front-running divergences.
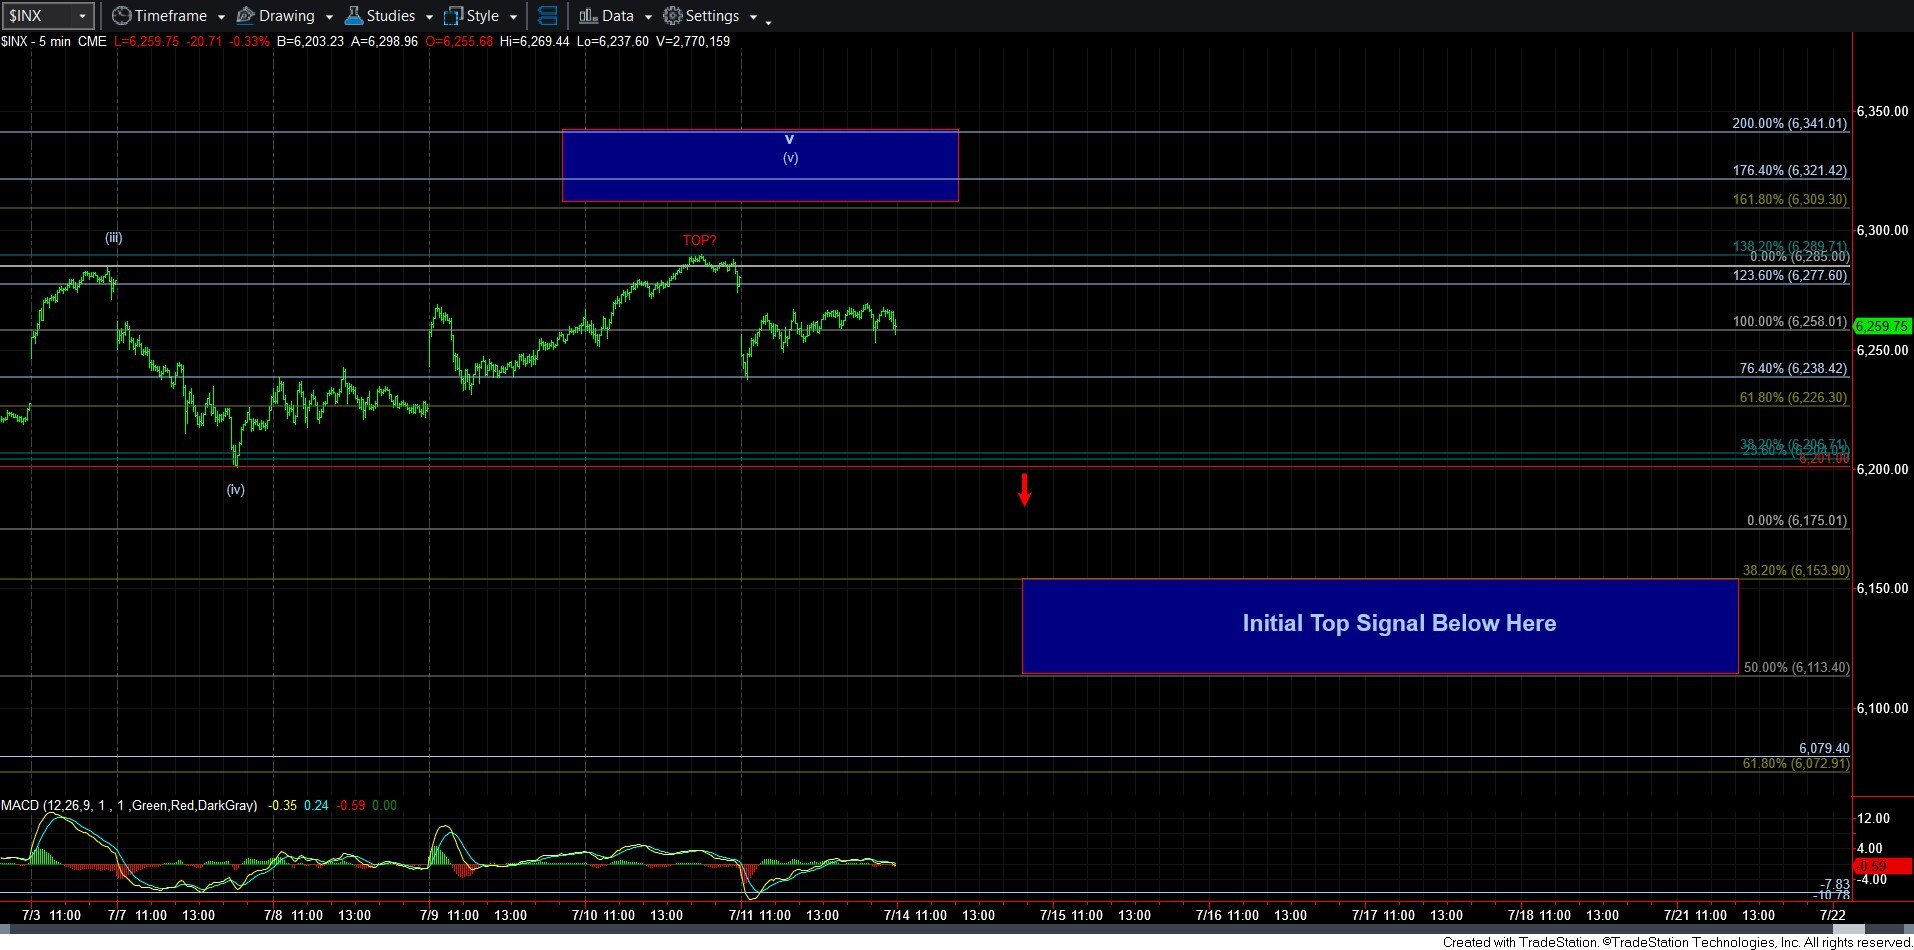
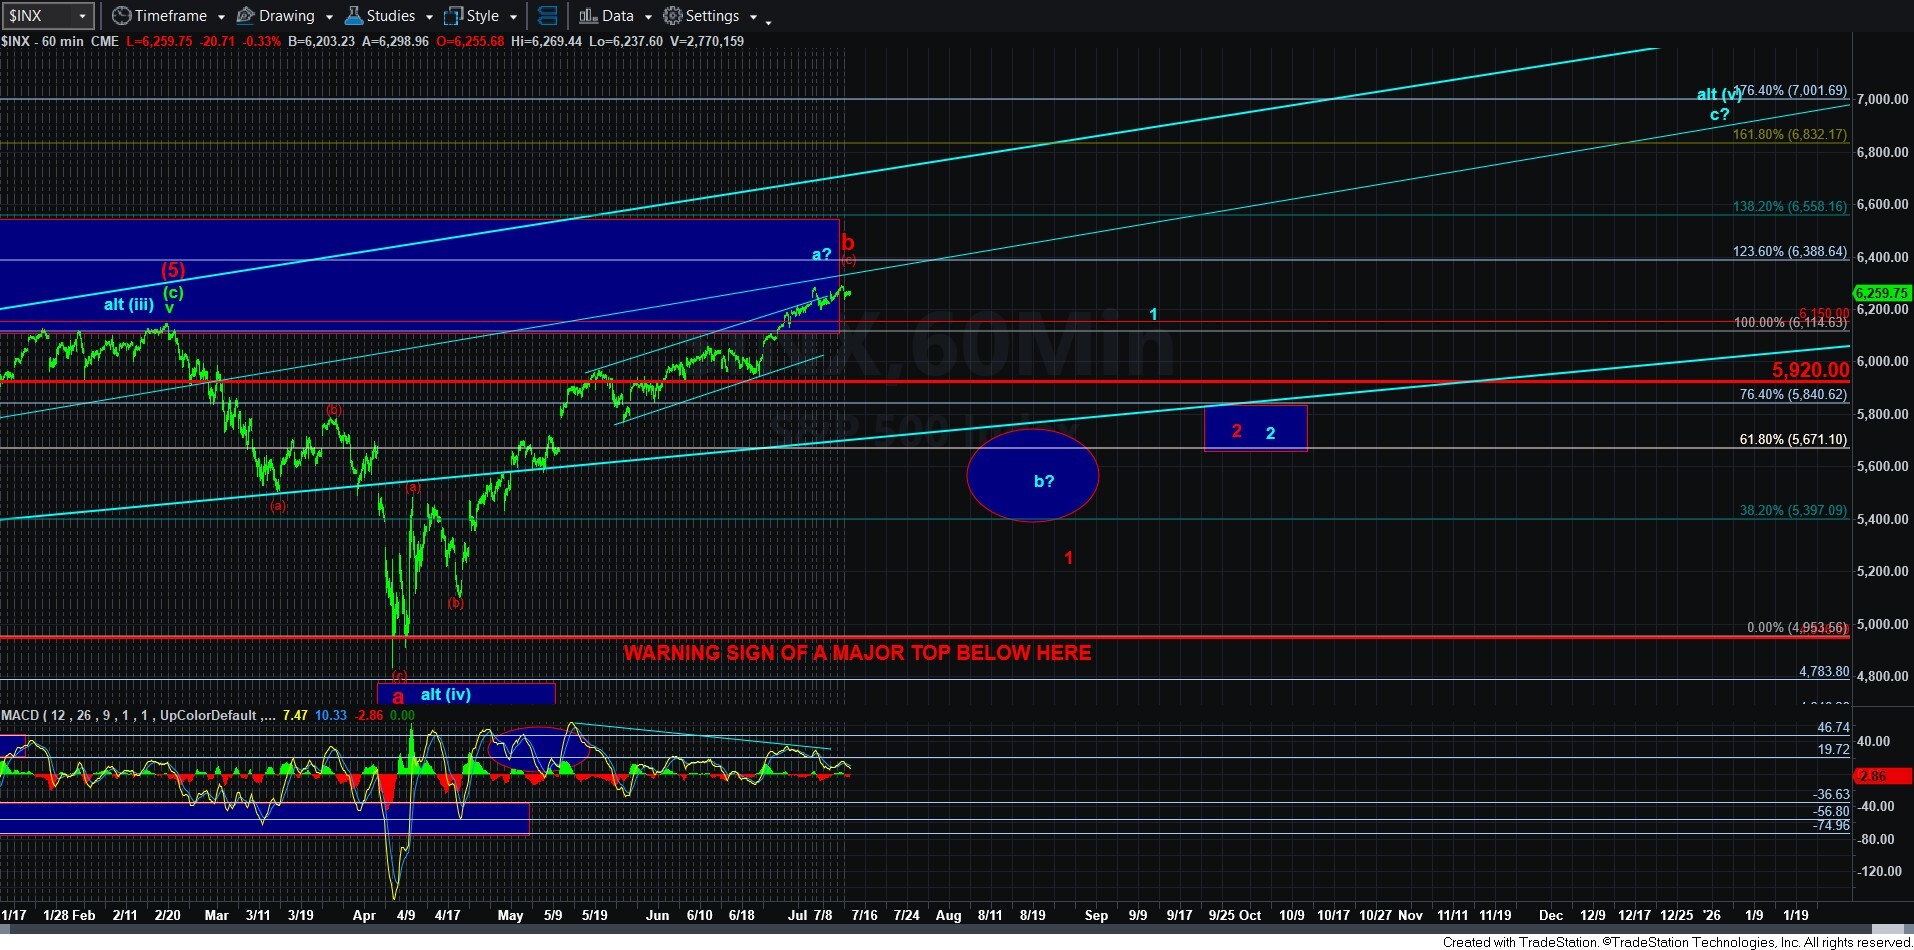
At this time, the 60-minute chart is displaying some serious negative divergences as the market has been trying to stretch even higher. In fact, the 5-minute SPX chart still shows an unfulfilled target box overhead. Yet, I also have noted that we have the minimum number of waves in place to consider wave [v] of v as complete, even though we have not struck the ideal target.
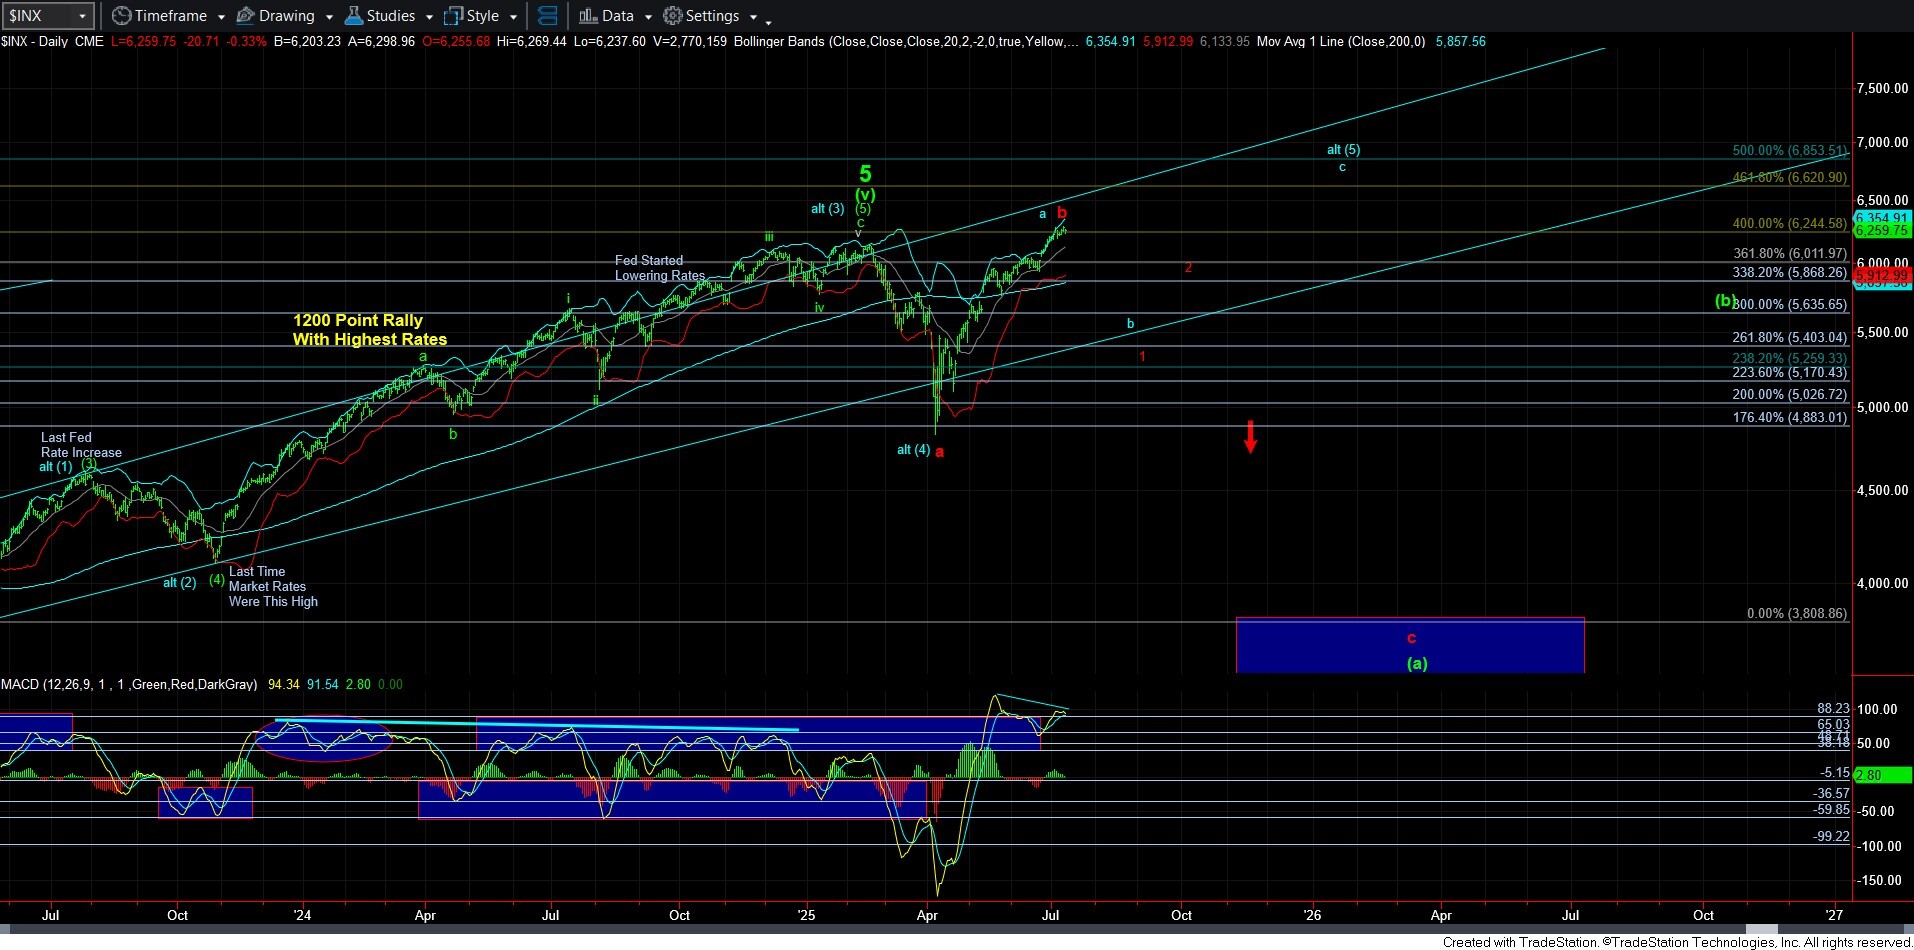
Now, since this last segment represented by waves [i]-[v] is an ending diagonal, it means that I would expect a strong reversal once it completes, with an initial target back down in the 6130-6175SPX region. The main reason is that when an ending diagonal completes, it often reverses strongly back to the point from which it began.
Getting back to support, our initial support is the 6201SPX level. A break of that support would be an preliminary sign that this ending diagonal has completed for wave v, with a follow through below 6113SPX suggesting that a top to this rally off the April low is likely in place. Of course, I still would need to see a break down below 5920SPX to confirm that top. At that time, we can assess the nature of this decline to know if the blue or red count is going to be applicable into the end of the year.
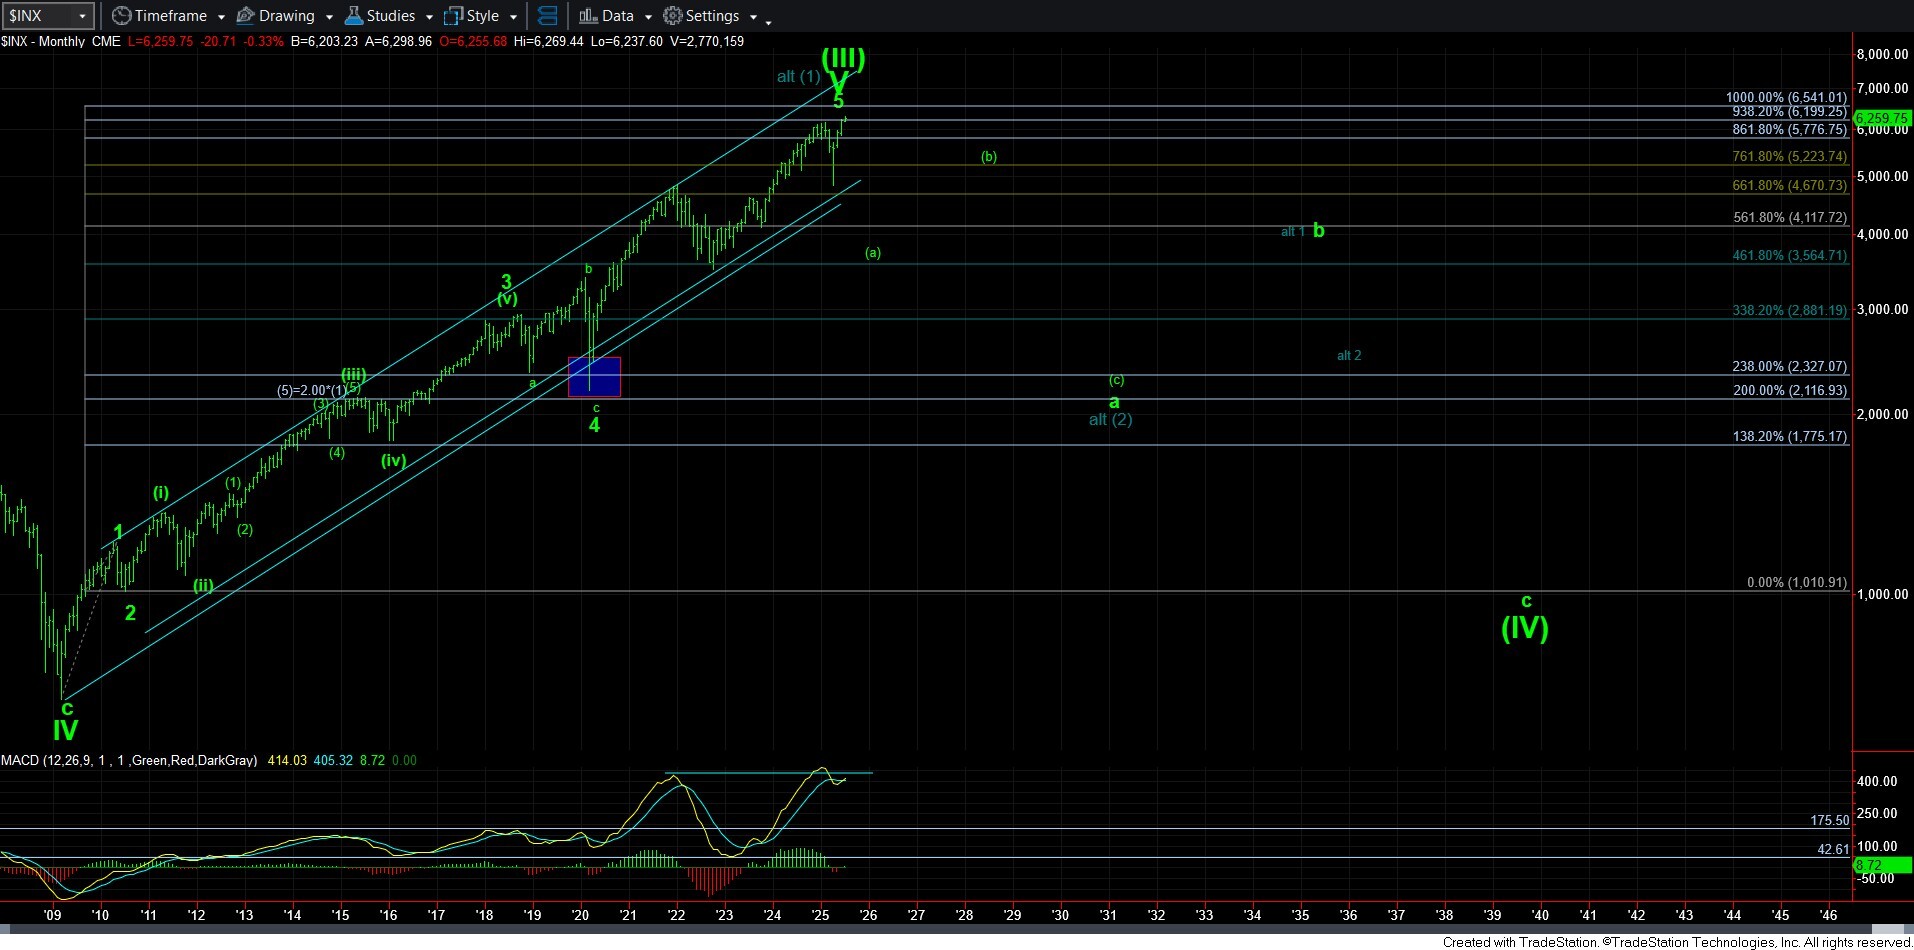
So, while a number of you are so sure as to how this larger degree structure is going to resolve, I maintain no such bias, and will simply approach the market based upon how the next decline takes shape.