Digestion vs. FOMC + Quadruple Witching
 By
Ricky Wen
By
Ricky Wen
The second week of September was the third week of the upside bullish continuation pattern since the August 26 sticksave bottom at 2810.25 on the Emini S&P 500 (ES). Basically, the market completed our expectations of the week by fulfilling our immediate targets at 3000 and 3014 alongside with battling against July’s all time highs. The week gained 0.87% or 26 points and was able to decisively close above 3000 pivot.
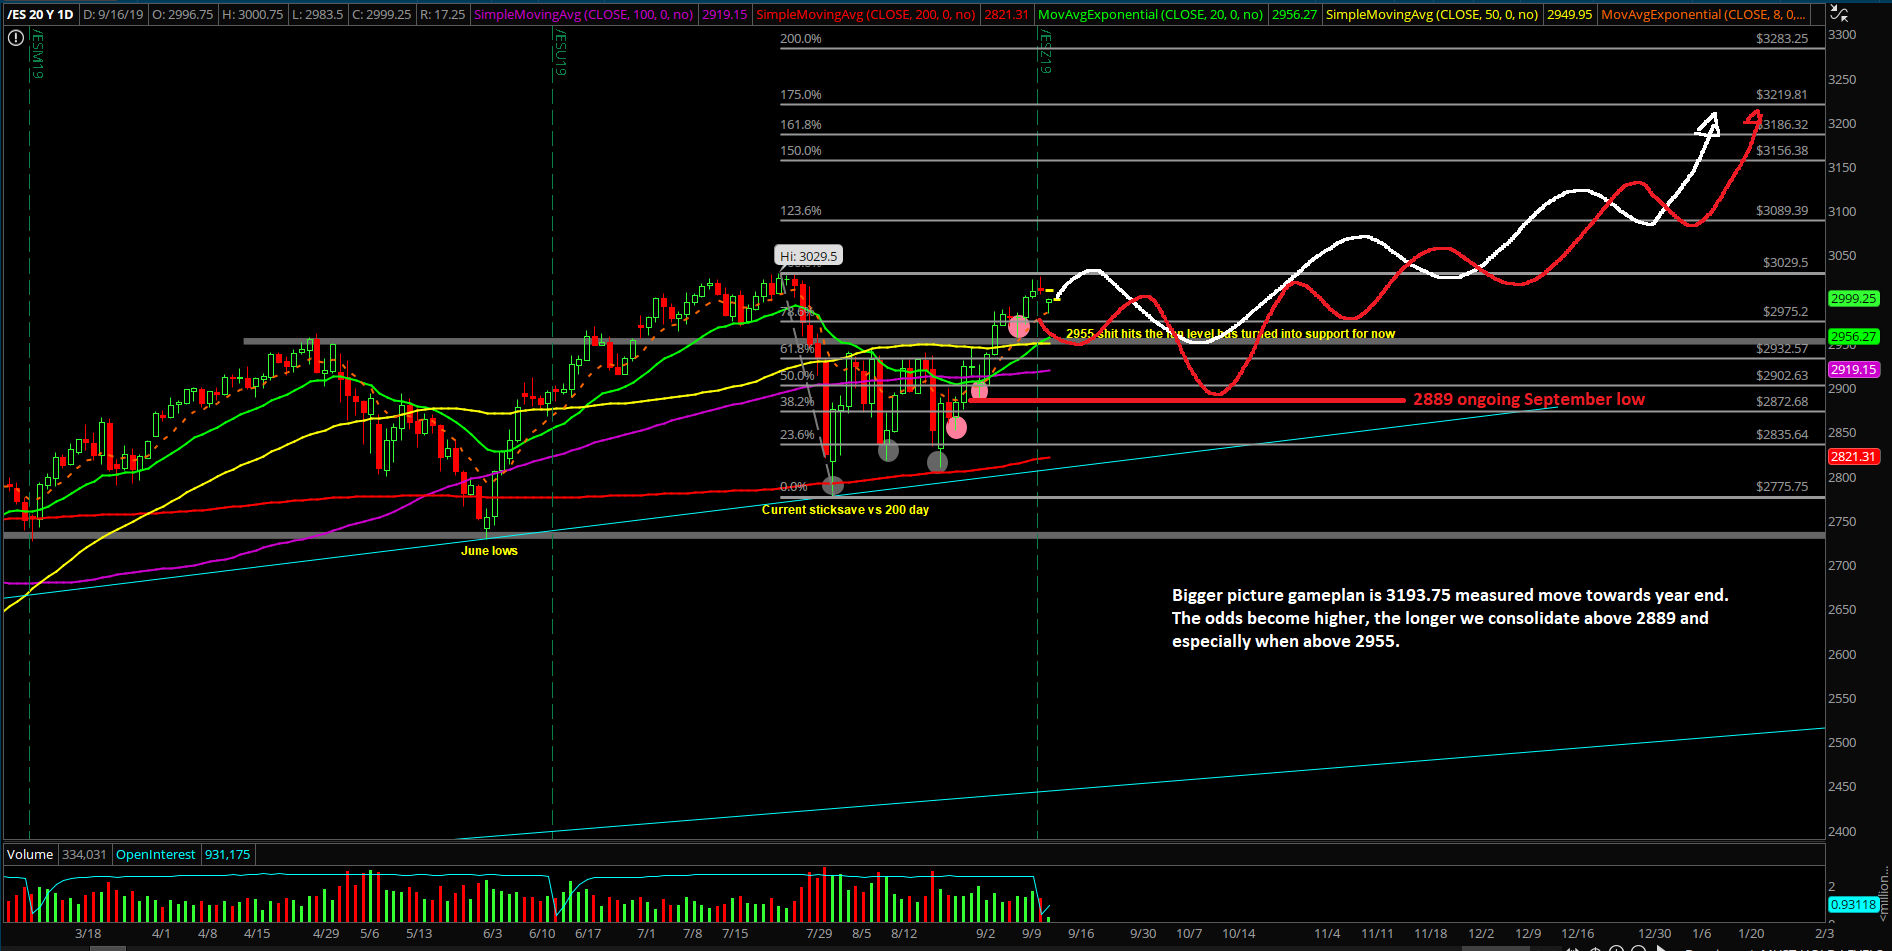
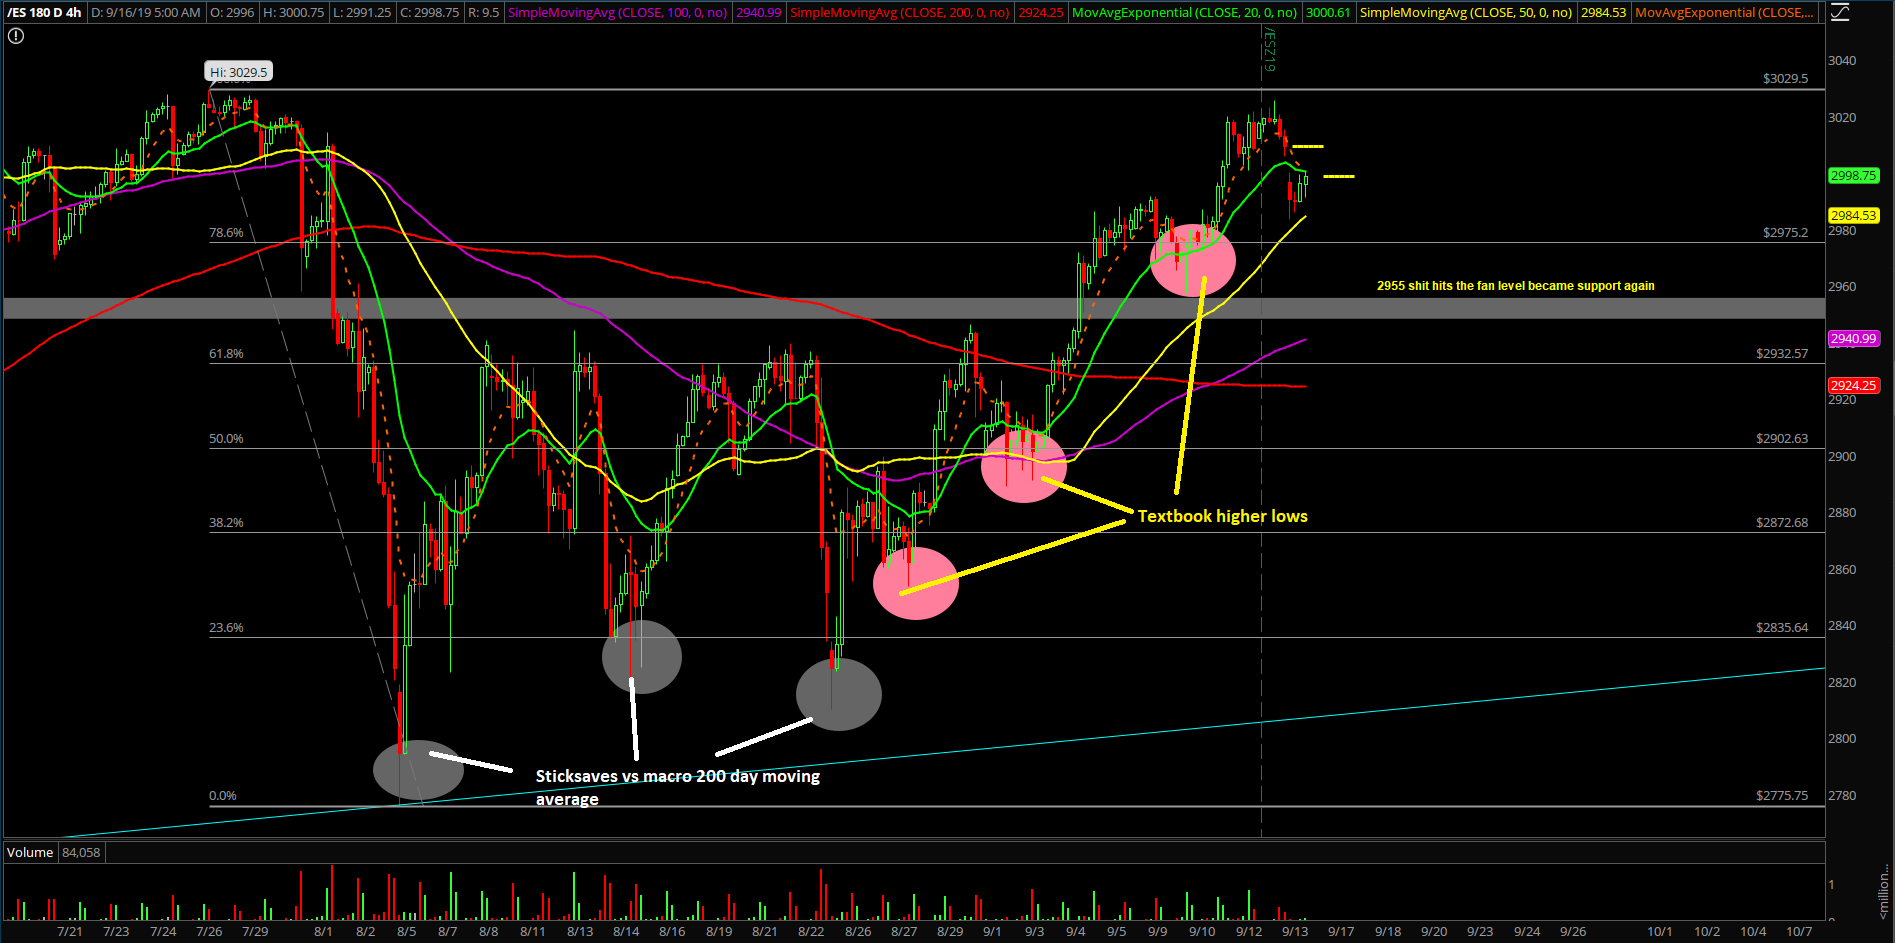
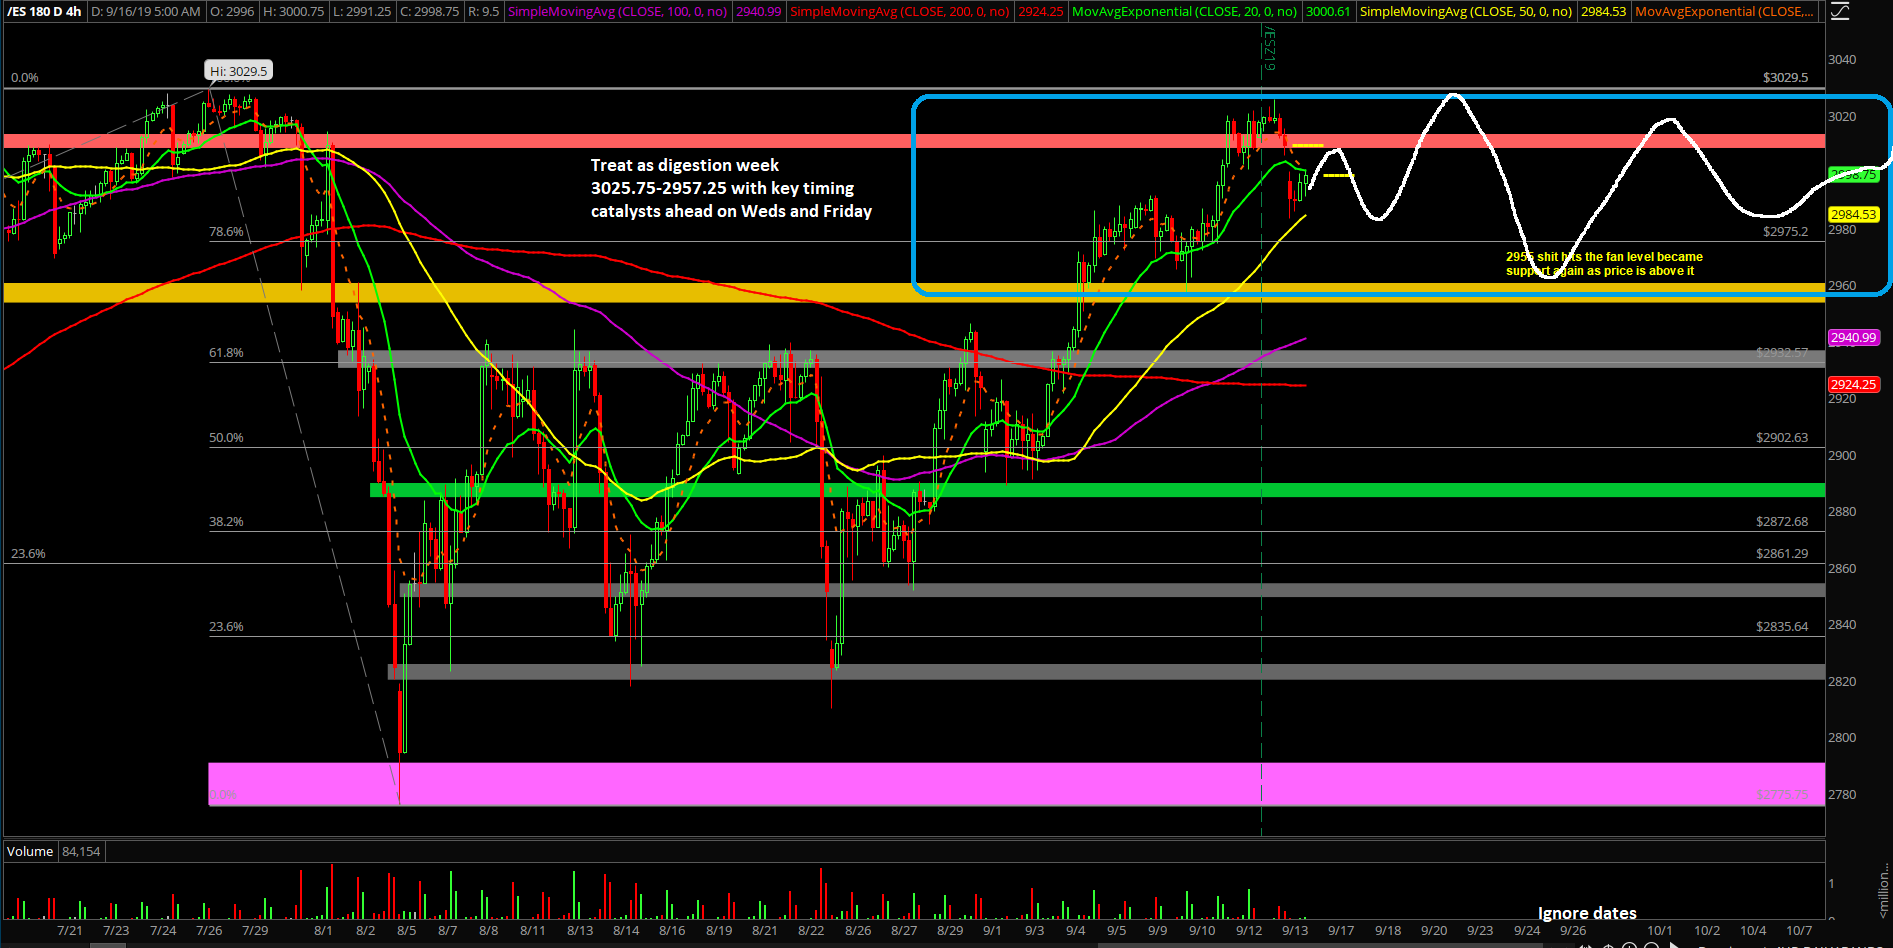
The main takeaway is that the bulls still remain in full control in terms of immediate momentum especially when trending above the 2955 "sh*t hits the fan" level from July. If you recall, the market bottomed at 2957.25 last week and made a textbook higher lows pattern. Heading into this week with a few timing catalysts, it’s fairly obvious on what the goals are for each side after the consolidation pattern takes place. Bulls are trying to immediately make new all-time highs and be on the way towards the 3193.75 measured move year-end target from months ago. Vice versa, bears are trying to break 2955 and open back up the threat that they resurrect themselves from extinction and maybe go for the September monthly low of 2889 backtest to see if it holds or breaks.
What’s next?
Friday closed at 3009 and the bulls managed to close at the highs of the week within the 1% metric of the highs so they are rocking a 72.9% winrate YTD (27/37 weeks). Quite unbelievable when you look at raw data and statistics and filter out all the noise.
Some key points may be repeated from ES trading room’s premarket gameplan report:
- Main focus is on value buys when bottoming setups appear and see if can grind into Wednesday highs
- Wait patiently for the higher lows or lower high setup this morning to form, it’s Monday morning as everyone is back with a little gap down and the news cycle from weekend
- Absolutely no shorting allowed for novices when above 2957.25-2955, traders shorting must take profits every 5-15 points and can be 1.5:1 or 1:1 ratio depending on entry spot
- Bigger picture 3193.75 is the measured move target going into year end, this is valid when above 2889 and especially when above 2955
- We will be utilizing more buystops/sellstops bracket orders vs. key contention levels moving forward as long as we see proper train/trend setups that offer 1:2 or 1:3 risk to reward ratios
- This way, we could avoid getting chopped up like August even though when we were correct about direction, but no direct follow through
Extra context:
Daily chart – Decisively above 2955 shit hits the fan level of July and rocking daily 8/20EMA uptrend. Also, it rode at the daily bollinger band highs last week and doing a little mean reversion since the Sunday night gap down.
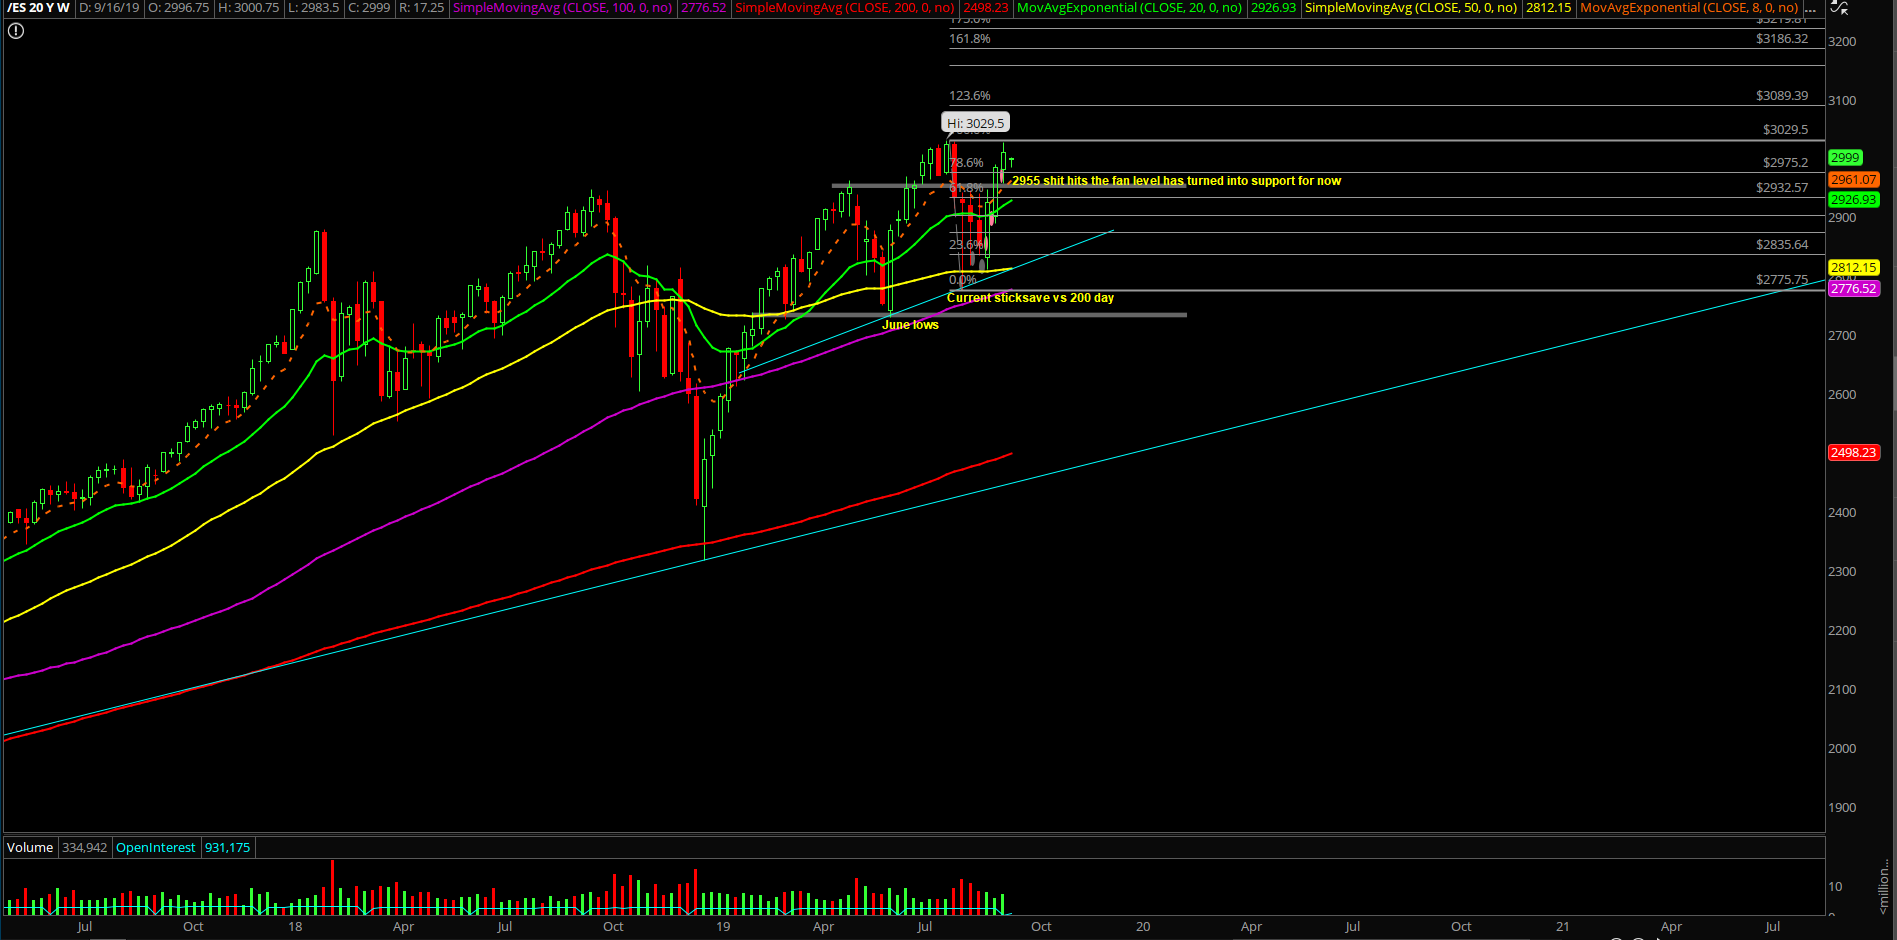
Weekly chart – Picture perfect ‘hold half and go’ continuation pattern playing out since August 26th week. Bulls completed week 3 of the continuation pattern so it’s normal to expect some sort of consolidation/digestion for this week given the overall range 3025.75-2957.25 and the timing catalysts on Wednesday and Friday. As you could see, it is technically no longer an inside month anymore within August range 3014.25-2775.75 as price broke above it for a few hours last week. Let’s see if price sustains above it in the coming weeks to enhance odds further for the bull train.
Overall September Bias
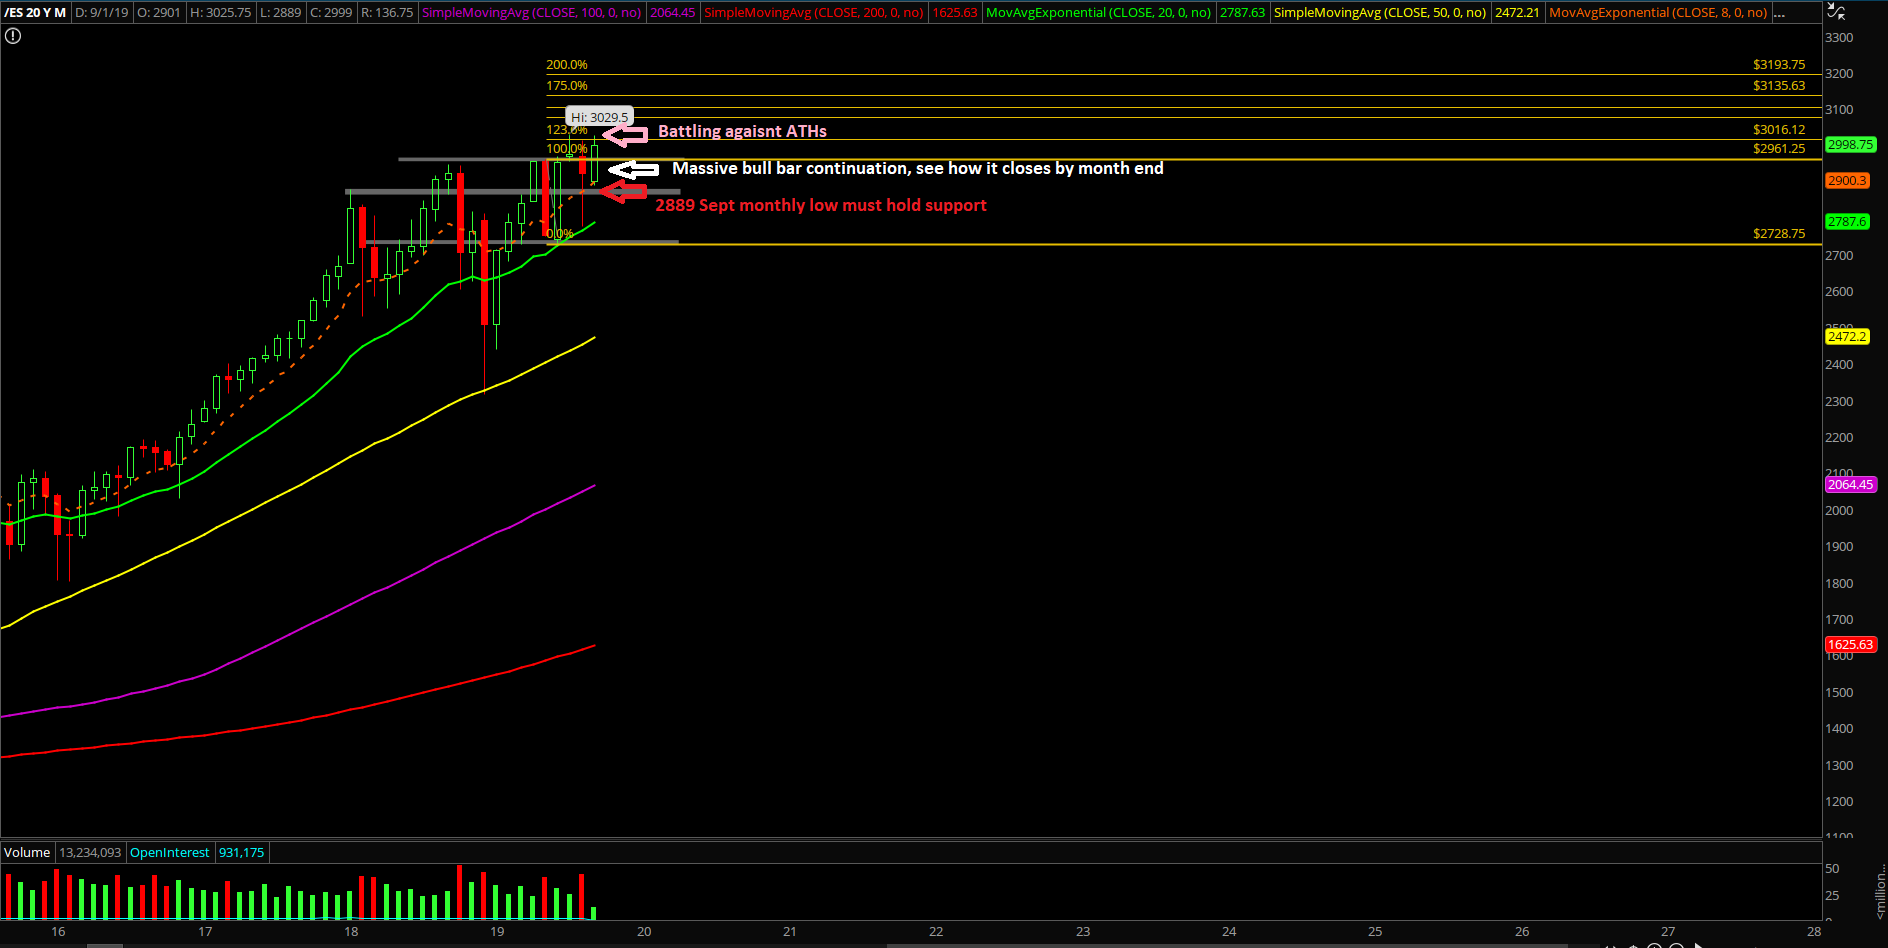
- Monthly chart – the bulls sticksaved 2775.75 vs. the monthly 20EMA which also aligned with the macro 200 daily moving average area so bulls did a fantastic job stopped the crash setup from the opposing side.
- As discussed, our September thesis is the likely inside month range of 3014.25-2775.75 overall and technically this is not the case anymore based on the bulls’ complete control on momentum.
- The market is just trying to grind in a textbook manner so that in 2 weeks the September monthly closing will be at dead highs or near the highs to signify a win for the bull train. Vice versa, if bears resurrect themselves and defend against this goal.
- We are also treating the March, June and August 2019 lows as a standard higher lows structure so that means the August lows is obviously the must hold on any pullback if going for the macro timeframe into year end and year 2020.
- Plan accordingly if the overall pattern/structure plays out, see daily white line projection as a potential roadmap
- We are treating 3193.75 measured move target for year-end magnet as valid when above 2889 and especially when price consolidates above 2955
- The longer price sits above ongoing September low 2889, the higher probability that 3193.75 magnet will be hit going into year-end or next year 2020. We derived the 3193.75 target level from many months ago from the C&H or the bullish continuation pattern. Search it up if want more context.
- For reference, as of writing, price is located at 3000 so 3193.75 would represent a 6.5% rise.