Did GDX Top?
I think today’s action evidences the power of Elliott Wave analysis coupled with Fibonacci Pinball. Whereas many came into the open today assuming that the metals were finally breaking out, we were looking for a topping in at least the wave 3 of the c-wave. In fact, as some people were posting about how strong the metals seemed this morning, I posted that you need to be aware that 5th waves are the strongest in the metals, whereas 3rd waves are strongest in equities. This was the reminder that we are expecting the top to a 5th wave, but the primary expectation was that it would be a 5th wave in the 3rd wave of the c-wave rally.
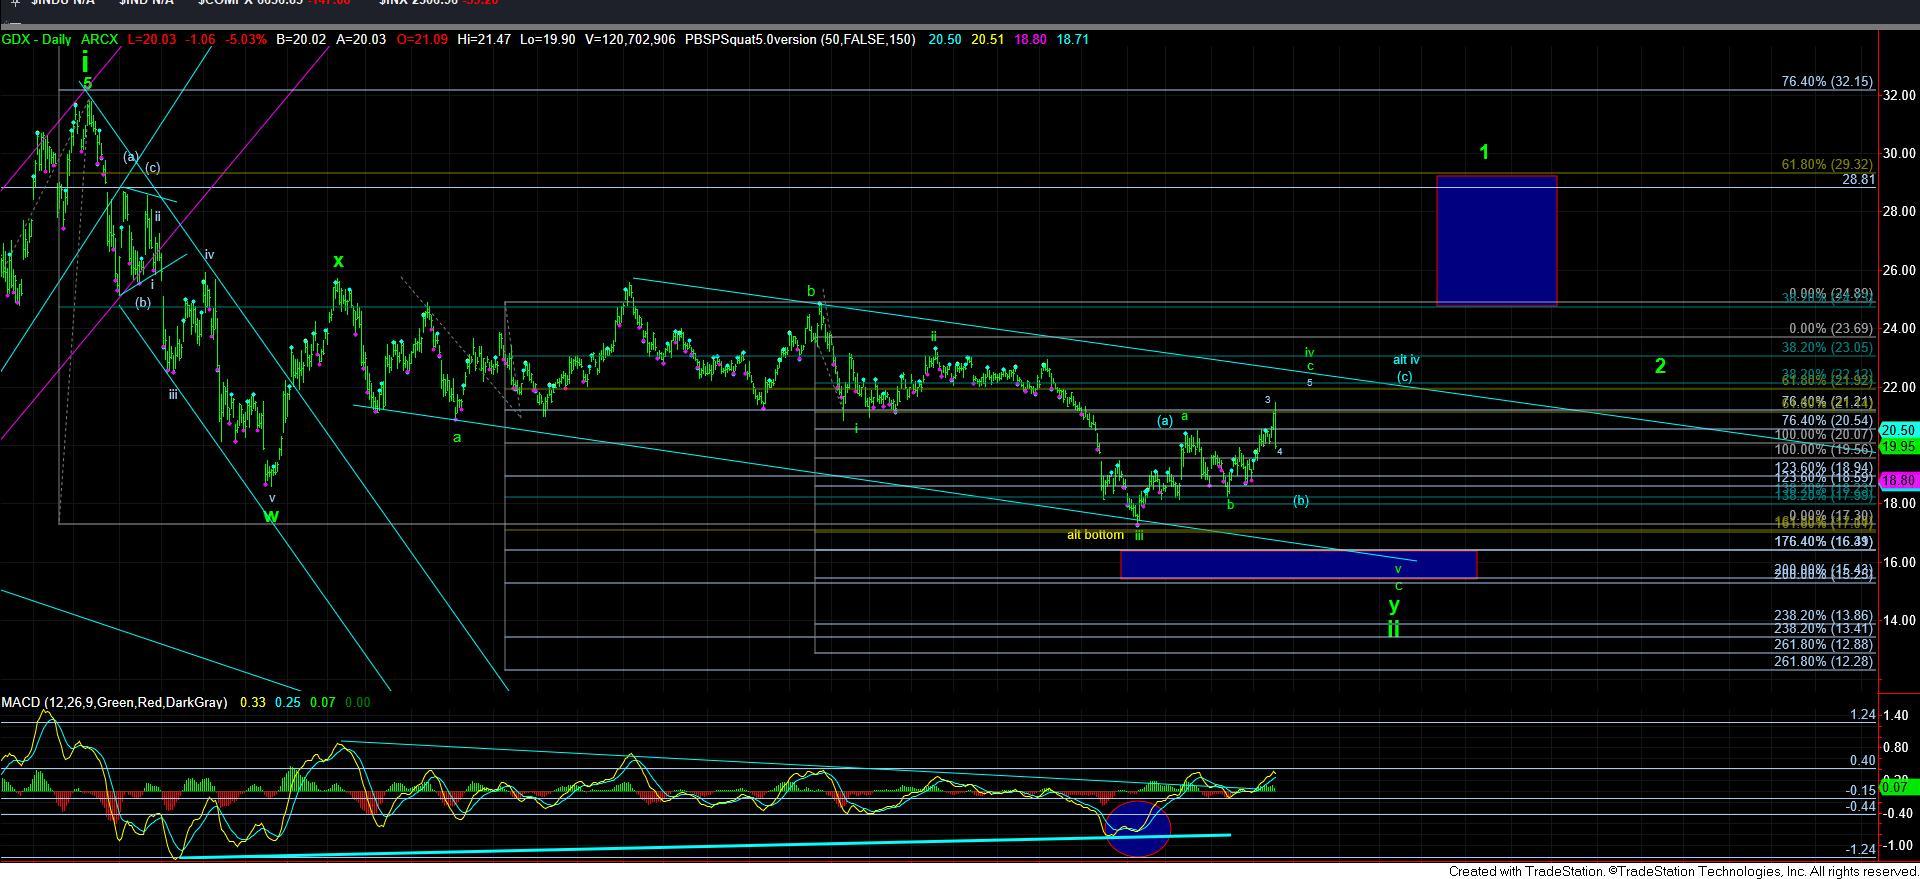
As I have been noting of late, my bigger expectation was that we can rally to a minimum target of the 21.50 region for this c-wave of iv, but, more likely this would only be the top of wave 3 in that c-wave. Today, the market struck a high of 21.47, so we were off by 3 cents for this current top. And, to be honest, the bigger picture would still count best with another rally back up over the 21.50 region, closer to that 22-22.25 region to complete this c-wave closer to the downtrend line overhead.
Should the GDX be unable to hold the 19.90 support level, it would certainly complicate matters. Of course, it is possible that this was the top of all of the c-wave, but that really leaves too many questions for me. A break of 19.90 would make me go back to the alternative we were considering last week, where this top was a b-wave within a bigger (b) wave within wave iv. So, I put it back on the chart, just in case.
Also, it is entirely possible that this 21.50 is all we will get on the upside, and begin the drop to the 16-17 target region. Unfortunately, I would not be able to tell the difference between the two potentials until we dropped down to the 18.20 region, which clearly makes trading this region much more complex.
So, clearly, my preference would be for the market to hold the low we struck today, and begin a 5th wave rally to complete the wave iv sooner rather than later. Otherwise, this can delay the bottoming in the market by an additional several months.
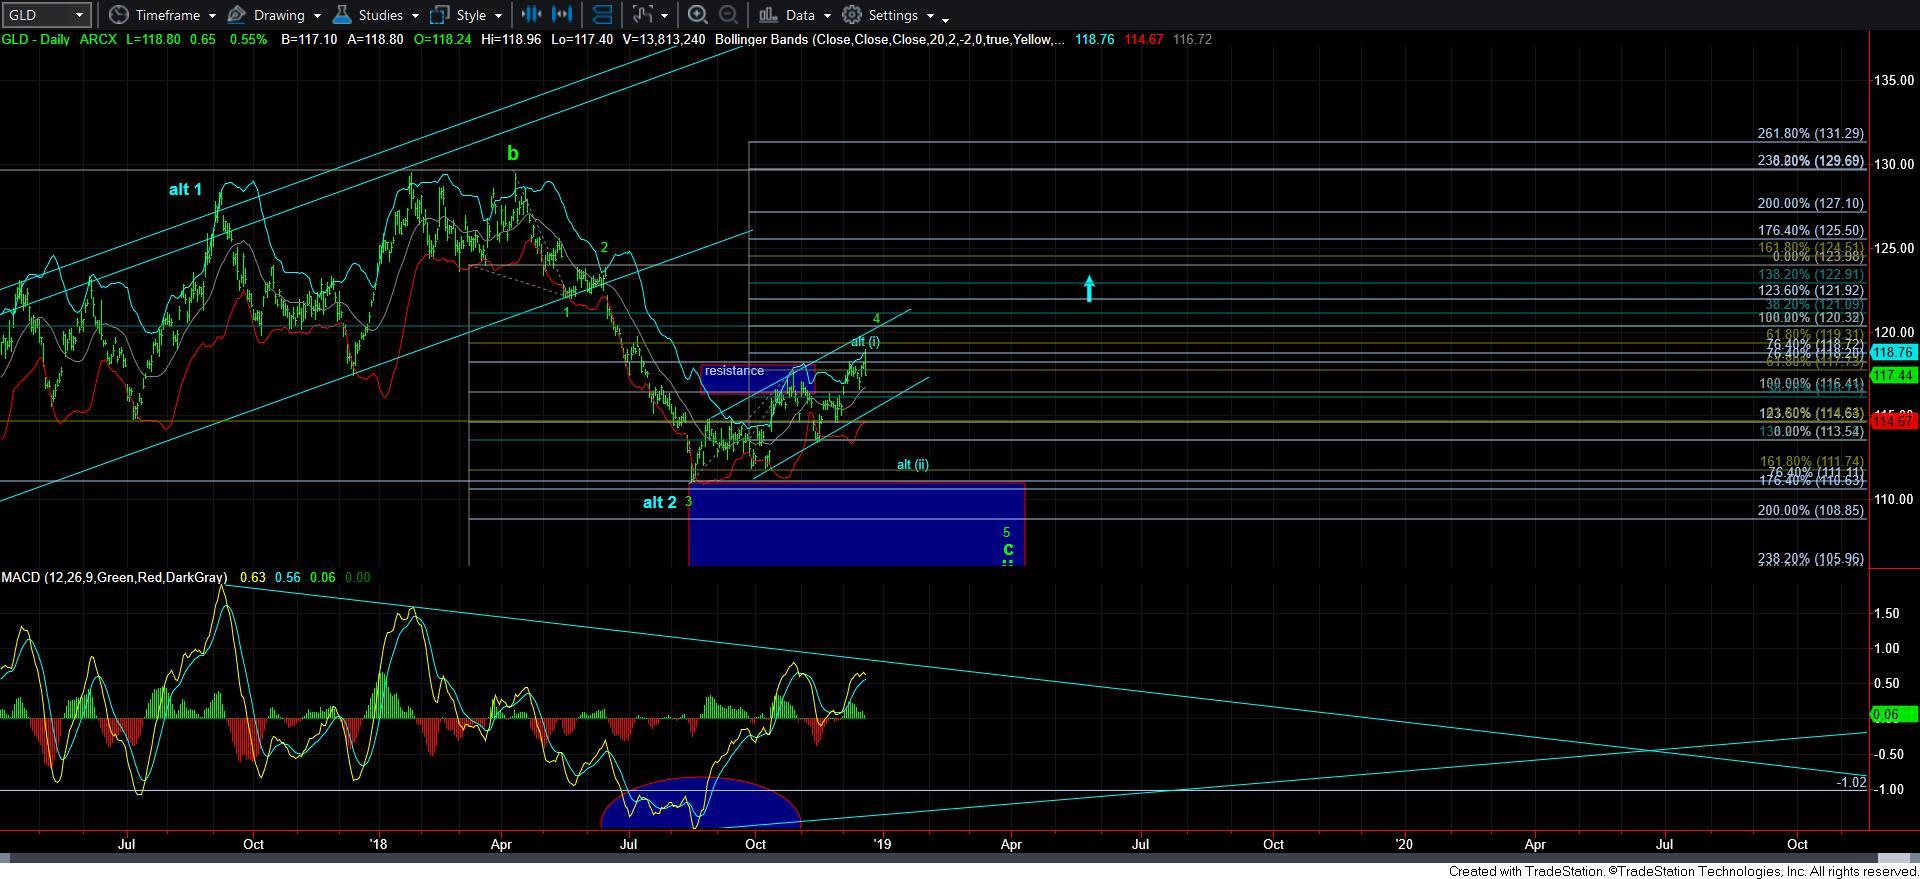
Now, to be honest, the GLD has now topped out at a point where we can view it as completing a leading diagonal off the recent lows. If it should continue higher towards the 120 region, it would be more suggestive of it being a 4th wave, with an a=c off the bottom. But, as I highlighted in the past, I am still questioning whether GLD has truly bottomed or not. And, as I have also noted, the same goes for silver. Despite it having a very full downside structure, we still do not have the impulsive structure off the lows to solidify that a bottom has been struck.
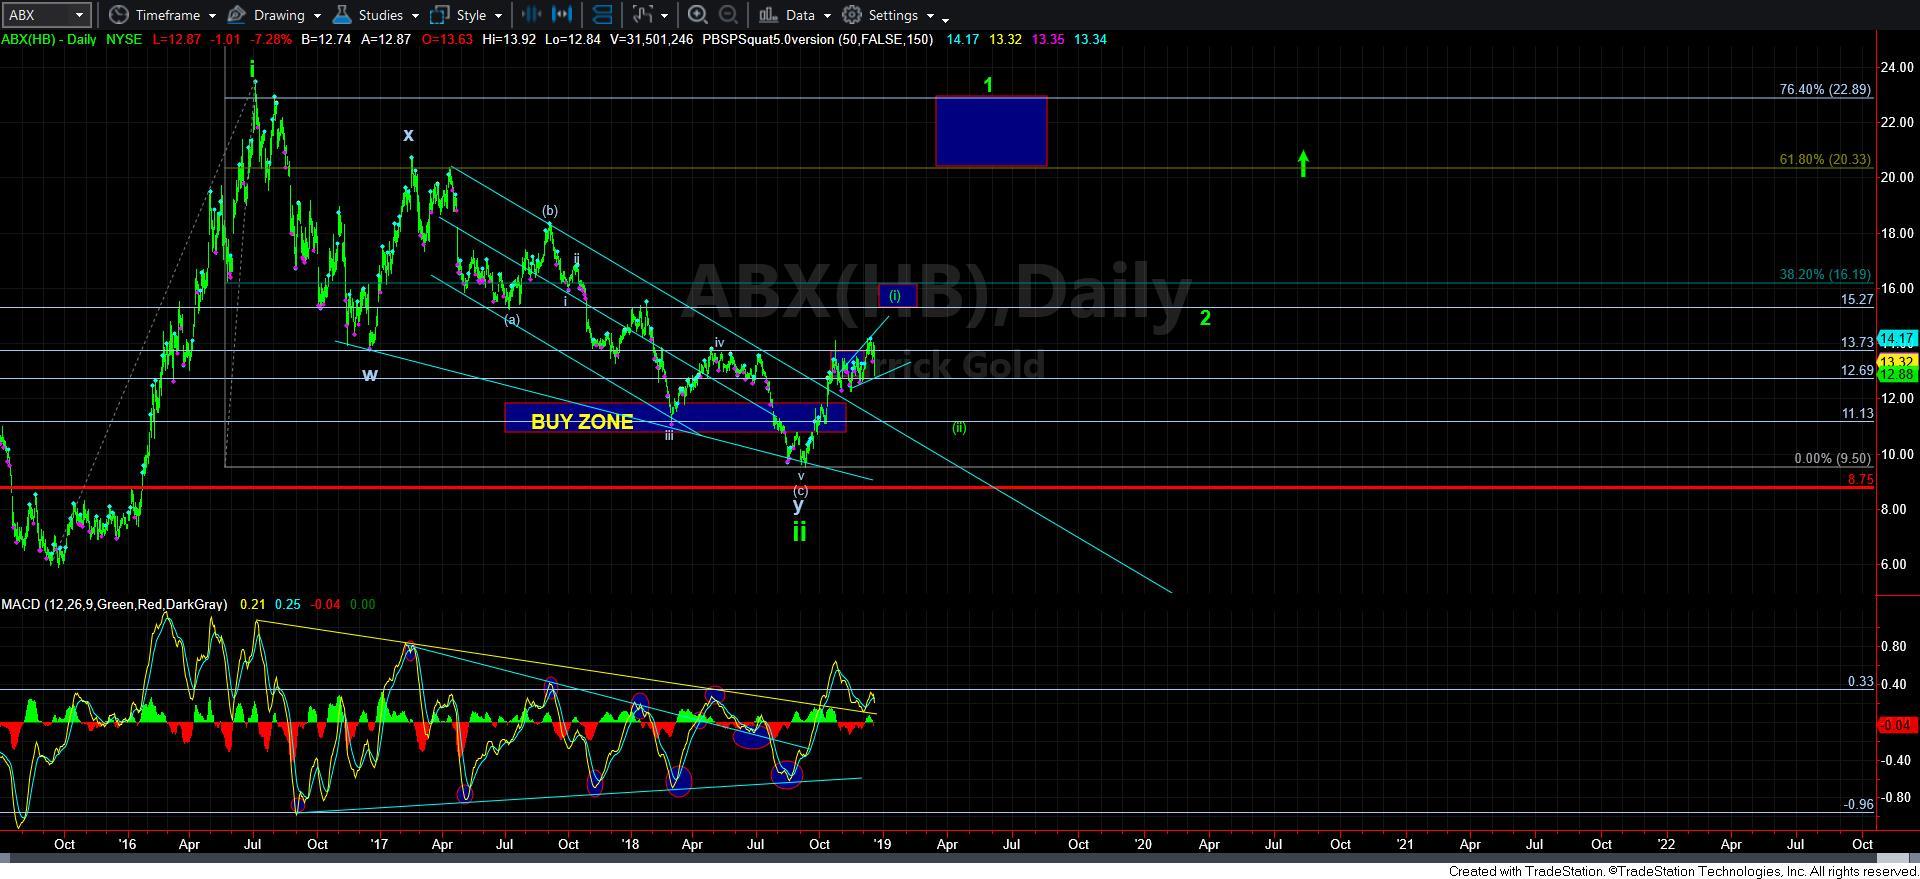
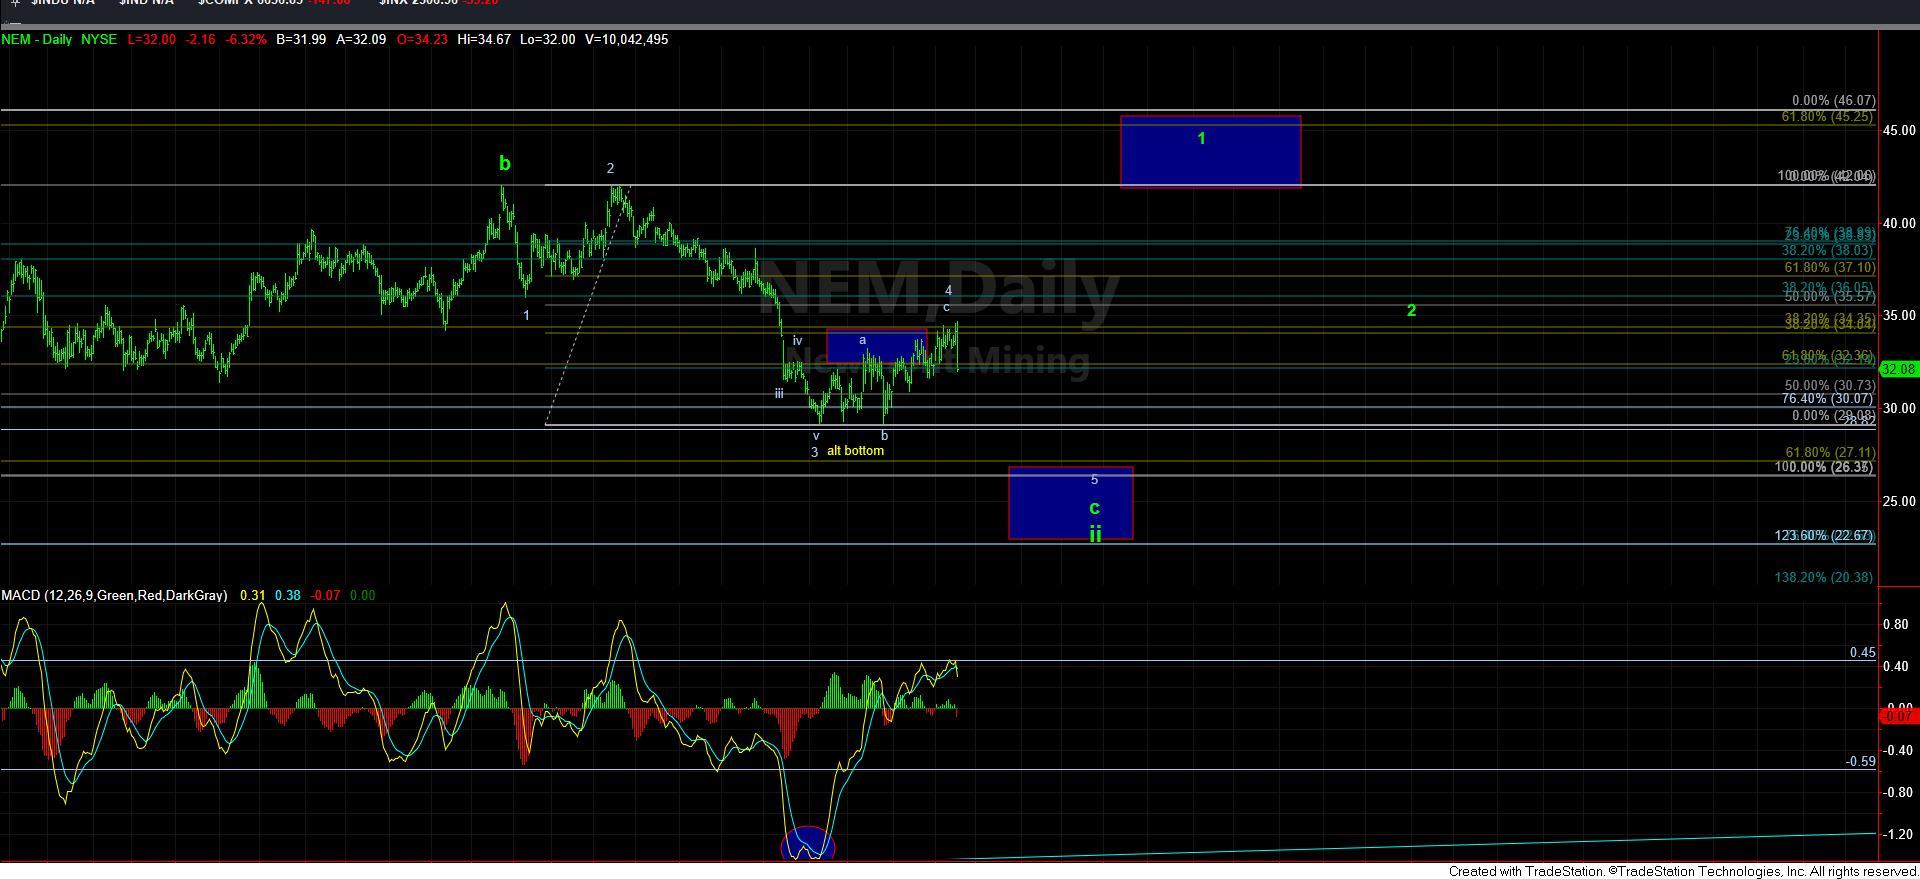
As far as the individual miners, NEM to me still strongly argues for the lower lows I want to see. However, ABX can still push higher if this is an ending diagonal for its 5th wave of wave (i), as the break down of 13.40 has certainly made it clear it will not be a standard impulsive 5th wave. The other potential is that this is still part of the 4th wave of wave (i), which would follow in the same manner as the alternative blue count on the GDX. That would mean it can still drop down to the 12-12.25 region to complete a broader 4th wave, and still rally in a 5th wave to complete wave (i).
So, as you can see, there is still some amount of complication being presented by the complex in the coming weeks. However, there is nothing that is strongly suggestive that the broader complex has truly bottomed yet. I still think there are many charts that have lower lows sitting out there before we can see a sustained rally in 2019. So, when NEM finally bottoms, I will be much more confident of the resumption of a bullish trend.