Defining Moment For Evil
The evil purple count is now at support in gold, and this is the last opportunity I am giving the market to either prove that evil count, or to let us know that we are going to be heading to the lower targets in a more direct fashion.
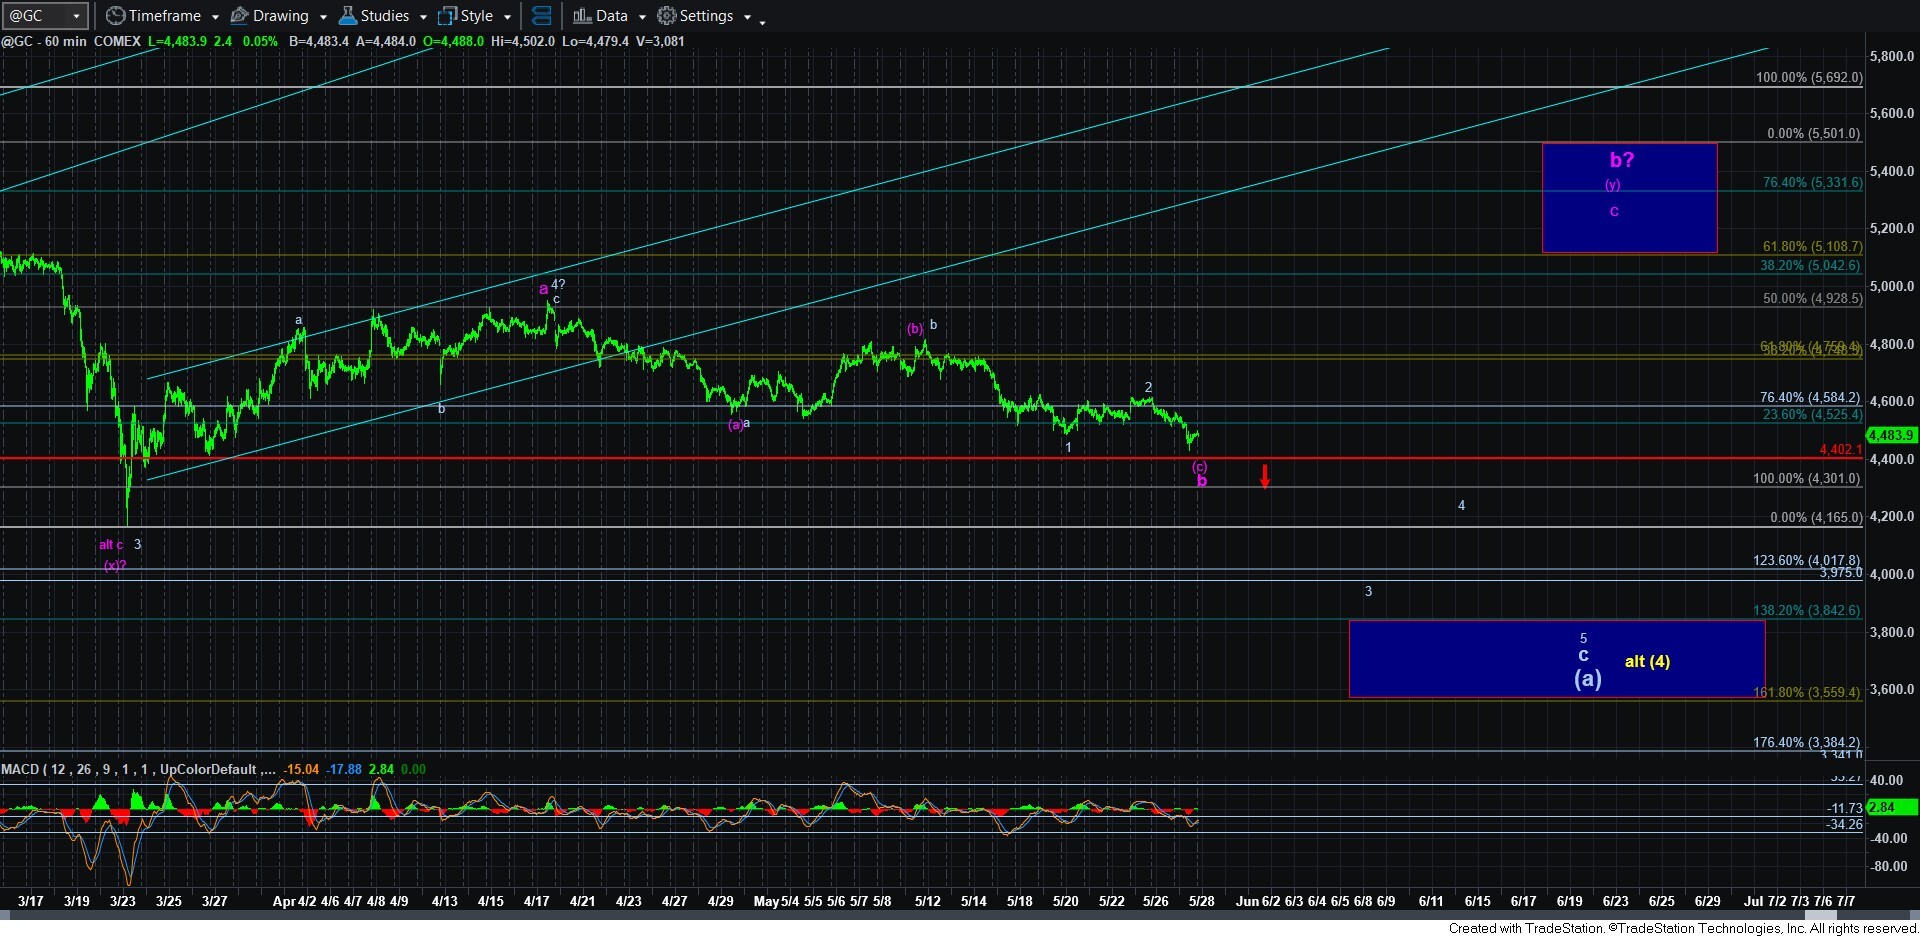
IF you look at the 60-minute gold chart, you will see the 4400 region as the support I have outlined by the red support line. Should the market see a sustained break of that support, then it becomes likely that we are heading down in wave 3 of the c-wave, pointing us down to the 3550-3850 region. Take note that I have had to lower the target due to where this 1-2 would be projecting since wave 2 in this scenario was much more shallow than initially expected.
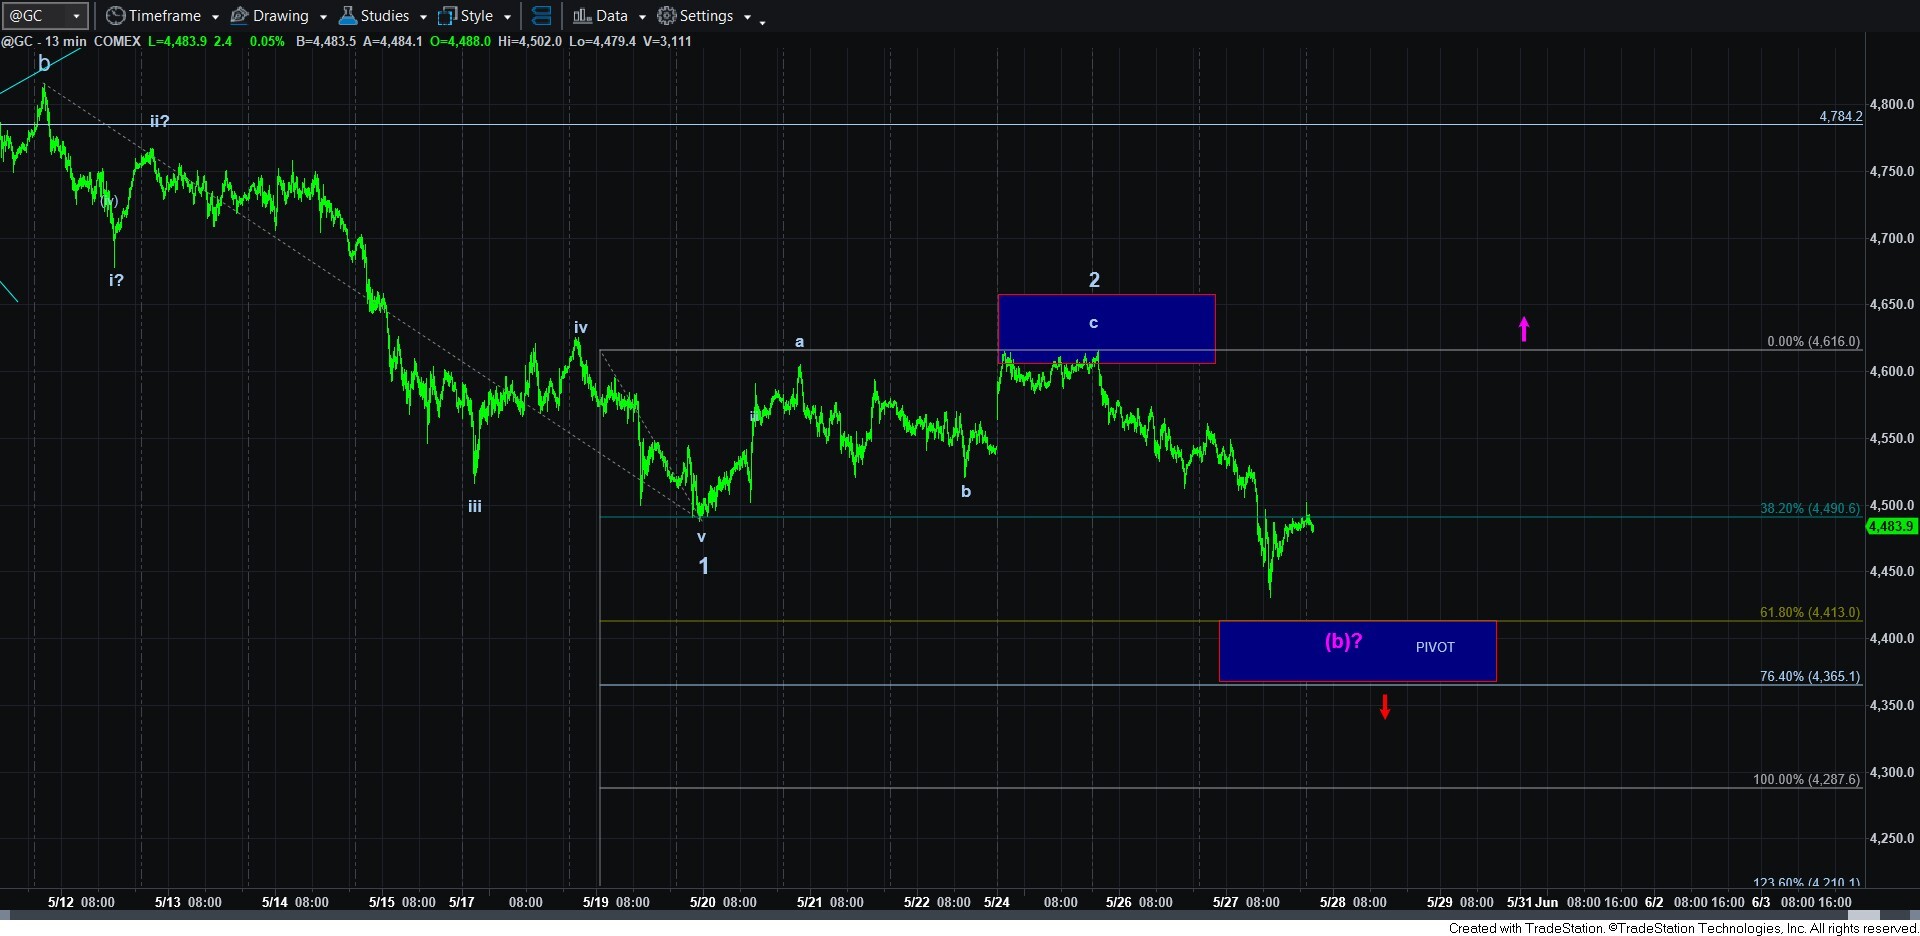
If you look at the 13-minute gold chart, you will see the same region represented by the pivot box. To remind you again, should the market exceed the .764 extension, then it is no longer the 5th wave in the purple (c) wave of the b-wave, and makes it much more likely that we are already dropping in the 3rd wave taking us directly to the target below to complete this VERY complex correction which began in January.
Of course, if the market is able to hold this support, and then provides us with a 5-wave rally back over the wave 2 region (4616), then that will make it much more likely that the purple count is pointing us to the upper target box outlined on the 60-minute chart to complete this evil b-wave.
So, I think the gold chart is giving us the nicest parameters to follow in the coming days.
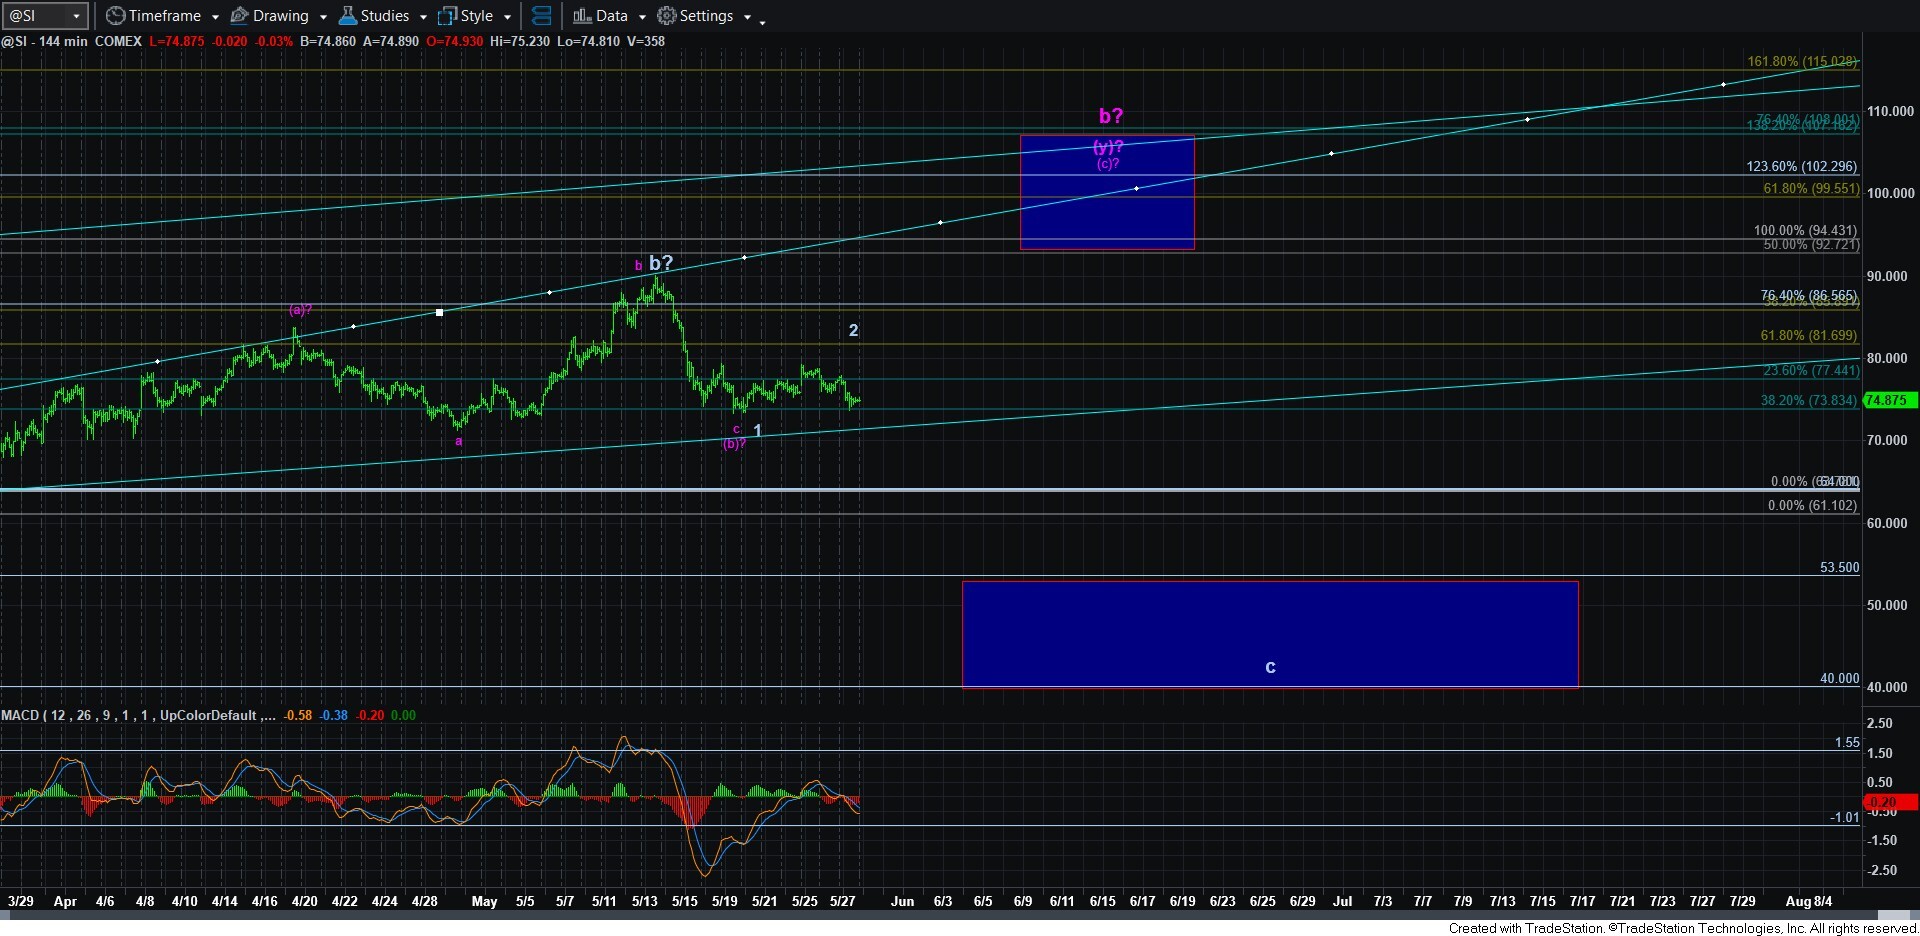
I wish I had similar clues in silver, but it is really such a mess that I cannot confidently provide strong cues for that structure at this time. So, I am going to have to reserve my smaller degree analysis in silver until it becomes a bit more clear.
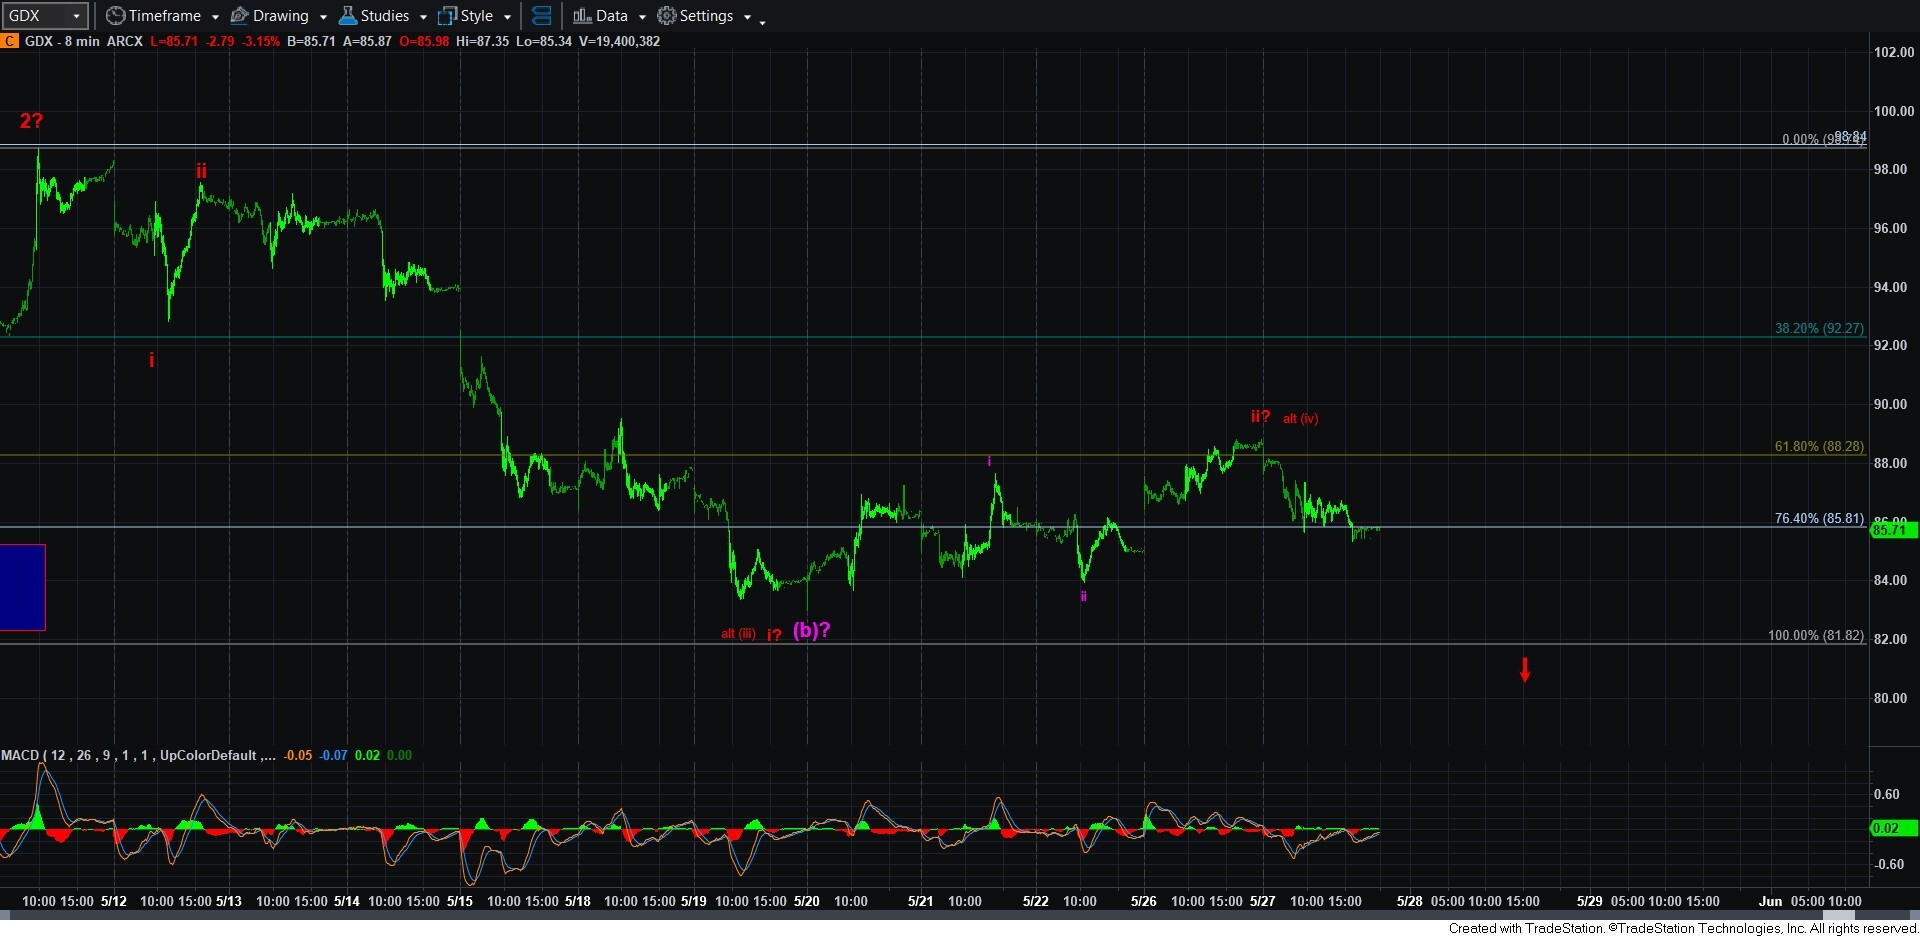
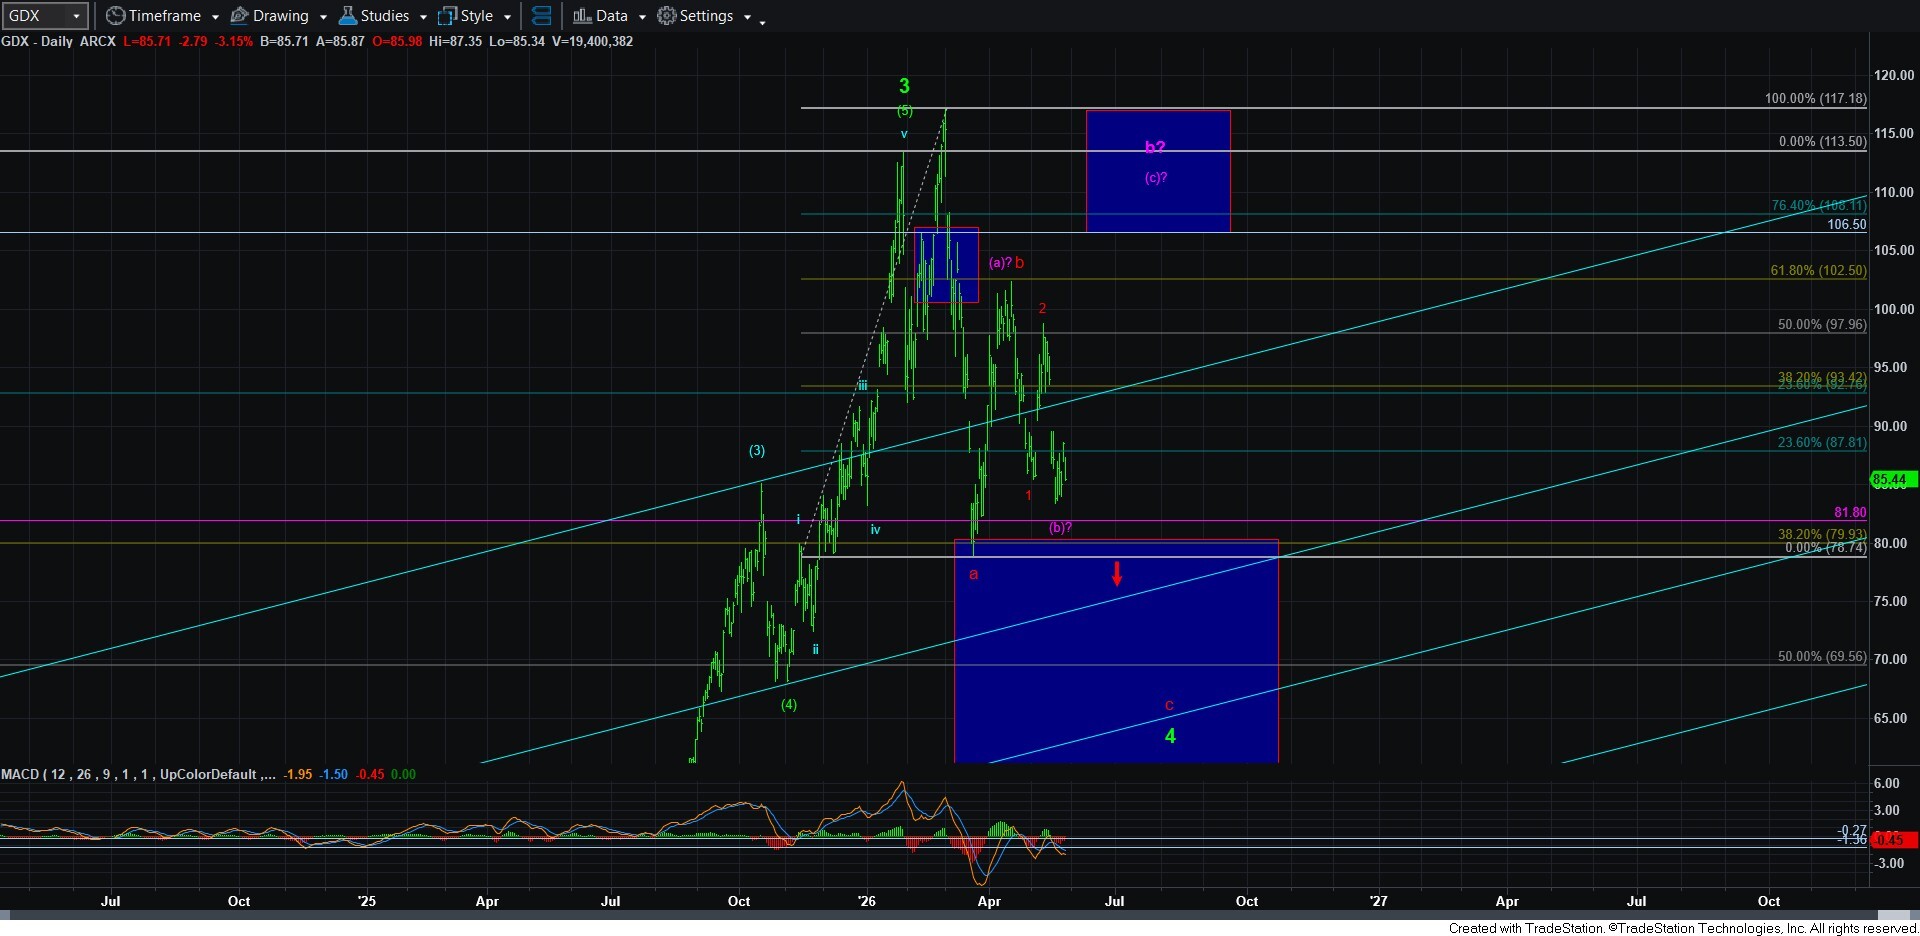
GDX still provides us with a support at the 1.00 region we have been highlighting in the 81.80 region. And, as long as we remain over that support, we are going to be seeking a more complete 5-wave rally to signal that the purple count in GDX is taking hold. But, if we see a more immediate break down of that support, then that makes is likely that we are heading down to the 60-70 region in a more direct fashion to complete this corrective structure which began in January.
But, the one complexity that I am unable to nail down is whether this decline is taking shape as a 1-2 i-ii with wave iii down to yet begin, or if this bounce is actually the wave (iv) in wave iii due to how shallow this bounce has been. So, if we begin to break down in the coming days, that is an issue we will have to resolve in the coming weeks.
Overall, I am still going to use the gold chart for our clues in the coming days, as it still provides us with the clearest parameters of the three charts.