Crisis Mode Continues Into Weekend
 By
By
Yesterday and today the mood pattern reflects crisis or disaster mode on a daily scale and it's not uncommon to see market pullbacks along with this pattern as well as mini crises along the way. In the chart below, the orange and gray lines in parallel (Manic and Controlled) with the current signal orientation inform us that this is the case here. You can see on this chart that this pattern continues through Saturday, which means we are on alert for mini crises or "disasters" through the weekend.
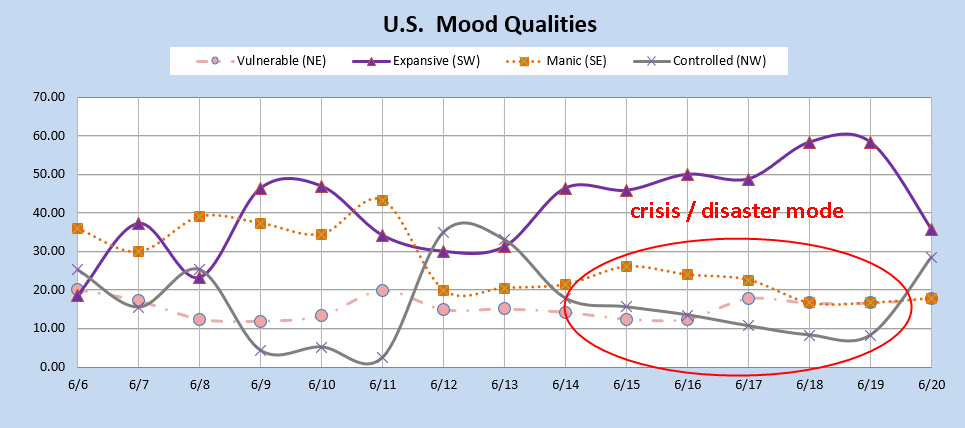
Regarding the commodities space, this multi-day pattern is not accounted for by the MMI models so the best we could do was have "no call" for today and tomorrow for gold and USD. We were watching for a potential reversal in crude, but didn't pick up that it was already here. It's disappointing to miss a big move, but such is the limitation of the current system.
In the video presentation last weekend, I mentioned that this “crisis” pattern was showing up that depended on an expected signal flip on Tuesday. If the stock market closed nearly unchanged on Tuesday or Wednesday, that would have cancelled the signal flip and the signal would have been reverted to its original orientation for the days following that. In the last 10 seconds of the video, I mentioned that the particular crisis pattern configuration on June 7 was the same as June 16. Because of that, I wondered aloud whether there might be another internet outage like before. I was amazed to find that last night was another big outage. This has nothing to do with the markets, but it gives me a moment of awe for the day.
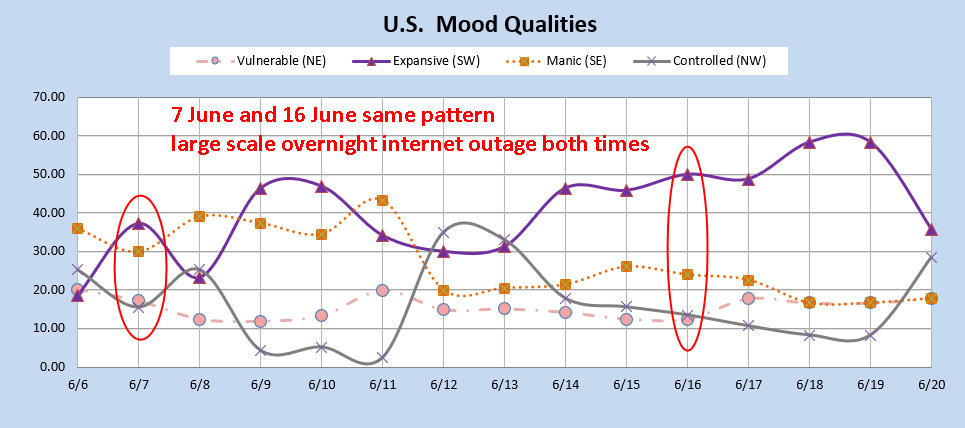
June 8 news: Massive internet outage: Websites and apps around the world go dark
June 17 news: Banks and airline websites get hit by another major internet outage
