Costco: This Is Where The Bold Will Turn Cautious
 By
Levi
By
Levi
By Levi at StockWaves; Produced with Avi Gilburt
Take a brief trip with me if you will, please. I want to go back to March 9th of this year when we turned bullish on (COST) stock. It was with a very tight stop but also specific parameters and expectations. Well, we will give you the end of the story first. COST did indeed match our projections and fulfilled its upside target and then some.
At the time of the article published on March 14th, we placed a ‘Buy’ rating on COST with a bit of a caveat. It would need to meet very specific goals. And, it certainly did, a bull through the eye of a needle, to put it metaphorically. In fact, in the article, “Costco: Should You Pay For Premium?”, we discussed what we called a ‘Bold’ rating. This was in response to the question, “How do you quantify how much to pay for a premium company like Costco?”
The ‘Bold’ rating actually turned out to be pure gold as COST doubled the S&P rate of return in the same period with the SPX gaining +21% and COST some +42%. Where do we find ourselves now? From what we can ascertain, this is where the ‘Bold’ will turn cautious. Here’s why.
Current Fundamental Snapshot
“COST is a great business but quite expensive at these levels. If technicals start suggesting a down move, fundamentals certainly support that.” - Lyn Alden
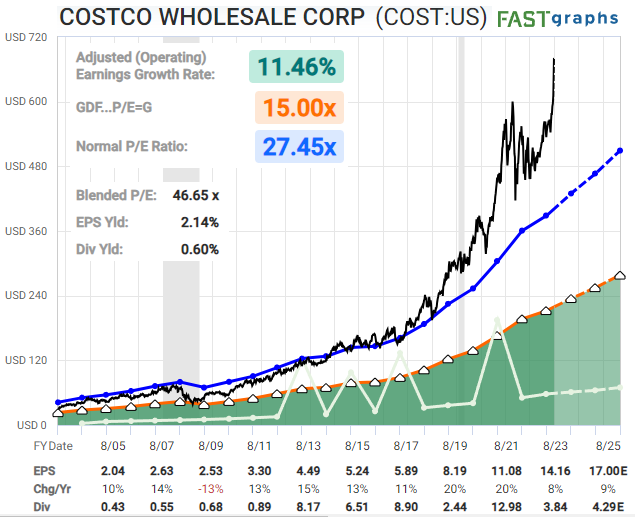
(There is a bit more detail to Costco’s fundamental picture in our initial article from March 9th, linked above).
A Brief Review And A Look Forward
Let’s use what the technicals are telling us to help measure risk vs reward at these current levels. Where did we turn more bullish on Costco stock? Here’s the original Wave Setup post from Garrett Patten back on March 9th (our article to the readership was published March 14th):
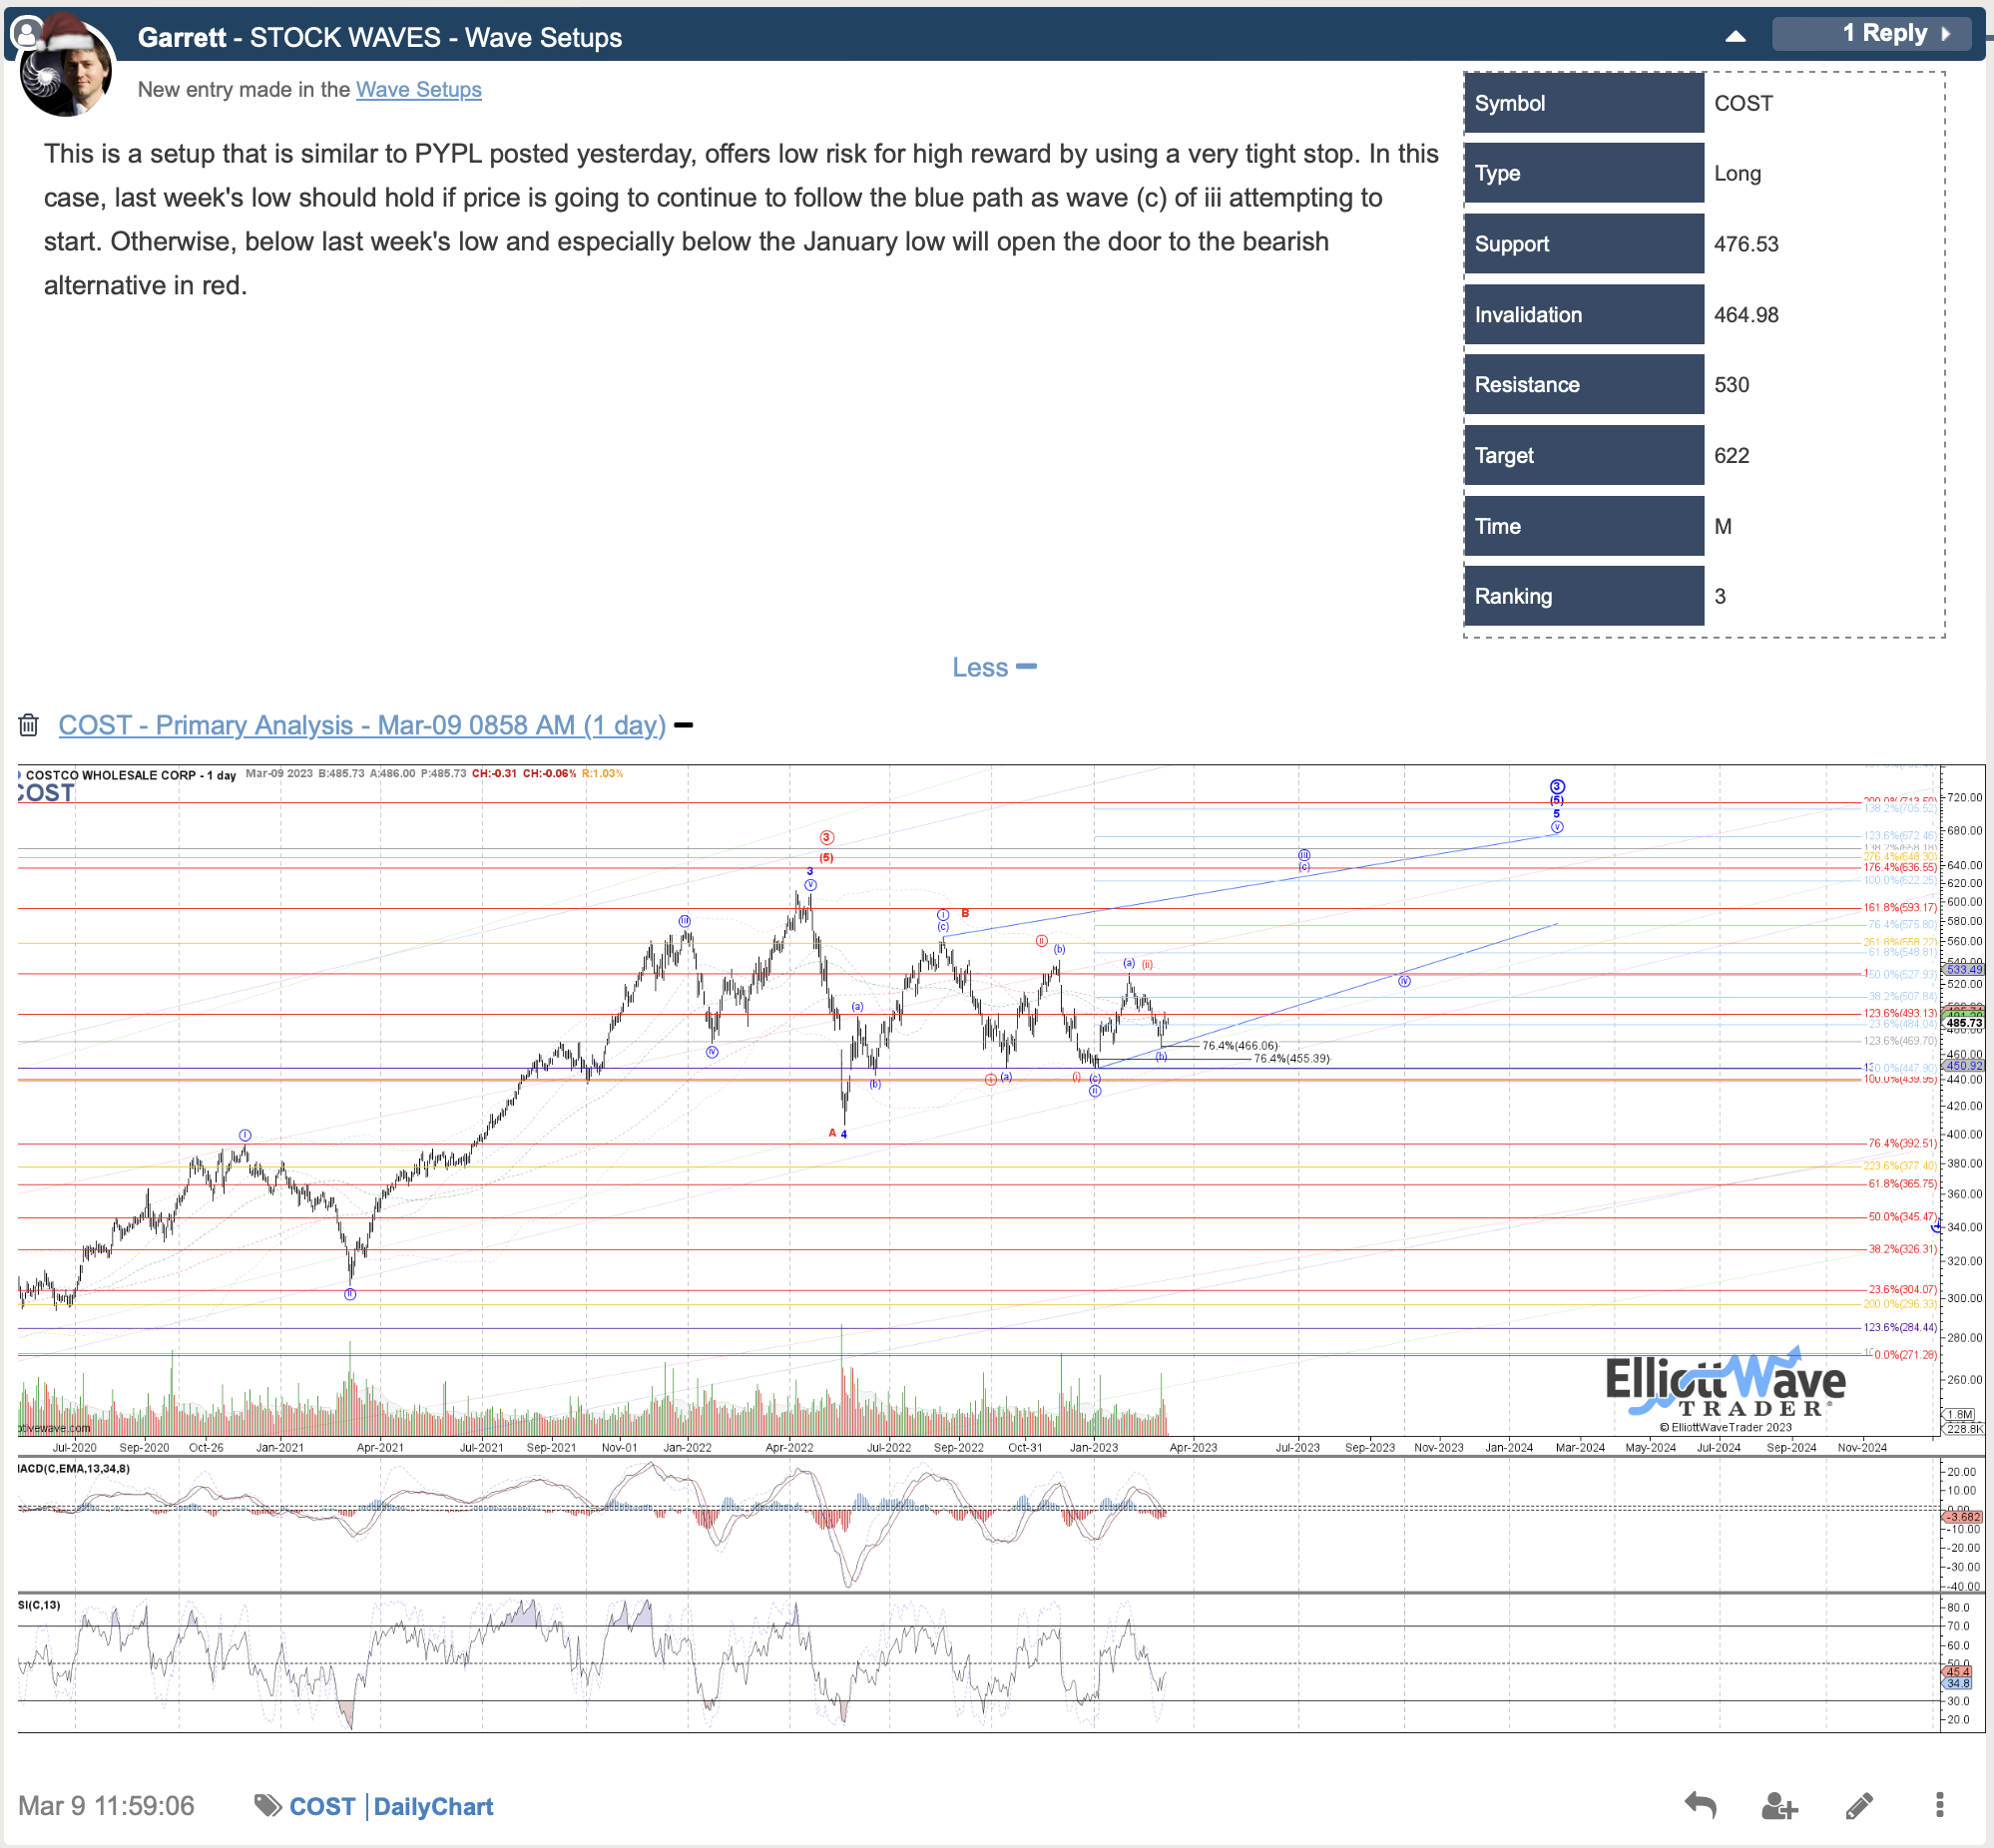 Note that Garrett shared key levels for support, also overhead resistance and the level that would invalidate the Wave Setup. Obviously, COST did not care about those lower levels and took off to the upside.
With the target from that March 9th Wave Setup met and exceeded, Zac Mannes put out this update to our members a few days ago:
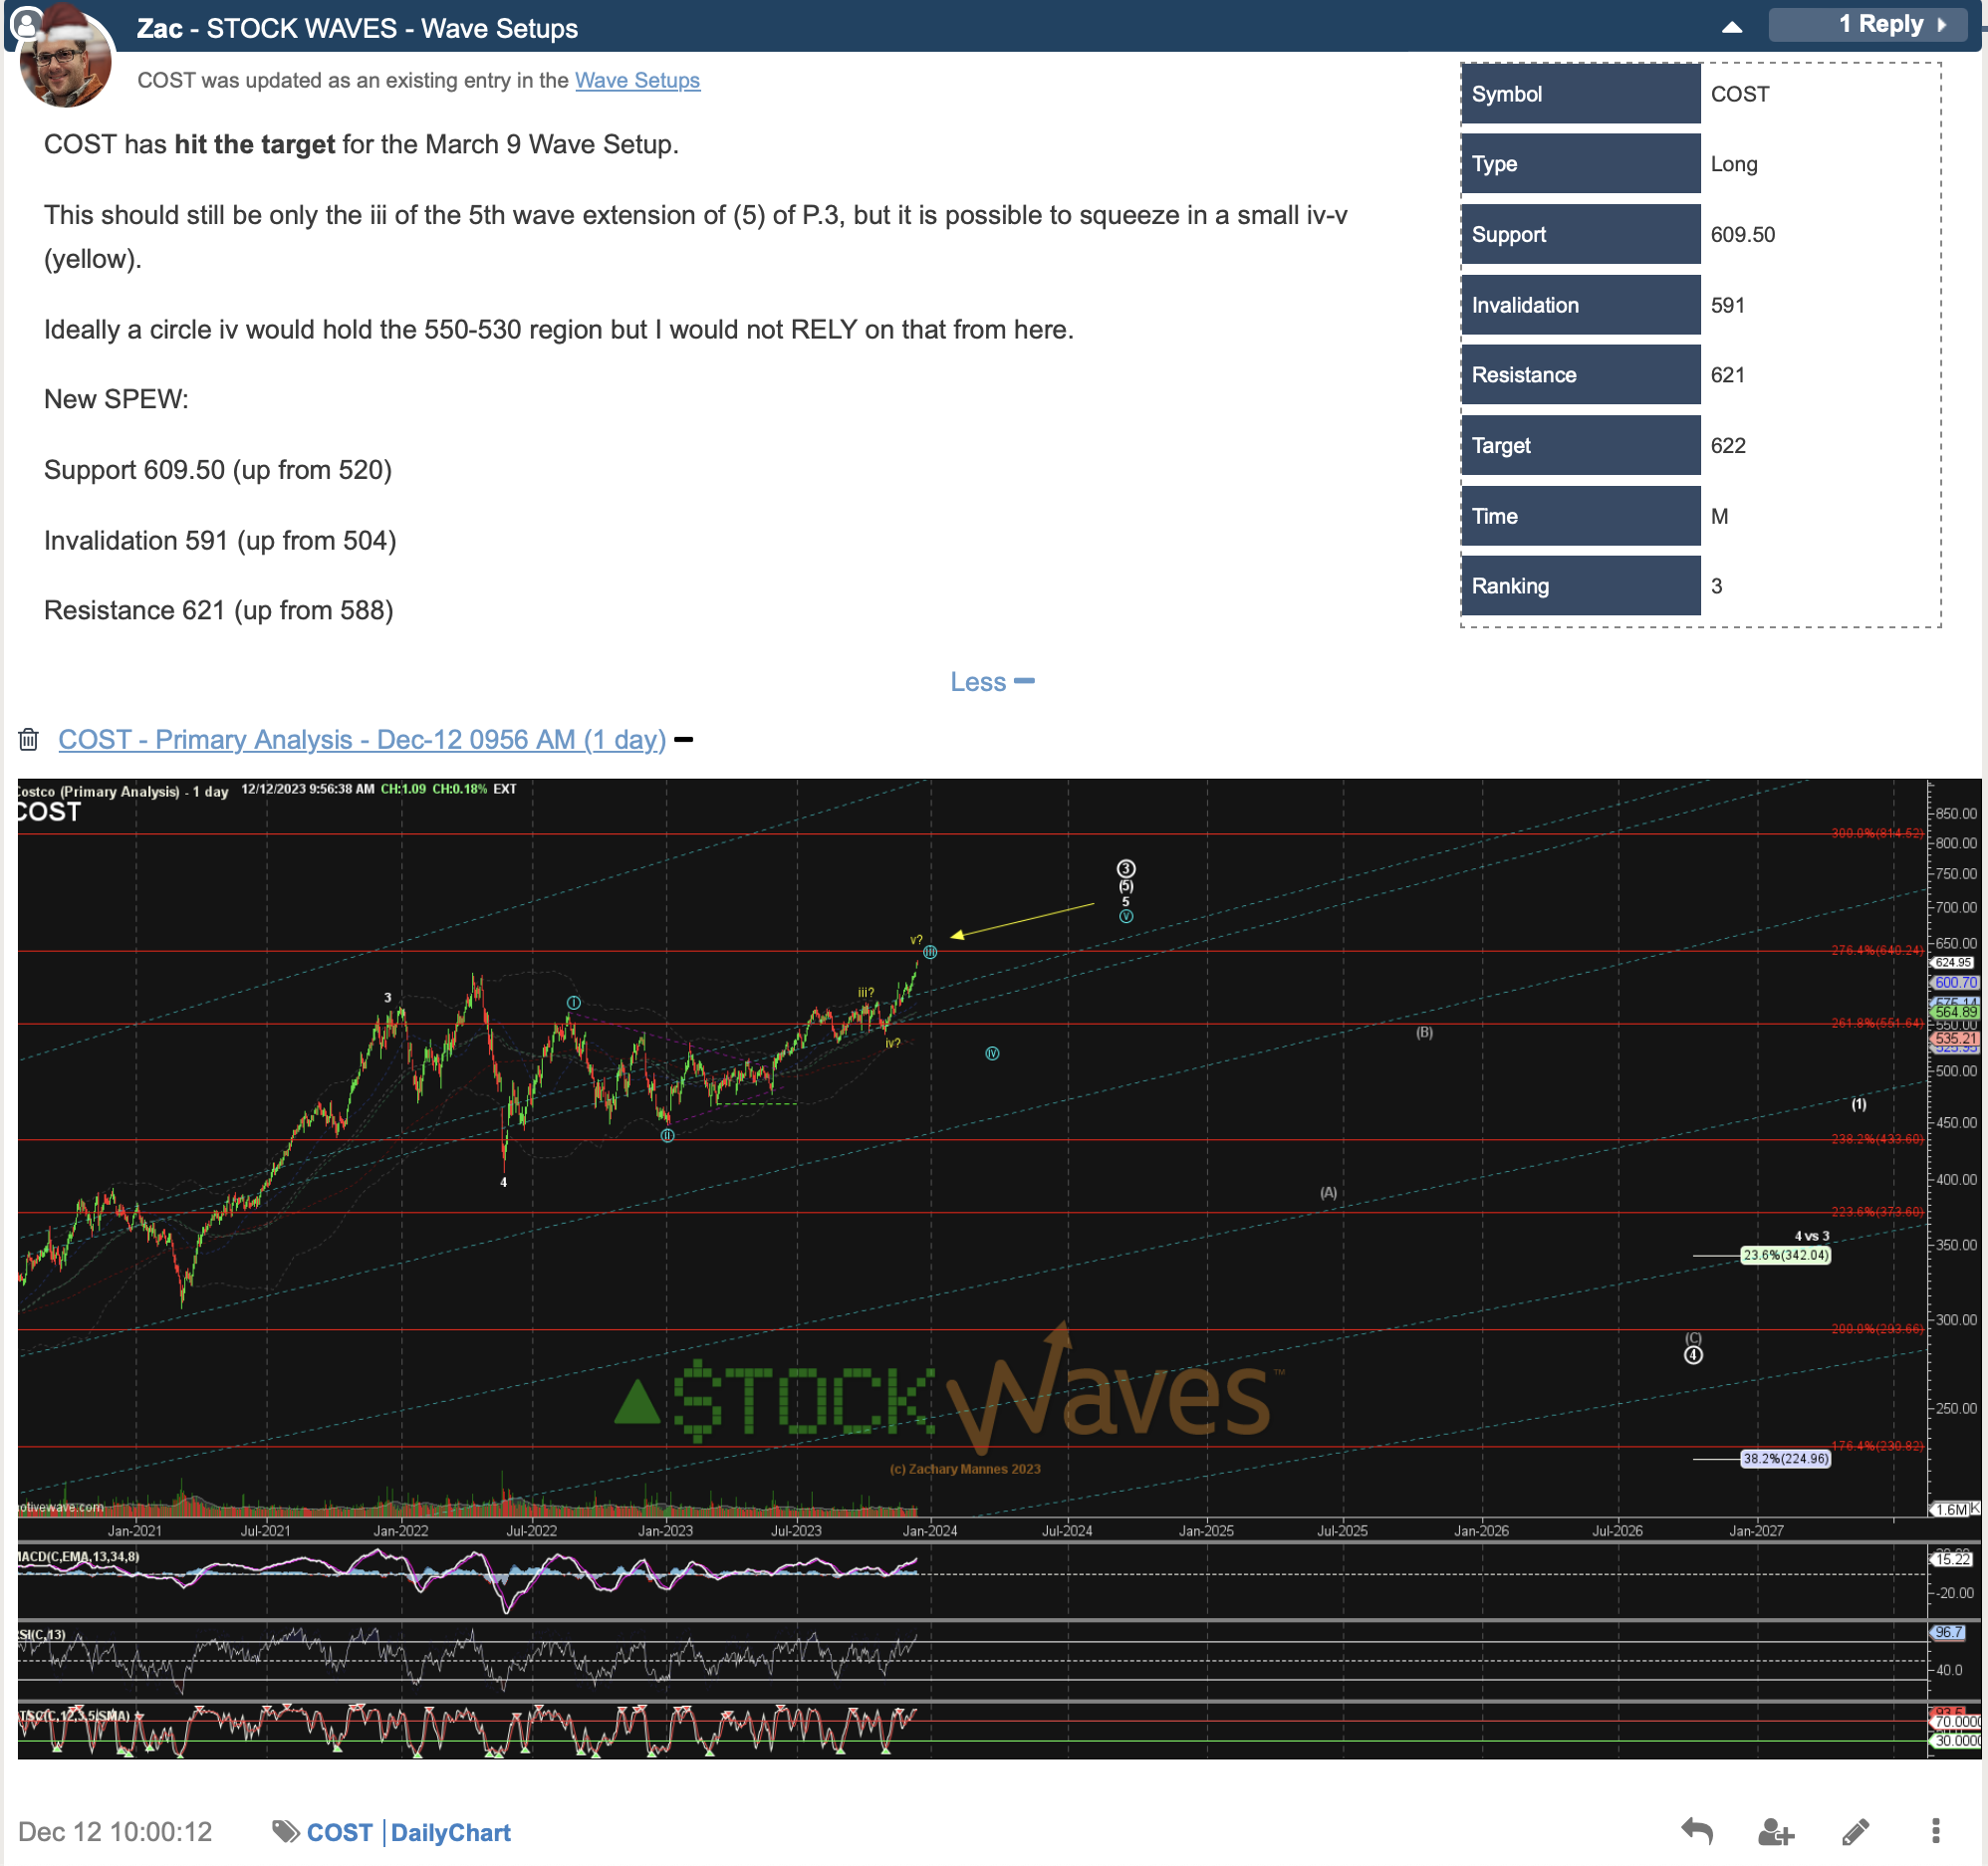
Note that we are not outright bearish COST stock. This has simply filled out the highest probability upside portion of this current move. As well, we are turning a bit more cautious here given the degree of the top that should be struck soon.
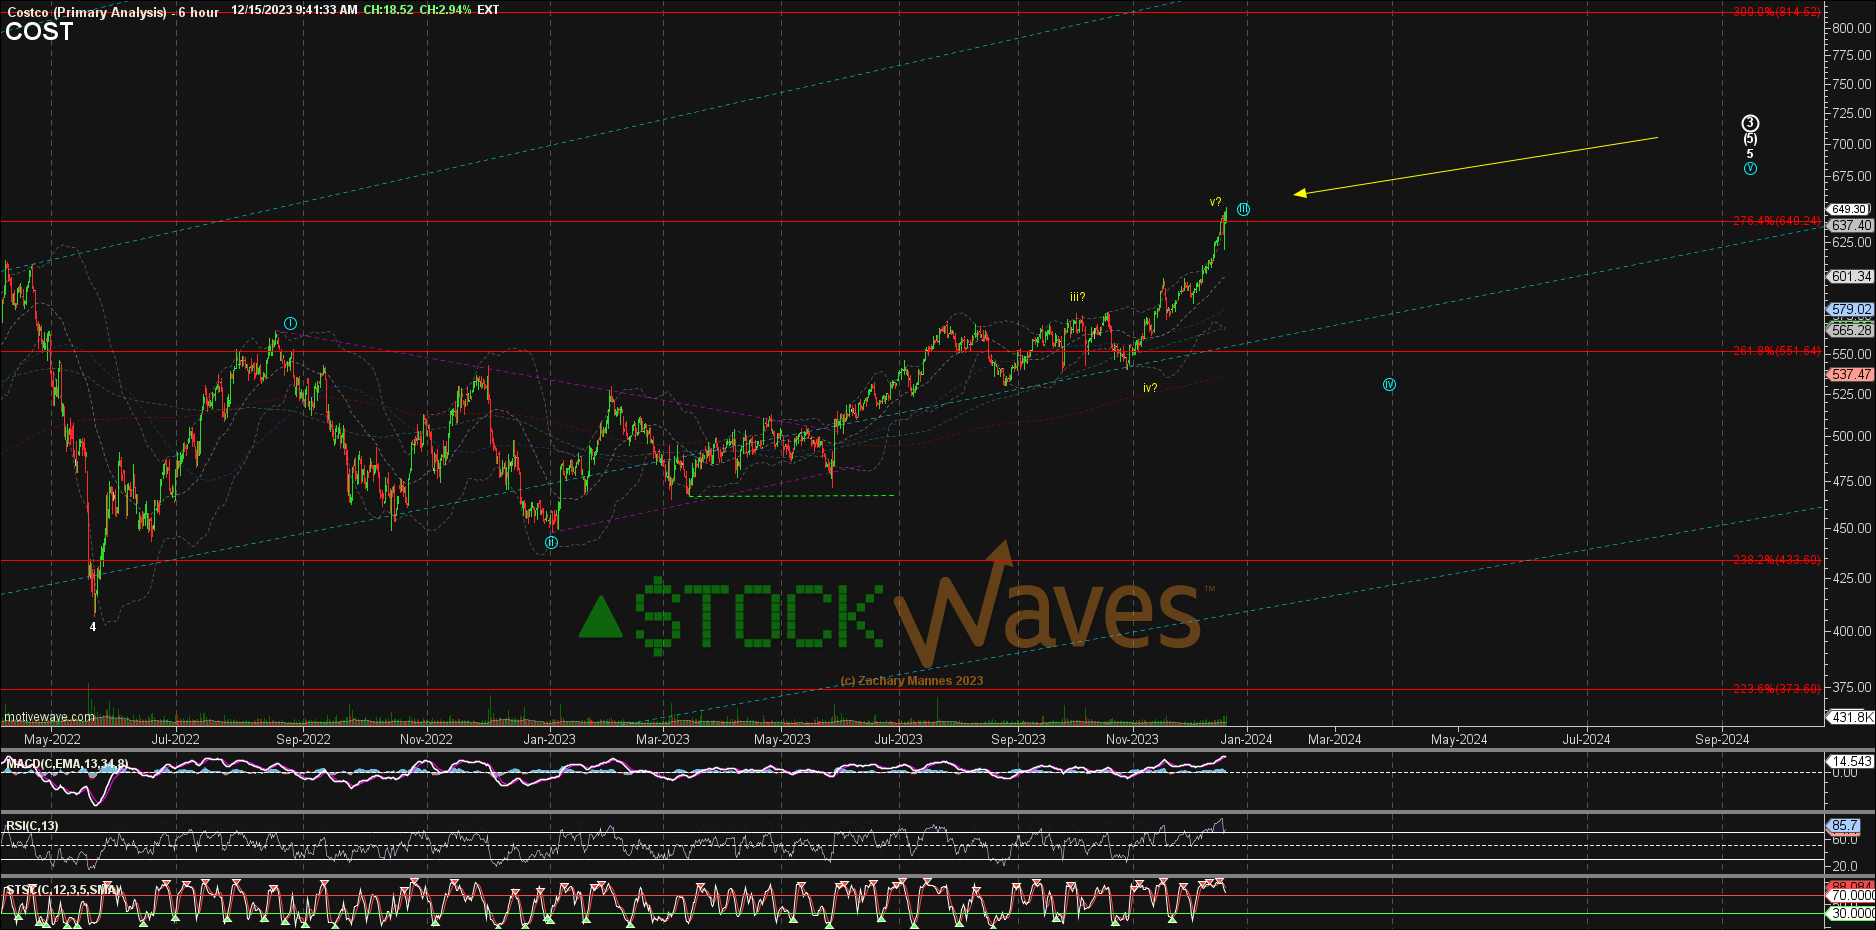
This is Zac’s most recent chart that shows us the possibility of the top in this move being struck soon. That’s the yellow subwave path shown there.
Once COST does find its swing high in this run, the pullback is likely to take some time to unfold and complete. Why is this? Because similar to many of the stocks that we are tracking, it is at a higher degree in the entire structure of price.
Specifically regarding COST, this means that price should retrace back down some 23% to 38% of the current rally structure. Those are not arbitrary numbers. They are Fibonacci retracement levels of what is counted as a Primary Wave 3 rally advance. To properly calculate these levels, a top will need to be struck first. Then, near term support will need to be taken out to the downside.
We are closely tracking this and literally hundreds of other names across various sectors of the market. Many names are telling us similar stories - it’s nearing the time to turn cautious.
How Can You Possibly Project That?
There are those that will claim that technical analysis simply explains what happened but cannot project with any reliability what is more likely to happen next. We have disproved that affirmation time and again. The main reason being that our methodology is not strictly what many categorize as ‘technical analysis’.
When traders/investors/readers hear ‘technical analysis’ they imagine trendlines, stochastic readings, moving averages and the seemingly inordinate number of other indicators that can be overlayed on a stock chart.
Ours is not that. We are using the manifestation of human behavioral patterns as they take shape before our eyes via the structure of price on a chart. This is so different than what you have traditionally seen.
In fact, for many literally thousands of our members, they have had to ‘unlearn’ what they thought they knew to embrace a new way of approaching the markets. If you are willing to acknowledge that there are many ways to view stocks and indexes, then you have taken your first step towards a ‘new’ vantage point.
If instead you are completely convinced of your own methods, then likely it will be cumbersome to add more knowledge to your repertoire.
“You are like this cup; you are full of ideas. But if your cup is full, I can't put anything in.”
This is a generalized quote that has been used to illustrate the concept that one must ‘unlearn’ that which they are convinced they already know if they are to embrace new concepts. We would encourage you to give this way of viewing markets a chance.
Start here with part 1 of Avi Gilburt’s 6-part series of articles that discuss in detail how we look at charts and what they tell us.
Conclusion
Yes, there are nuances to the analysis. Once familiar with our methodology, our members discover a powerful ally on their side to provide guidance and risk management in their trading/investing.
There are many ways to analyze and track stocks and the market they form. Some are more consistent than others. For us, this method has proved the most reliable and keeps us on the right side of the trade much more often than not. Nothing is perfect in this world, but for those looking to open their eyes to a new universe of trading and investing, why not consider studying this further? It may just be one of the most illuminating projects you undertake.
