Costco - The King Of Retail: A Case For Caution
 By
Levi
By
Levi
By Levi at Elliott Wave Trader; Produced with Avi Gilburt
Have you visited your local Costco lately? What kind of a question is that? Of course you have. There are few who are not enamored with the big box storehouse of retail treasures. And since its inception, the stock has basically been on a 40 year rally. Yes, that is zooming out as there have also been some substantial pullbacks along the way.
1992 to 1995 was a particularly rough period with the stock falling some -70%. The 2000 to 2010 epoch was not much more than a sideways consolidation. But since then there has not been much looking back other than for brief pauses and a quick sip of water to refresh.
Looking forward, can this current rate of ascent maintain its angle? What would be more likely? We’re going to use the tools at our disposal to look at this from both the fundamental aspect and the study of human behavior at the crowd level. Lyn Alden is best-in-class when it comes to fundamental analysis and commentary. We are privileged to have her as our lead fundamental analyst in StockWaves. Let’s listen in to a portion of some of her recent comments to our members regarding COST, as well as other large blue-chip stocks (for the purposes of this article, the comments have been condensed).
Lyn Comments On The King (COST)
“For quite a while, there has been a very strong structural bid for large cap growth US companies that are perceived to be safe. What these companies generally have in common is that they have low earnings uncertainty/volatility. Due to steady business operations combined with recurring share buybacks on top of that, these companies are viewed as the bluest of blue chips, and are viewed to be rather recession-resistant.
However, risks form when valuations become very high. Even if the underlying company continues to do well, the stock price can suffer for 3-5 years or more as the valuation resets back toward normal as earnings catch up.
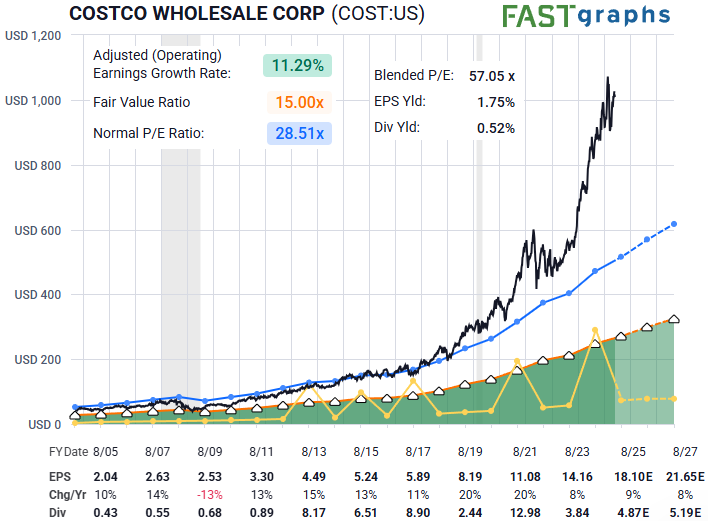
I've highlighted Costco (COST) and Walmart (WMT) as examples of this phenomenon:
F.A.S.T. Graphs 101:
- black line: the current and historical stock price
- blue line: what the stock price would be if were at its historically average price/earnings ratio
- orange line: a conservative measure of valuation (a 15x price/earnings in this case)
- yellow line: dividends paid that year (and the payout ratio is relative to the orange line)
- dark/light green: the transition between historical earnings numbers and consensus analysts’ forecast earnings number
Companies like Costco and Walmart are very strong, but they operate on razor-thin margins, and thus have to navigate the complex tariff situation for the foreign-made portion of their goods. Overall, I view these types of companies as overpriced. Investors are paying a very big premium for large companies with low earnings uncertainty/volatility. Some of them are at more extreme valuations than others (e.g. COST seems crazier to me than MSFT), but they're quite richly priced as a group.” - Lyn Alden
We now have one main data point from the fundamentals. Now let’s see what the study of crowd sentiment reveals.
Let Crowd Sentiment Speak To You
When we look at the chart for COST it is the larger structure of price that is telling us to be cautious at this time.
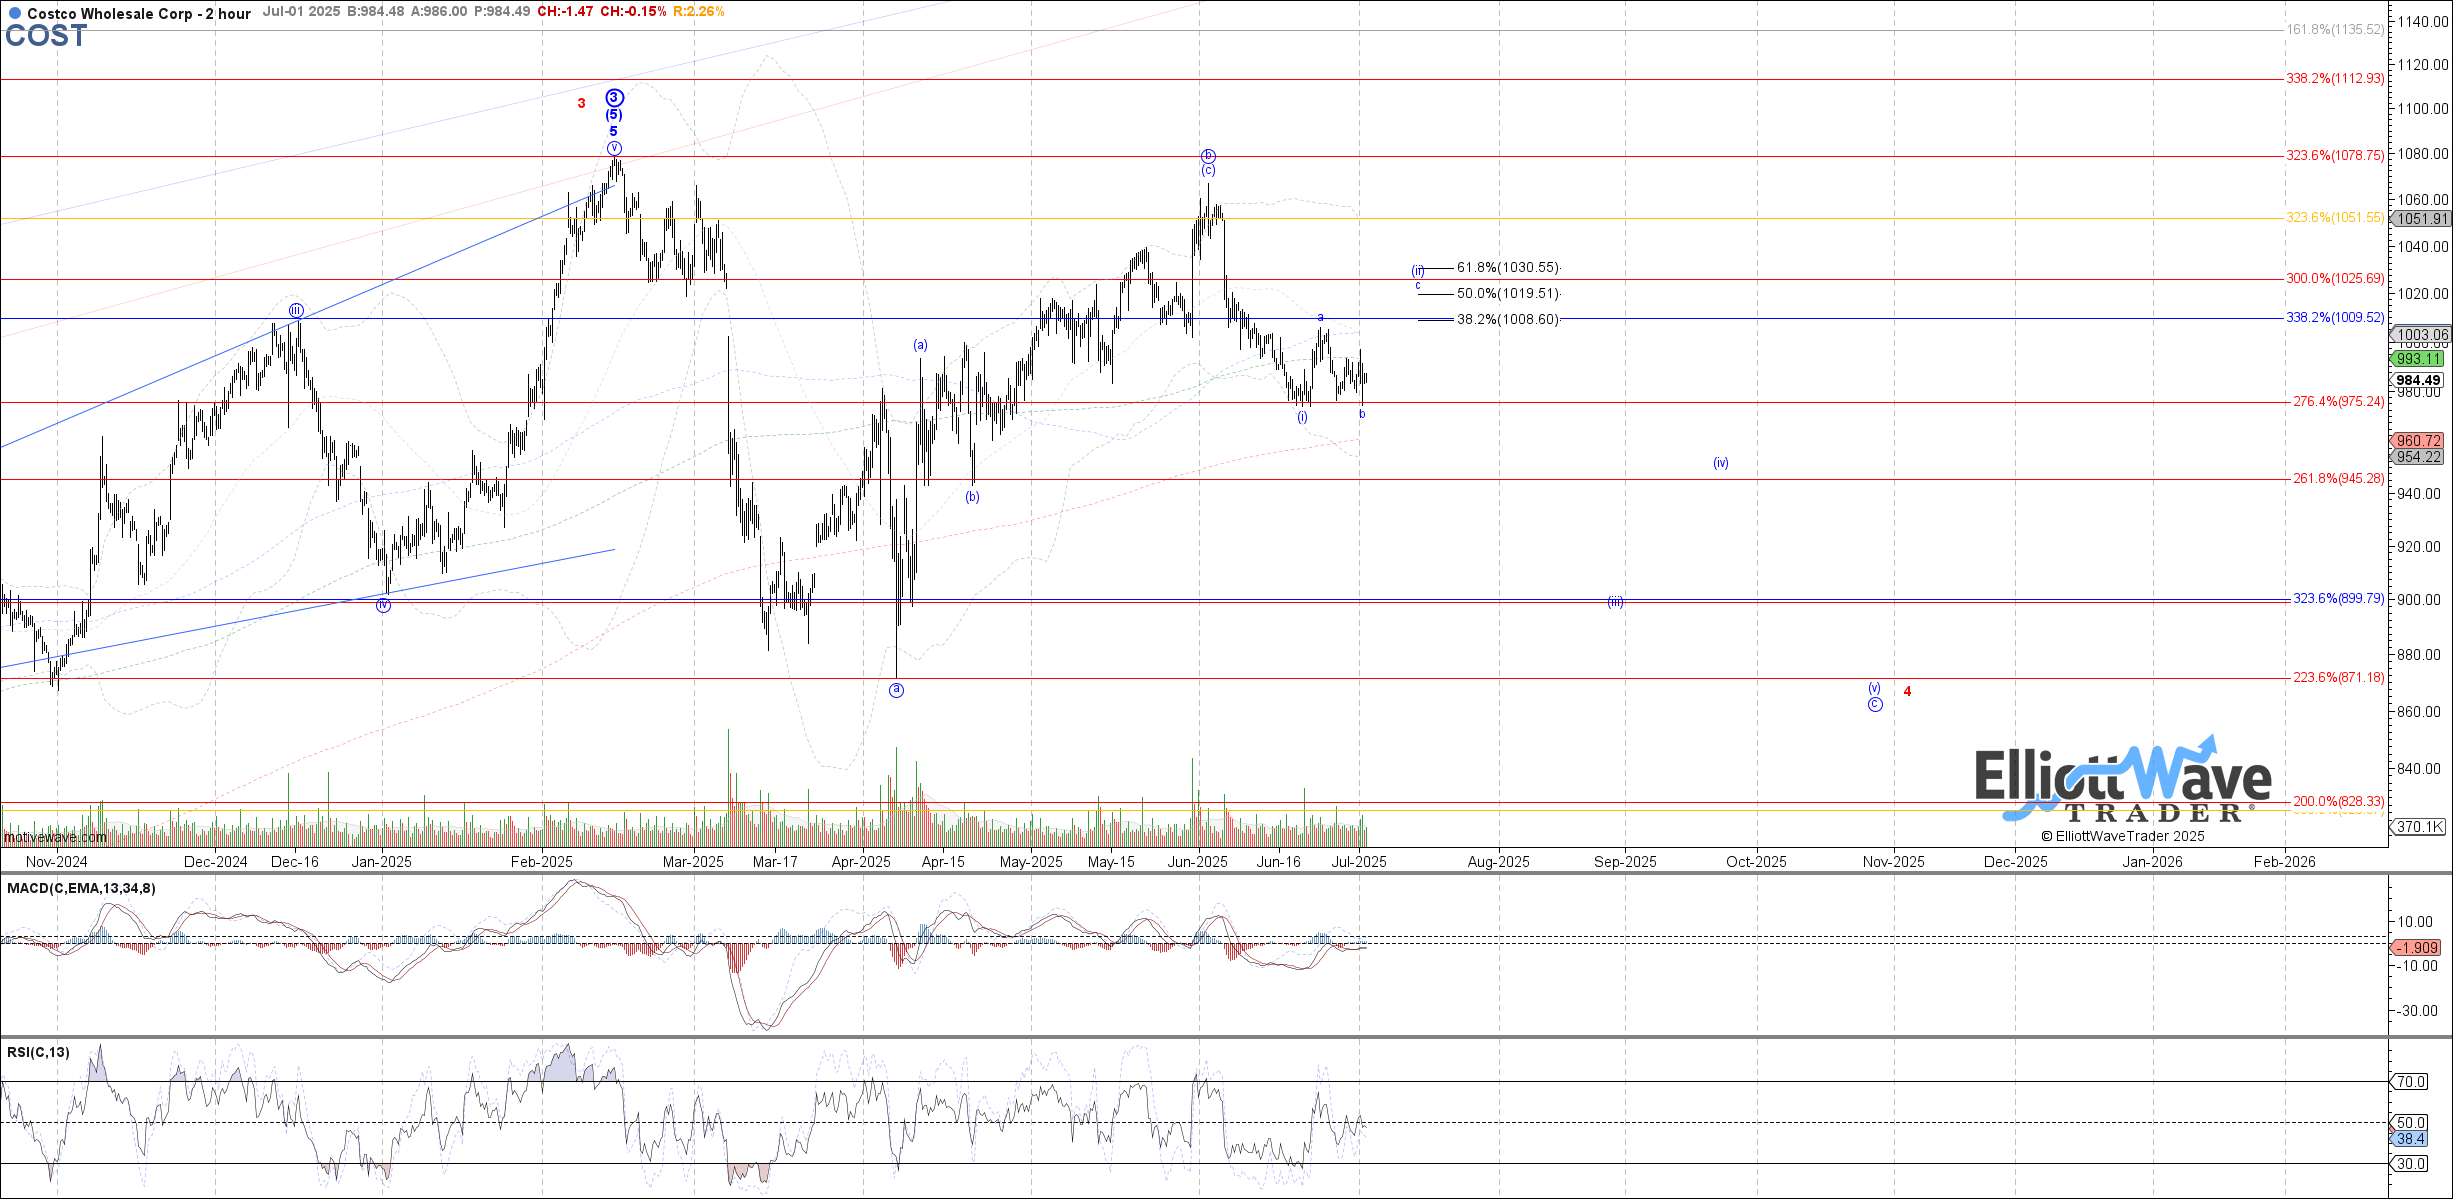
Most salient is the big blue stack at the February high. What does the nomenclature mean? In rudimentary terms, several degrees, or intervals, of the structure arrived to a conclusion at one point.
Here’s one comparison: A year is divided into months, weeks, days, etc. Each week has days and each day even has hours, we could go on. This is quite similar to this number of degrees of a structure coming to a completion at once. It’s like a year ending and another year beginning.
In the case of COST, though, when this structure completed, we would then anticipate the resulting pullback and correction to take a great amount of time. It’s not necessarily long-term bearish but the consolidation may be long-lasting in duration.
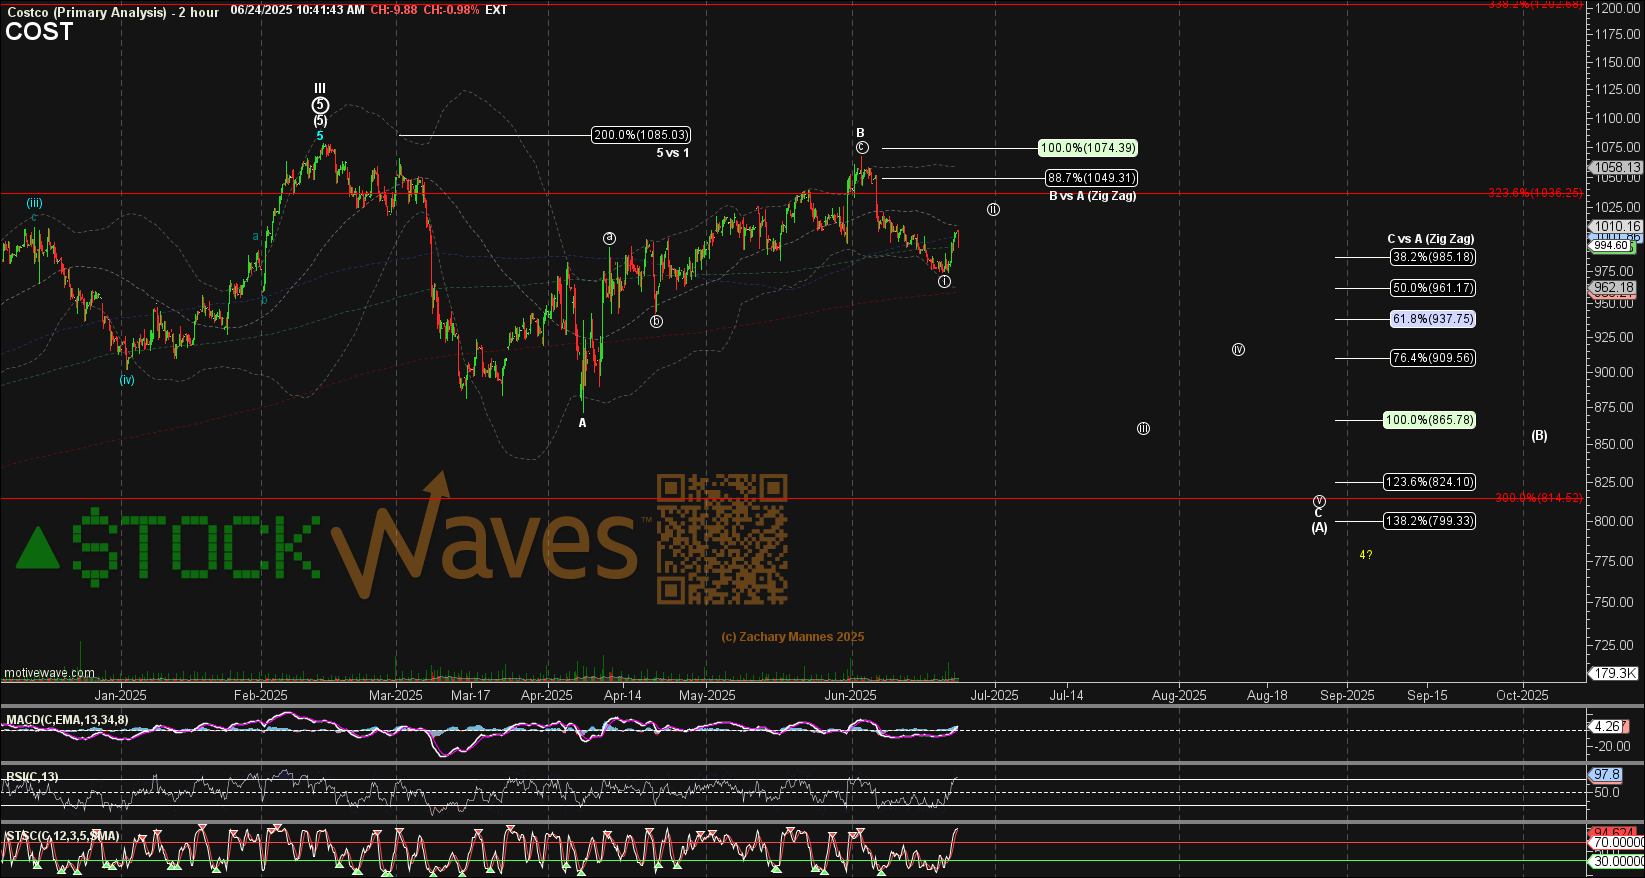
Note that both Garrett and Zac have a potentially bearish setup for COST in the near term. It is likely the start to the anticipated corrective period discussed above.
Yes, it is plausible that COST overcomes this bearish setup and could even continue to new highs. But, remember, this is a a setup and not a certainty.
What Do Others Think Of This Analysis Method?
Many will argue with us regarding how we arrive at these targets and parameters. Some outright dismiss the methodology without even taking a minimum requisite time to understand. And, you know what? That’s OK.
Some simply will not allow themselves to see the markets through a probabilistic lens as we do. Granted, we will help others to learn our methodology, even those that begin begrudgingly. Many begin as skeptics.
In fact, there are literally thousands of readers and members that attest to the veracity and utility of this work. Please allow me to share with you an excerpt from an article by Avi Gilburt titled, “Why don’t more people use Elliott Wave analysis?”
“Well, first let’s start with the understanding that it takes a lot of detailed work and calculation in order to perform a proper Elliott Wave analysis. Moreover, it is a very complicated method to learn. So, the entry into this methodology is not easy and to perform a proper analysis is not easy. But, then, show me anything that is truly worthwhile that does not require an initial investment and hard work.
To this end, most of what I see being claimed as Elliott Wave analysis is nothing more than what I call “wave slapping.” This is when an analyst places numbers and letters on a chart based either upon the ‘look’ of the chart, or to support their prior bias about market direction. Since I would classify most analysis presented as Elliott Wave analysis as such, resultantly, most analysis is rarely correct more than 50% of the time. And, this lends to the argument about Elliott Wave being too subjective in nature.
So, when investors follow this type of ‘analysis’ and see how often it is wrong, they make the assumption that Elliott Wave really does not work, and are turned off.” - Avi Gilburt
Does This Really Work? See The Results For Yourself
We will be the first to tell you the answer to that question: “Not always”. However, we have yet to find another analysis methodology that can provide context at any moment in time for the observed market/stock. Nor have we found another tool that can dynamically adapt in real-time to the markets as this does.
Over time, with a large sample size of setups, you will come to appreciate the utility of this analysis method for your trading and investing. Of course, not all setups are going to play out as illustrated. That is simply the nature of dynamic markets in action. This methodology will tell you when to shift your weight and when the scenario invalidates.
So, a setup can be wrong. The opinion of the analysts may need revision. It’s OK to be wrong - just don’t stay wrong. Does your current method tell you when to adjust your view? We should be students and observers of the emotions ever present in the markets. But we don’t benefit from becoming participants in this sentiment. Welcome to an entirely new way of viewing the markets.
