Costco: Should You Pay For Premium?
 By
Levi
By
Levi
- We delve into the fundamentals with Lyn Alden and discover something interesting.
- What is the technical setup telling us at the moment?
- How do you quantify how much to pay for a premium company like Costco?
by Levi at StockWaves; produced with Avi Gilburt
We have an intriguing situation with the fundamentals telling one story and the technicals pointing to another potential outcome. How do we decide what is the more likely path? Let’s discuss both sides and then how to make the final determination.
Digging Into The Fundamentals With Lyn Alden
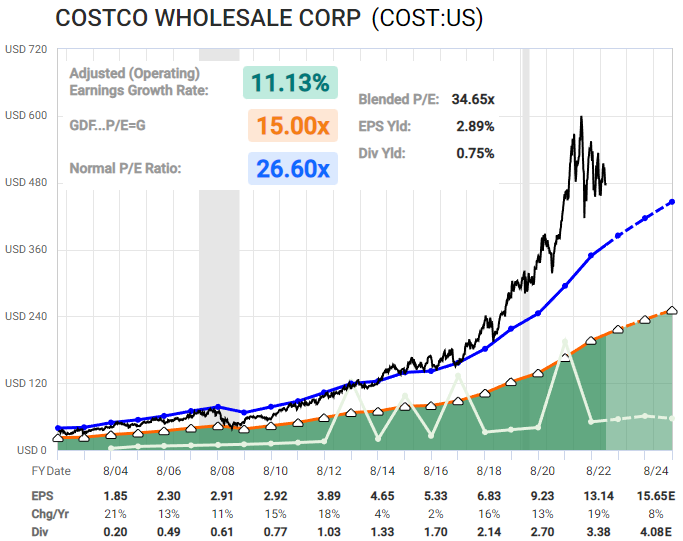
Lyn Alden provides us with unique insights from her deep dives into the financials and fundamentals of companies that she covers. Here are some of her most recent findings for (COST).
“It looks very interesting from a technical standpoint.
From a fundamental standpoint, I currently avoid Costco due to valuation concerns. It's a well-run company and has had a tendency to surprise to the upside, but at well over 30x earnings for a company of this size and growth rate, investors are paying quite a premium for it.”
(see FastGraph)
"Aside from following the technicals, for an investor to make a bullish case from the fundamental perspective, one would likely need a good case for why earnings are likely to outperform an analyst expectations.”
What Story Is Being Told By The Technicals?
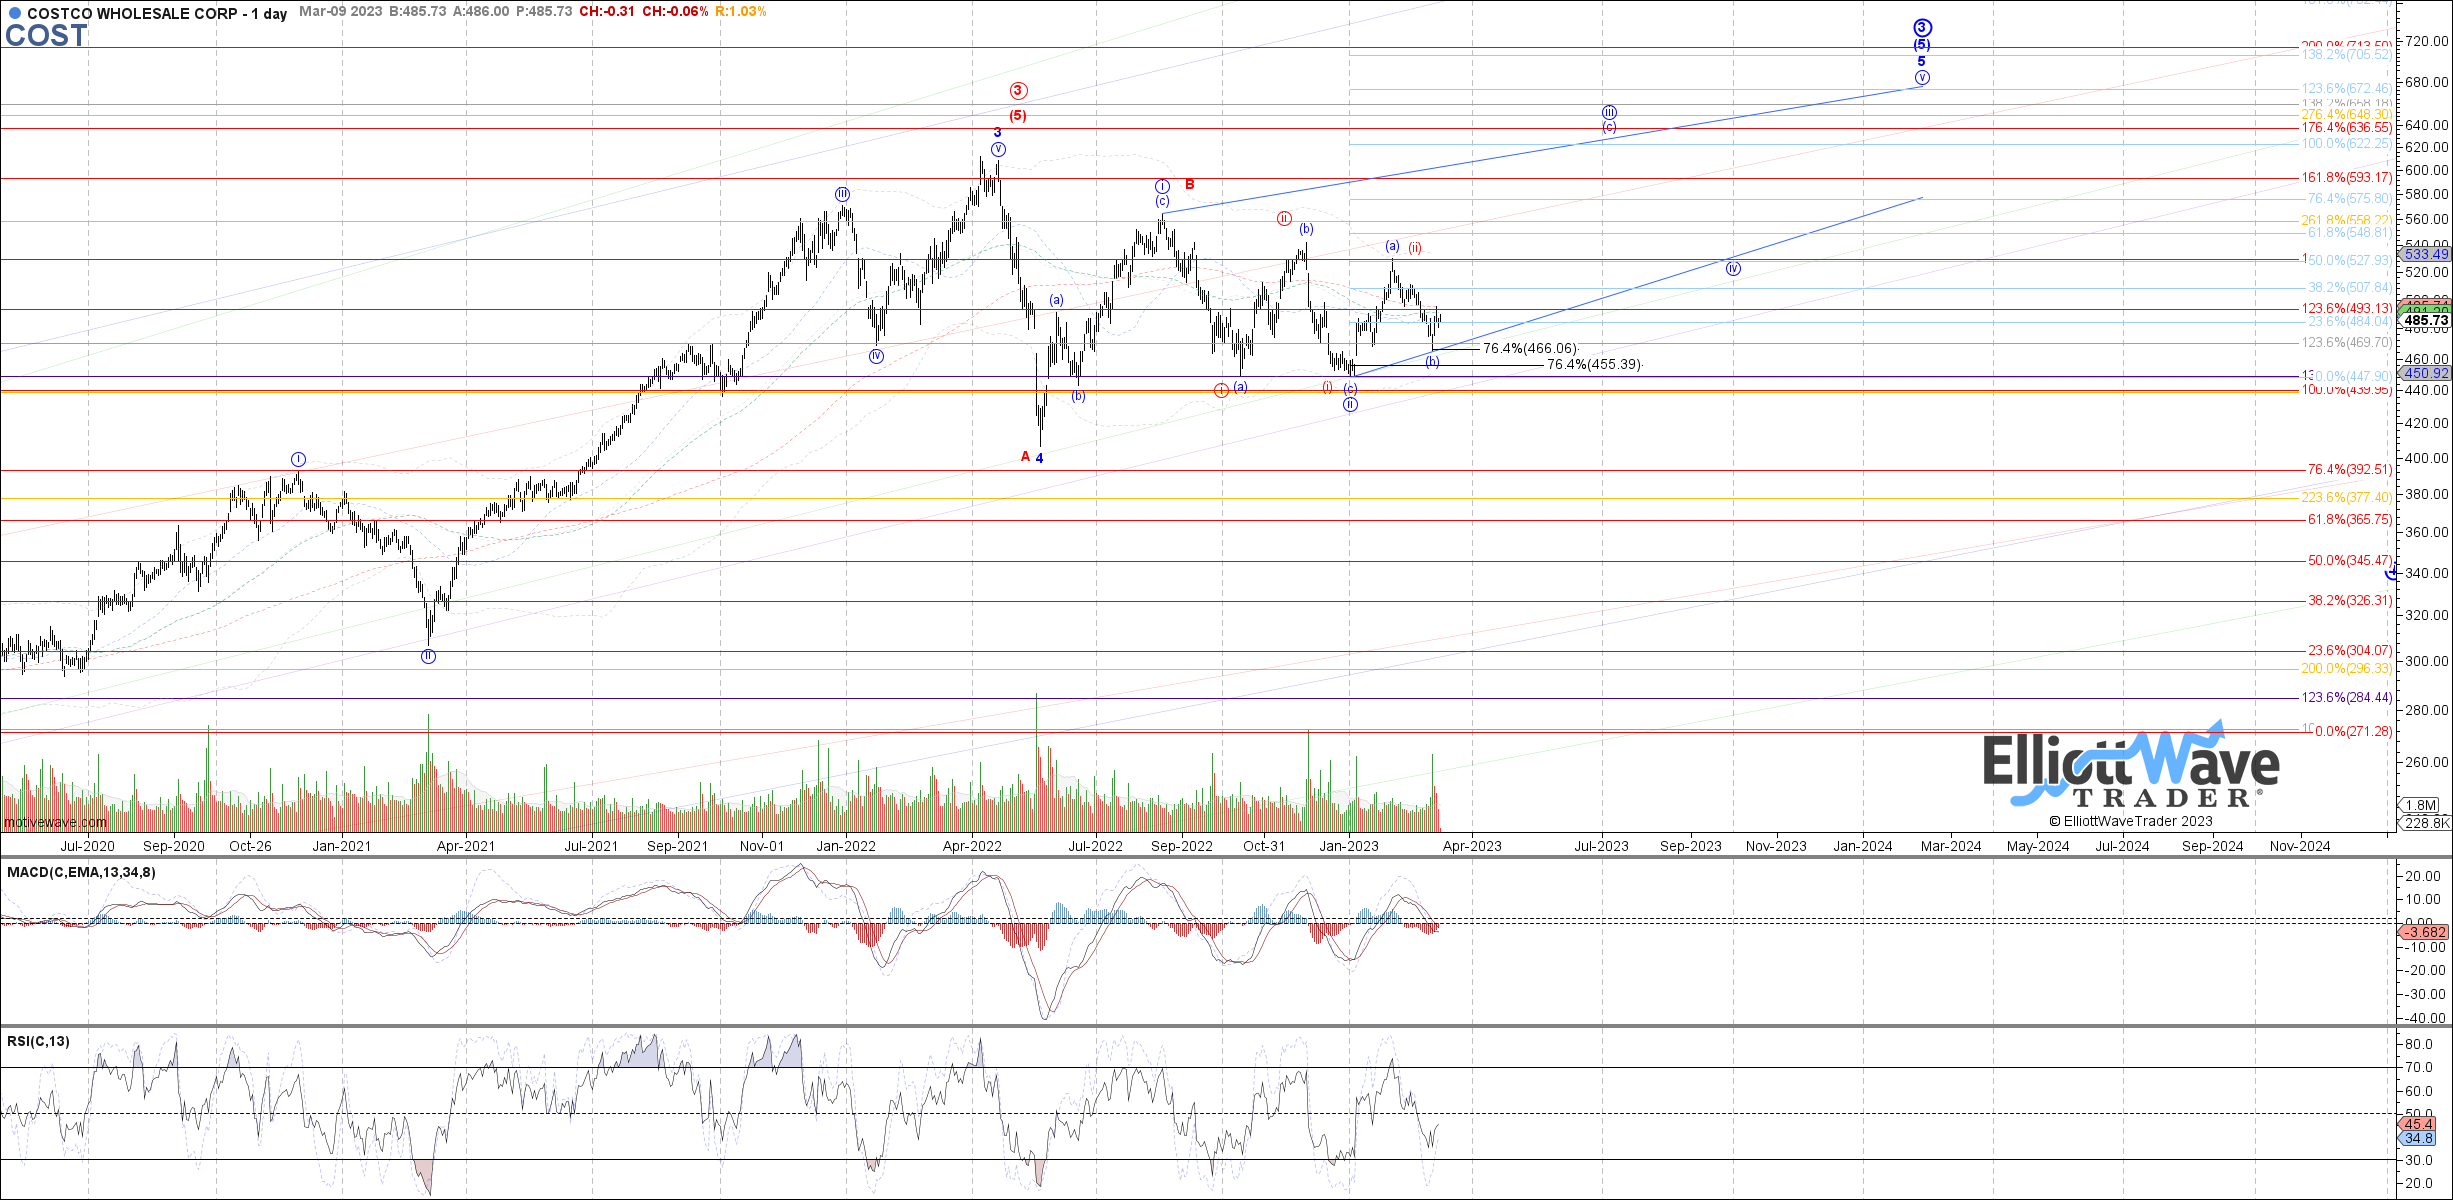
As Lyn comments above, there is an interesting setup here. Yes, you see us placing a ‘buy’ rating at this moment. A ‘hold’ could also be the label until this proves its stance a bit better. So, do we combine the ratings? ‘Bold’ might be the case here. For the ‘bold’ long here with a tight stop is what the chart is saying.
(chart)
If (COST) is to follow the Blue path proposed here then, at worst, the January low or better should hold. A more conservative approach could be to let the initial rally phase of the [c] of circle ‘iii’ to fill out and then buy a pullback.
Risks
If this breaks the [b] wave low then it may have formed 5 waves down from the Blue [a]. It is likely that a corrective bounce would unfold thereafter and give a chance to exit at a slight profit or breakeven.
The bullish path would play out with 5 waves up from the [b] wave low, a 3 wave corrective pullback and then a continuation of the rally. This is the type of scenario where investors are willing to pay a premium for this stock.
How Do We Measure How Much To Pay For Premium?
People are willing to pay for premium. There are certain brands that command a higher multiple. Ultimately the premium is simply driven by supply and demand. Demand is a measure of sentiment. Through much research and experience we have observed time and again that sentiment can be measured.
This is the basis of Elliott Wave Theory with Fibonacci Pinball. The basics of this methodology tell us that should the Blue path play out as illustrated for (COST), the next target overhead is $635. This is valid for as long as low at $447 holds. And, ideally, in the near term bullish setup, the low at $466 holds and this begins the next phase of this rally structure.
You Don’t Really Believe All This Elliott Wave Mumbo Jumbo, Do You?
I want to share an excerpt from an article written by Avi Gilburt. This is part-4 of the 6-part series, “This Analysis Will Change The Way You Invest Forever”, published in its entirety here on Seeking Alpha (see the article here).
“One of the practices which cause people to feel that Elliott Wave analysis just does not work is that they engage in something I refer to as "wave slapping." So, I want to take a moment to provide a warning to all of you who will now open your charts and try to find a 5 wave move. You see, many will take their rudimentary understanding of Elliott Wave and just ‘count’ how many waves they see going up or down, and then place their labels for the Elliott Wave structure based upon that ‘look'. I want to be very clear: This is not Elliott Wave analysis! Yet, this is likely the most common use I have seen of Elliott's 5-wave model.
So, if your intention is to come up with an accurate Elliott Wave analysis, you will need to accurately count all the sub-waves within the structures you are labeling to make sure they adhere to the appropriate Elliott Wave structures. This takes a lot of detailed work. Without this detailed work, the chances that you will be accurate in your assessment of market direction will be reduced to the point of guessing. And that is why "wave slappers" give Elliott Wave a bad name, as they provide nothing more than guesswork. Moreover, when their expectations are not met, they throw their hands up in the air and claim that Elliott Wave simply does not work.”
Don’t Be Turned Off By Misapplication Of This Methodology
Obtaining true understanding of this methodology takes time and effort. For those willing to invest said effort, it pays off immensely. Those that are turned off by the words “Elliott Wave” typically have come across those that misapply the theory or are not willing to devote the requisite energies needed.
Our methodology is pointing to a low-risk, high-reward setup for (COST). Not all paths will play out as illustrated. We view the markets from a probabilistic standpoint. But at the same time we have specific levels to indicate when it is time to step aside or even change our stance and shift our weight. This “Bold” rating for (COST) may end up at new all-time highs for the stock.
There are many ways to analyze and track stocks and the market they form. Some are more consistent than others. For us, this method has proved the most reliable and keeps us on the right side of the trade much more often than not. Nothing is perfect in this world, but for those looking to open their eyes to a new universe of trading and investing, why not consider studying this further? It may just be one of the most illuminating projects you undertake.