Costco: Fundamentals Align With Technicals - And It’s Not Bullish
By Levi at Elliott Wave Trader; Produced with Avi Gilburt
When Lyn Alden renders an opinion, we listen carefully. As one of our lead analysts, she regularly covers key stocks as well as broader market macro views. One of the principal tenets in our study of stocks is to identify where the fundamentals and technicals align. This will provide us with high-probability setups in both bullish and bearish types of scenarios.
What’s more, fundamentals may assist us in determining the landscape in either the macro view or in company specific fashion. And then it is typically the technicals that will lead any initial turns in price on the chart.
A Fundamental Comparison
Let’s listen in as Lyn describes a striking resemblance between two stalwarts in the retail field.
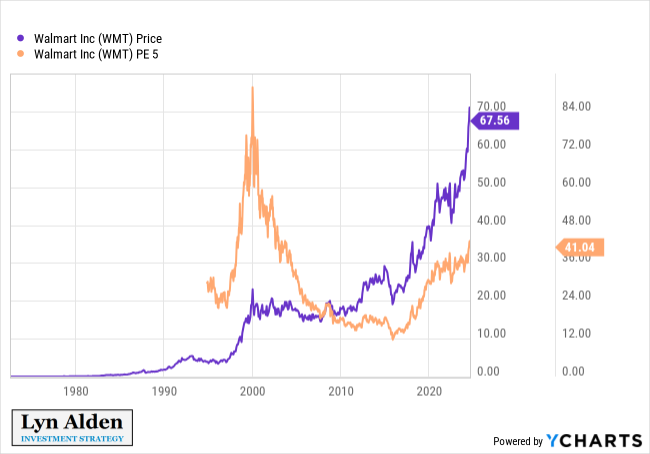
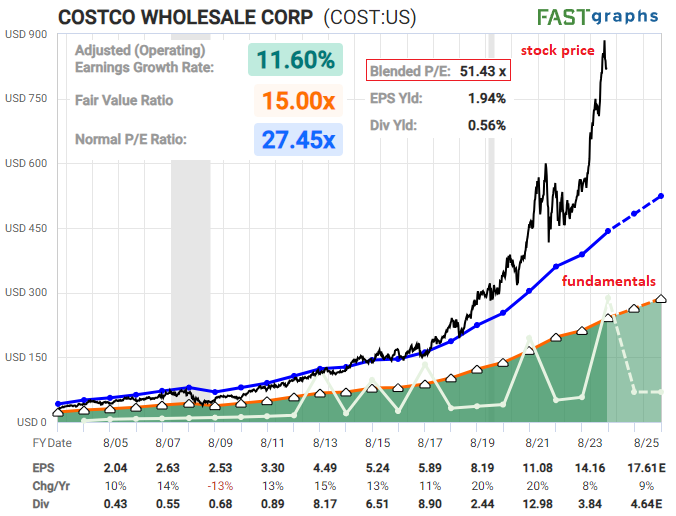
“Costco reminds me of Walmart in the late 1990s. It was growing very well, but it reached an extremely high valuation. And so for the next decade the stock ended up going sideways even as the underlying fundamentals kept growing, since the valuation fell back down to reality.
Today, Costco is an amazing company, and has a decent growth rate, but the valuation of around 50x earnings is very hard to justify, and so it risks having a similar outcome of good fundamental results but a stagnant stock price.” - Lyn Alden
So how do we identify the likely path forward for (COST) stock?
Past Performance Is No Guarantee Of Future Results - Really?
This is a common disclaimer used in financial prospectus. And, of course, it's an important reminder. As well, in our work, we provide probabilities and the most likely path forward that we're able to identify.
But, it's also a fundamental principle of Elliott Wave Theory, when correctly applied, that the past structure of price is exactly what points to what will likely happen next. So, in a way, past performance is precisely what we use to provide probabilities and targets.
Remember that we arrive at targets, both short and longer term, by taking advantage of the repeating fractal nature of the markets. It's these structures that unfold in a predictable manner that allows for this.
Now, before you claim heresy or hogwash, please take the requisite time to understand what we are presenting and have a look at our track record. All of this information is available to the readership in past articles. For a quick start, perhaps begin here. It’s the introduction to our methodology provided by Avi Gilburt in a six-part series.
The Practical Application Of The Theory
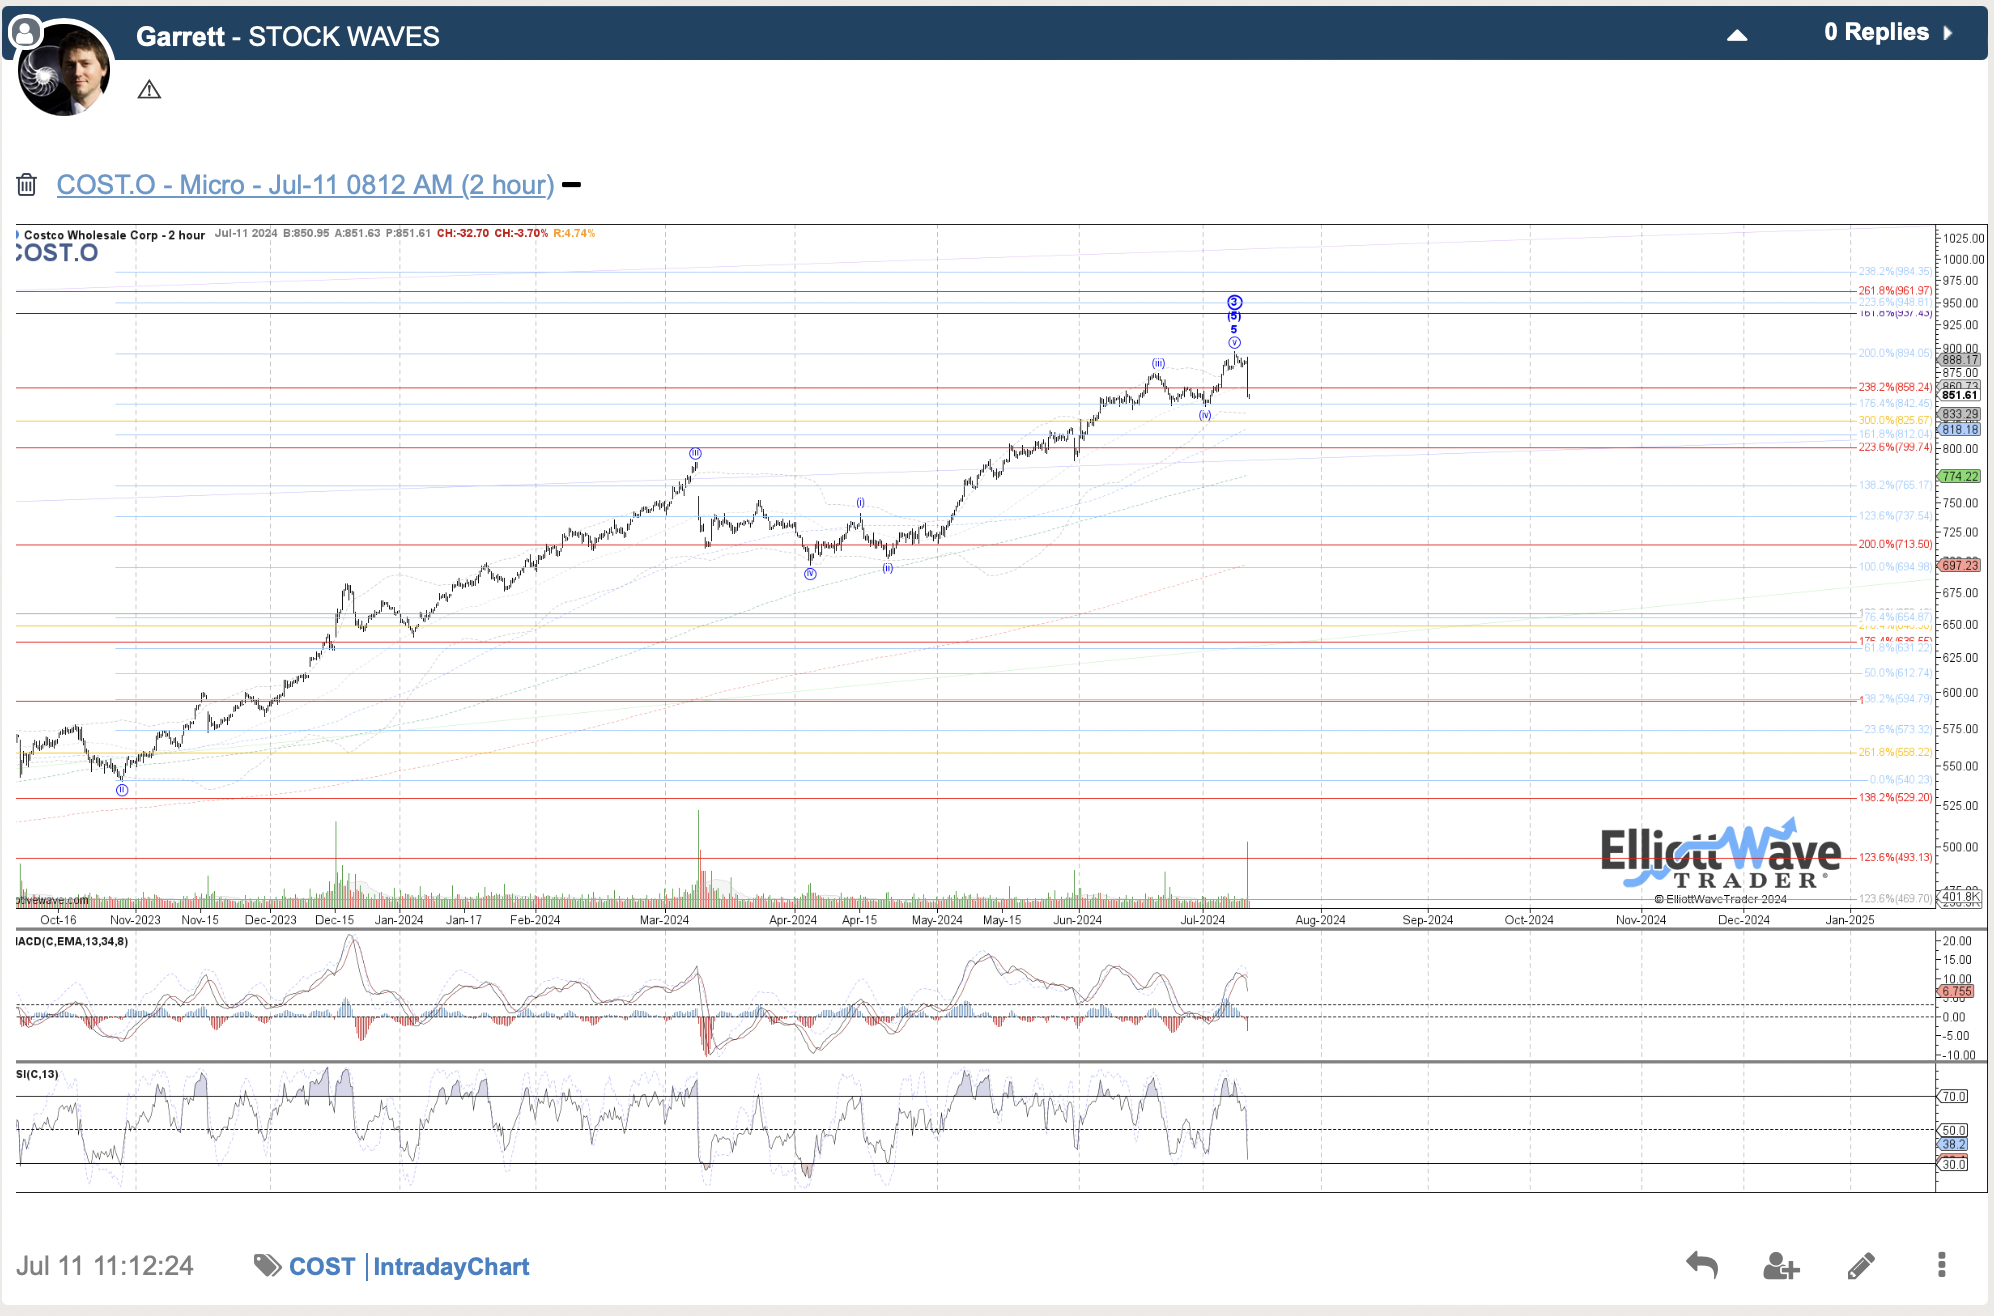
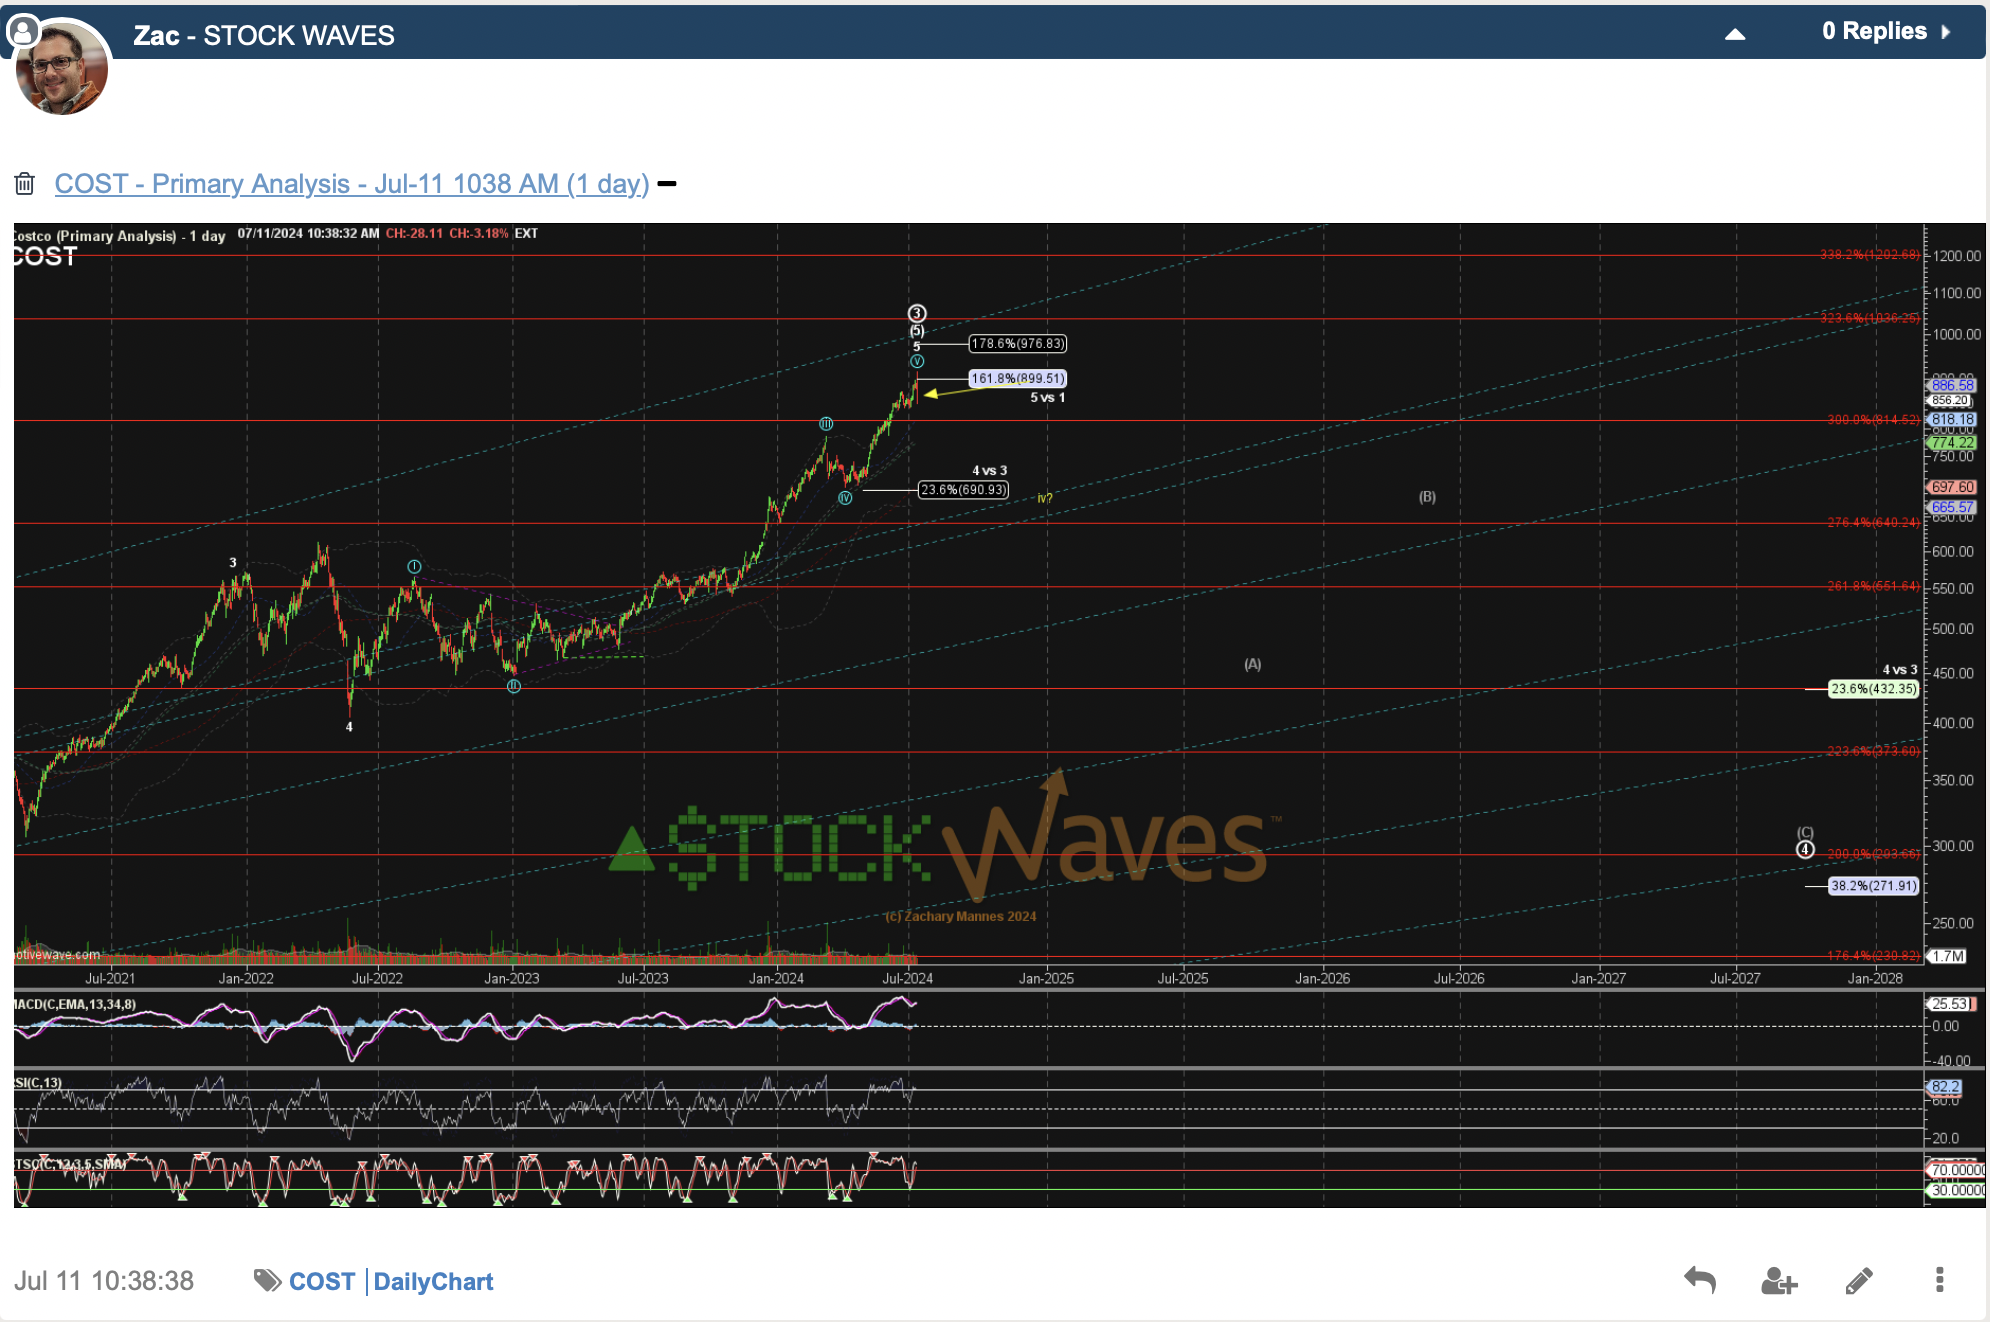
Here is how we in practical terms can project the likely path forward for (COST). It all begins with the context of where we find ourselves in the larger structure of price. Note that on the very same day a month ago, Zac Mannes and Garrett Patten both put out posts with caution signs regarding (COST).
Why the caution? At that time it became much more likely that the structure of price had completed the highest probability portion of the upside. While there was not a specific bearish setup present, this was a moment to mind your stops and to protect profits if long the stock. Their collective caution warning garnered nearly a -10% move to the downside.
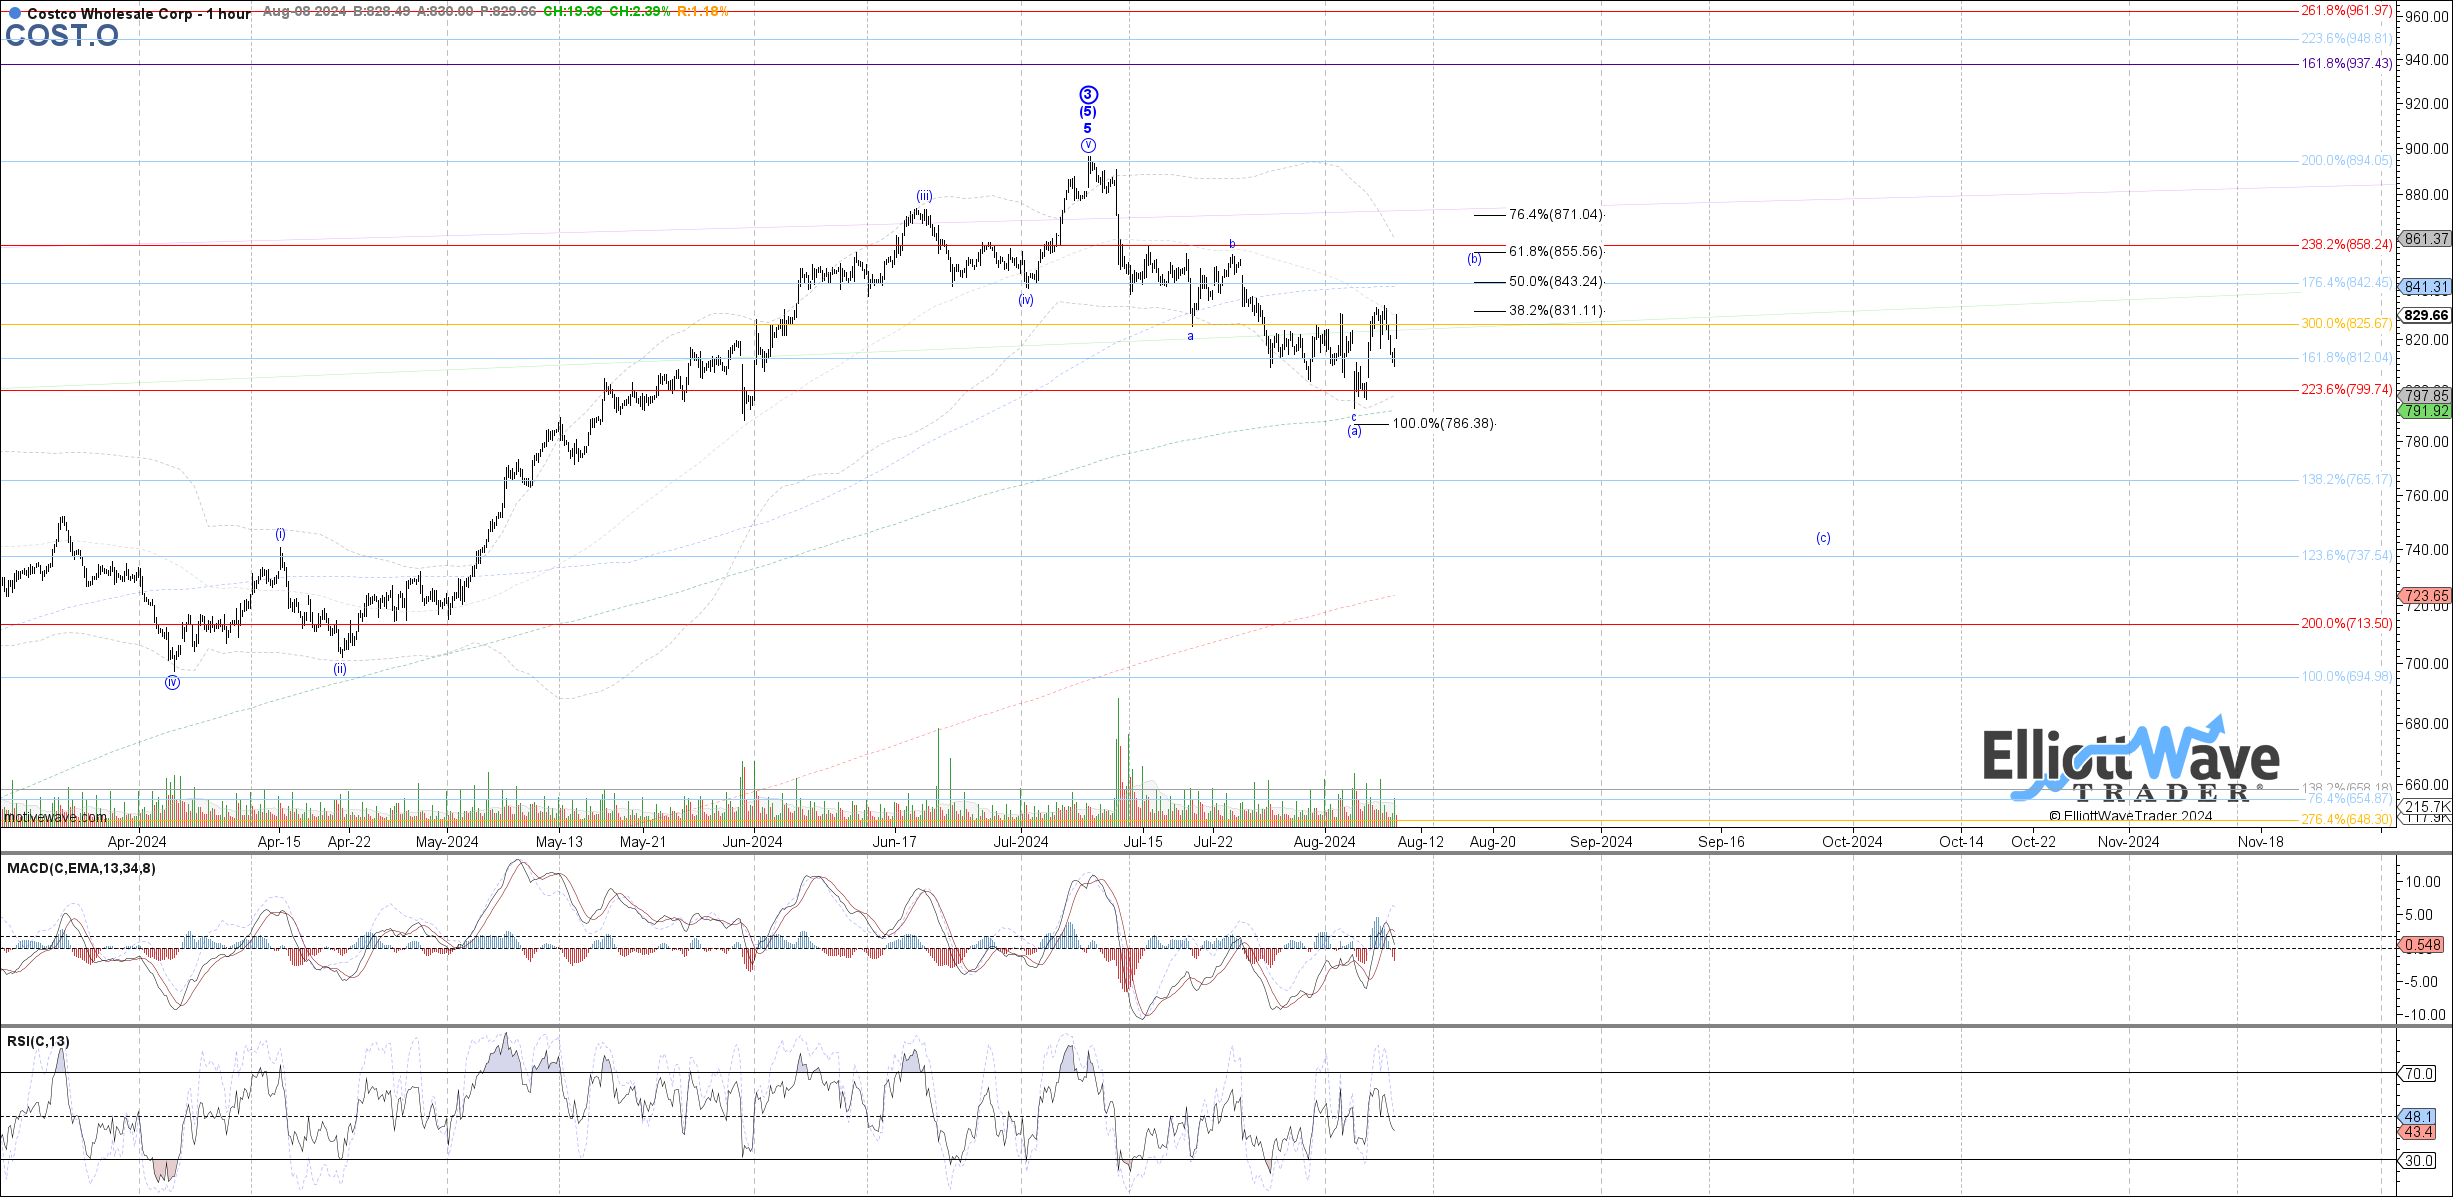
Now we fast-forward to the current. Note how a corrective bounce is likely and that, once complete, there is likely to be a down leg that takes price to perhaps even the $750 area.
What Would This Higher-Probability Bearish Setup Look Like?
Once the bounce in [b] completes, there should then be a micro 5 waves down and a small 3 wave corrective bounce. This would then suggest a bearish setup to complete the [c] wave as illustrated on the chart.
Should that micro 5 waves down form, then any bounce that stays under the high struck in [b] could provide a bearish entry with an invalidation of that scenario at the [b] wave high.
These are the types of setups that we attempt to identity for our members in both upside and downside types of chart structures. Of course, setups are not certainties and projections are not prophecies. However, we use standards that have been established through years of thorough study and careful observation. These standards help keep us on the right side of the market and tell us when our primary scenario needs revision or may even invalidate.
Don't Be Turned Off By Misapplication Of This Methodology
Obtaining a true understanding of this methodology takes time and effort. For those willing to invest in said effort, it pays off immensely. Those who are turned off by the words "Elliott Wave" typically have come across those who misapply the theory or are not willing to devote the requisite energies needed.
Our methodology is pointing to the potential for a low-risk, high-reward bearish setup for Costco stock. Not all paths will play out as illustrated. We view the markets from a probabilistic vantage point. But at the same time, we have specific levels to indicate when it's time to step aside or even change our stance and shift our weight.
There are many ways to analyze and track stocks and the market they form. Some are more consistent than others. For us, this method has proved the most reliable and keeps us on the right side of the trade much more often than not. Nothing is perfect in this world, but for those looking to open their eyes to a new universe of trading and investing, why not consider studying this further? It may just be one of the most illuminating projects you undertake.

