Charts of the Day: XOP, NFLX, AMZN, FEYE, DISCA
 By
Zac Mannes
By
Zac Mannes
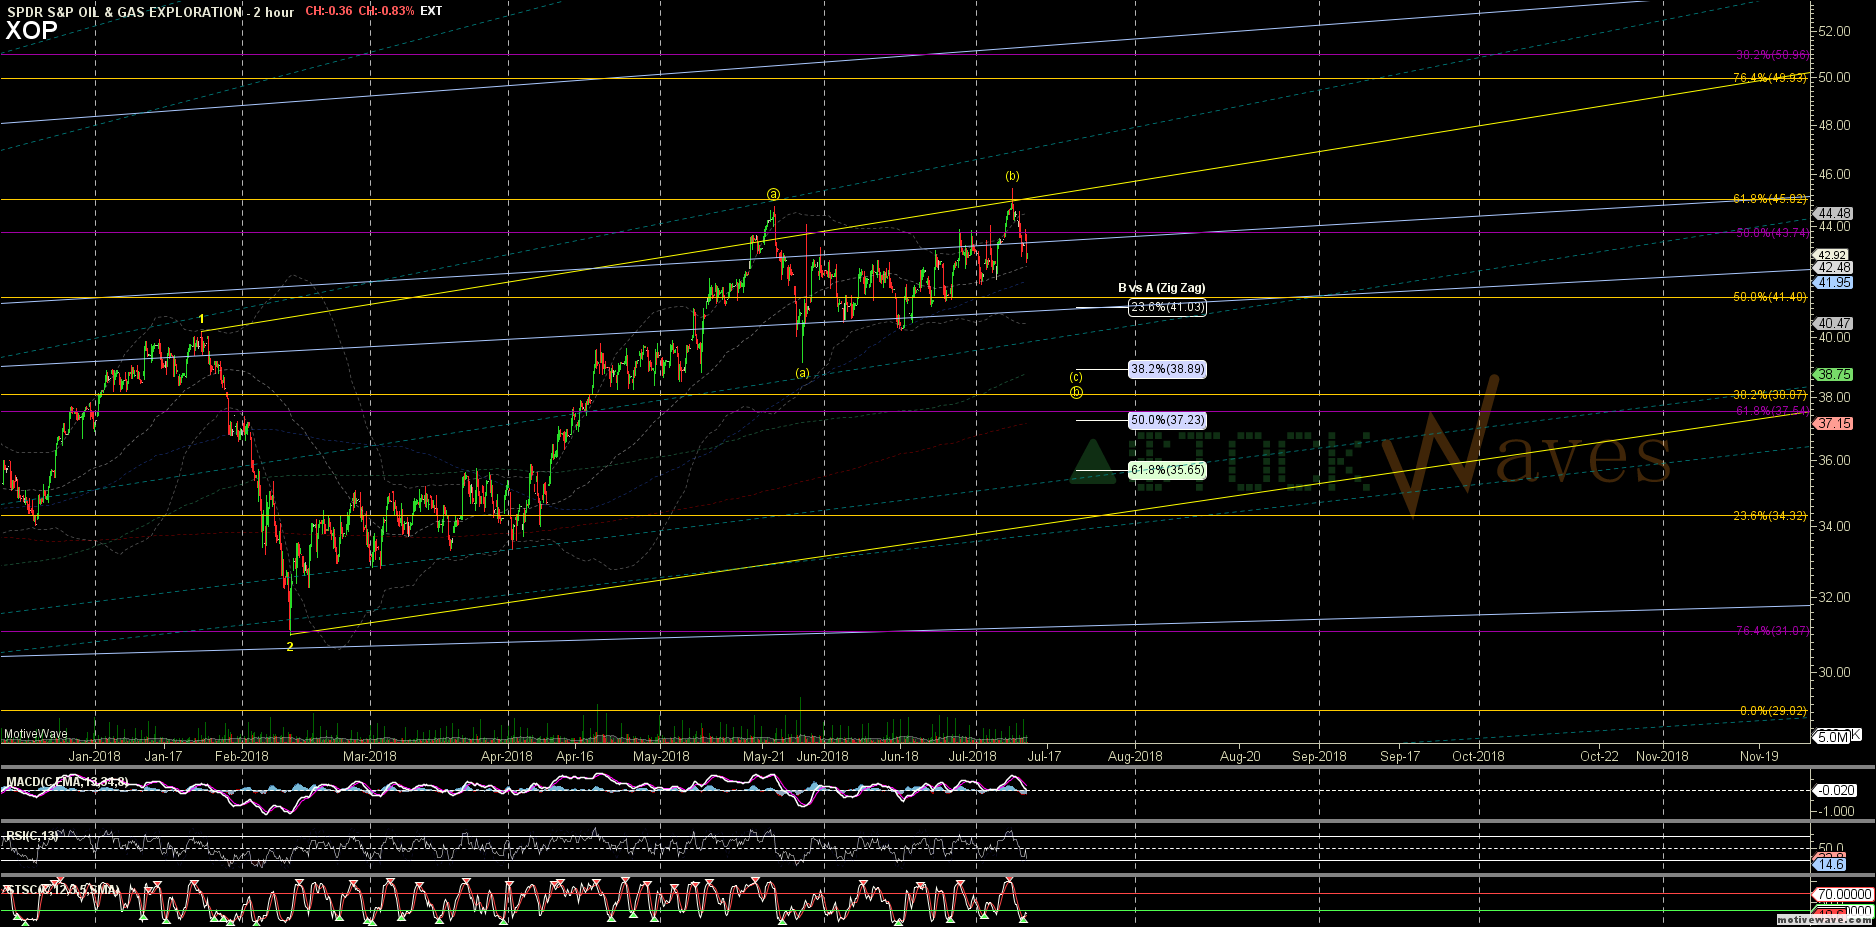
SPDR S&P Oil & Gas Exploration & Production ETF (XOP) appears to have completed its (b) wave on the chart, setting up for downside in wave (c) towards the May low below $39, with a possible retracement extension to just above $37.
The pattern looks very similar to Energy Select Sector SPDR ETF (XLE), but appears to have a little more downside potential here, with XLE expected to hold in the $72-73 region on its wave down.
The (c) wave down should open up opportunities for those looking to be long energy as we expect a continuation higher into year-end.
Netflix, Inc. (NFLX), which was up Wednesday despite the market sell-off, is in a micro wave up in its pattern off the July 2 low, with this up-wave pointing to $454-60 region.
This is part of a larger, ridiculous extension that the wave count is showing towards the $660 region in the first half of 2019.
Similarly, Amazon (AMZN), which was up 2/3 of a percent in a down market, has a micro wave count pointing initially to around $1900.
We do want to see AMZN hold the $1715-$1700 support region, or we start to get concerned about an alternative wave down to test the $1600 level.
Another chart that was up today despite the market is FireEye, Inc. (FEYE).
The stock recently held its .618 retracement level, and has turned up nicely in recent weeks.
The first wave up in its expected 5-wave move should get it to the $18-$19 region next.
We're also tracking Discovery, Inc. (DISCA) in our video today, whose wave counts point to a robust long-term trade, though short-term with a leg down in the market it could first see $26.