Case Study Of Applying EW and Fibonacci Pinball
 By
Zac Mannes
By
Zac Mannes
FND is a name that we have been tracking for a while in our Stock Waves 300 list. It makes for a great case study on EW (from a counterintuitive perspective) as well as how we apply Fibonacci Pinball expectations.
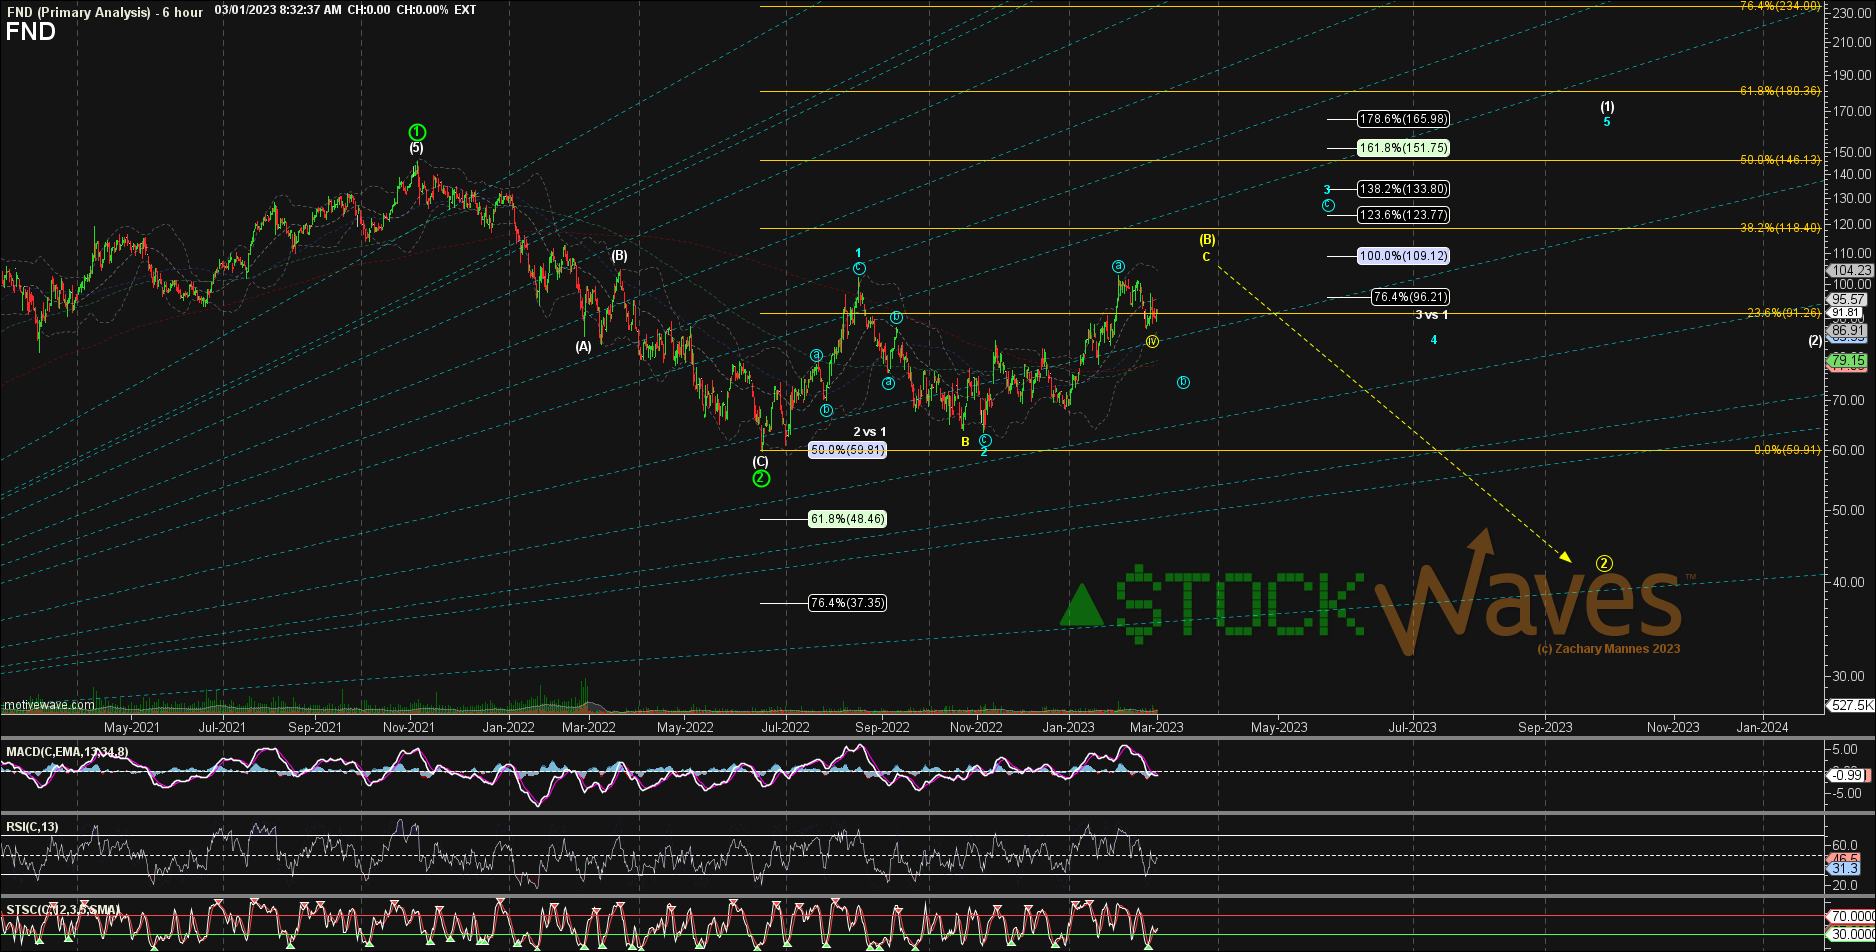
FND gave us a solid 5 waves up off the March 2020 low.
It then retraced as a larger (A)(B)(C) to the 50% Fib as a possible Primary 1-2 (shown in green).
The move up from there has been ambiguous, but since the wave 2 (in blue) was so deep, a leading diagonal (LD) for the wave (1) — in white -- is the only bullish sub-wave count that makes sense.
Here is the counterintuitive part and the application of FibPinball in an LD:
1) If this is part of a bullish LD for wave (1) of P.3, it needs to go DOWN more now as a blue b of 3.
2) Heading UP here to 109 region would count instead as a yellow wave v of C of an alt (B) in a much wider and deeper Primary wave 2 (if that holds at all).
3) We know from Fibonacci Pinball, which helps us better pinpoint the 3rd wave sub-waves once waves 1 and 2 are in place, that the "a" of 3 in a diagonal should stop at either the .618 or the .764 and this "a" got past the 96s.
Normally, overshooting this a little would not be as much of an issue, but the pattern fits the expected subwaves of the yellow (B) count better, and with the larger market context of a probable (B) wave topping, it leans even more to the yellow (B) as well.