Can We Get This Over With Soon?
 By
Ryan Wilday
By
Ryan Wilday
Short-term Outlook:
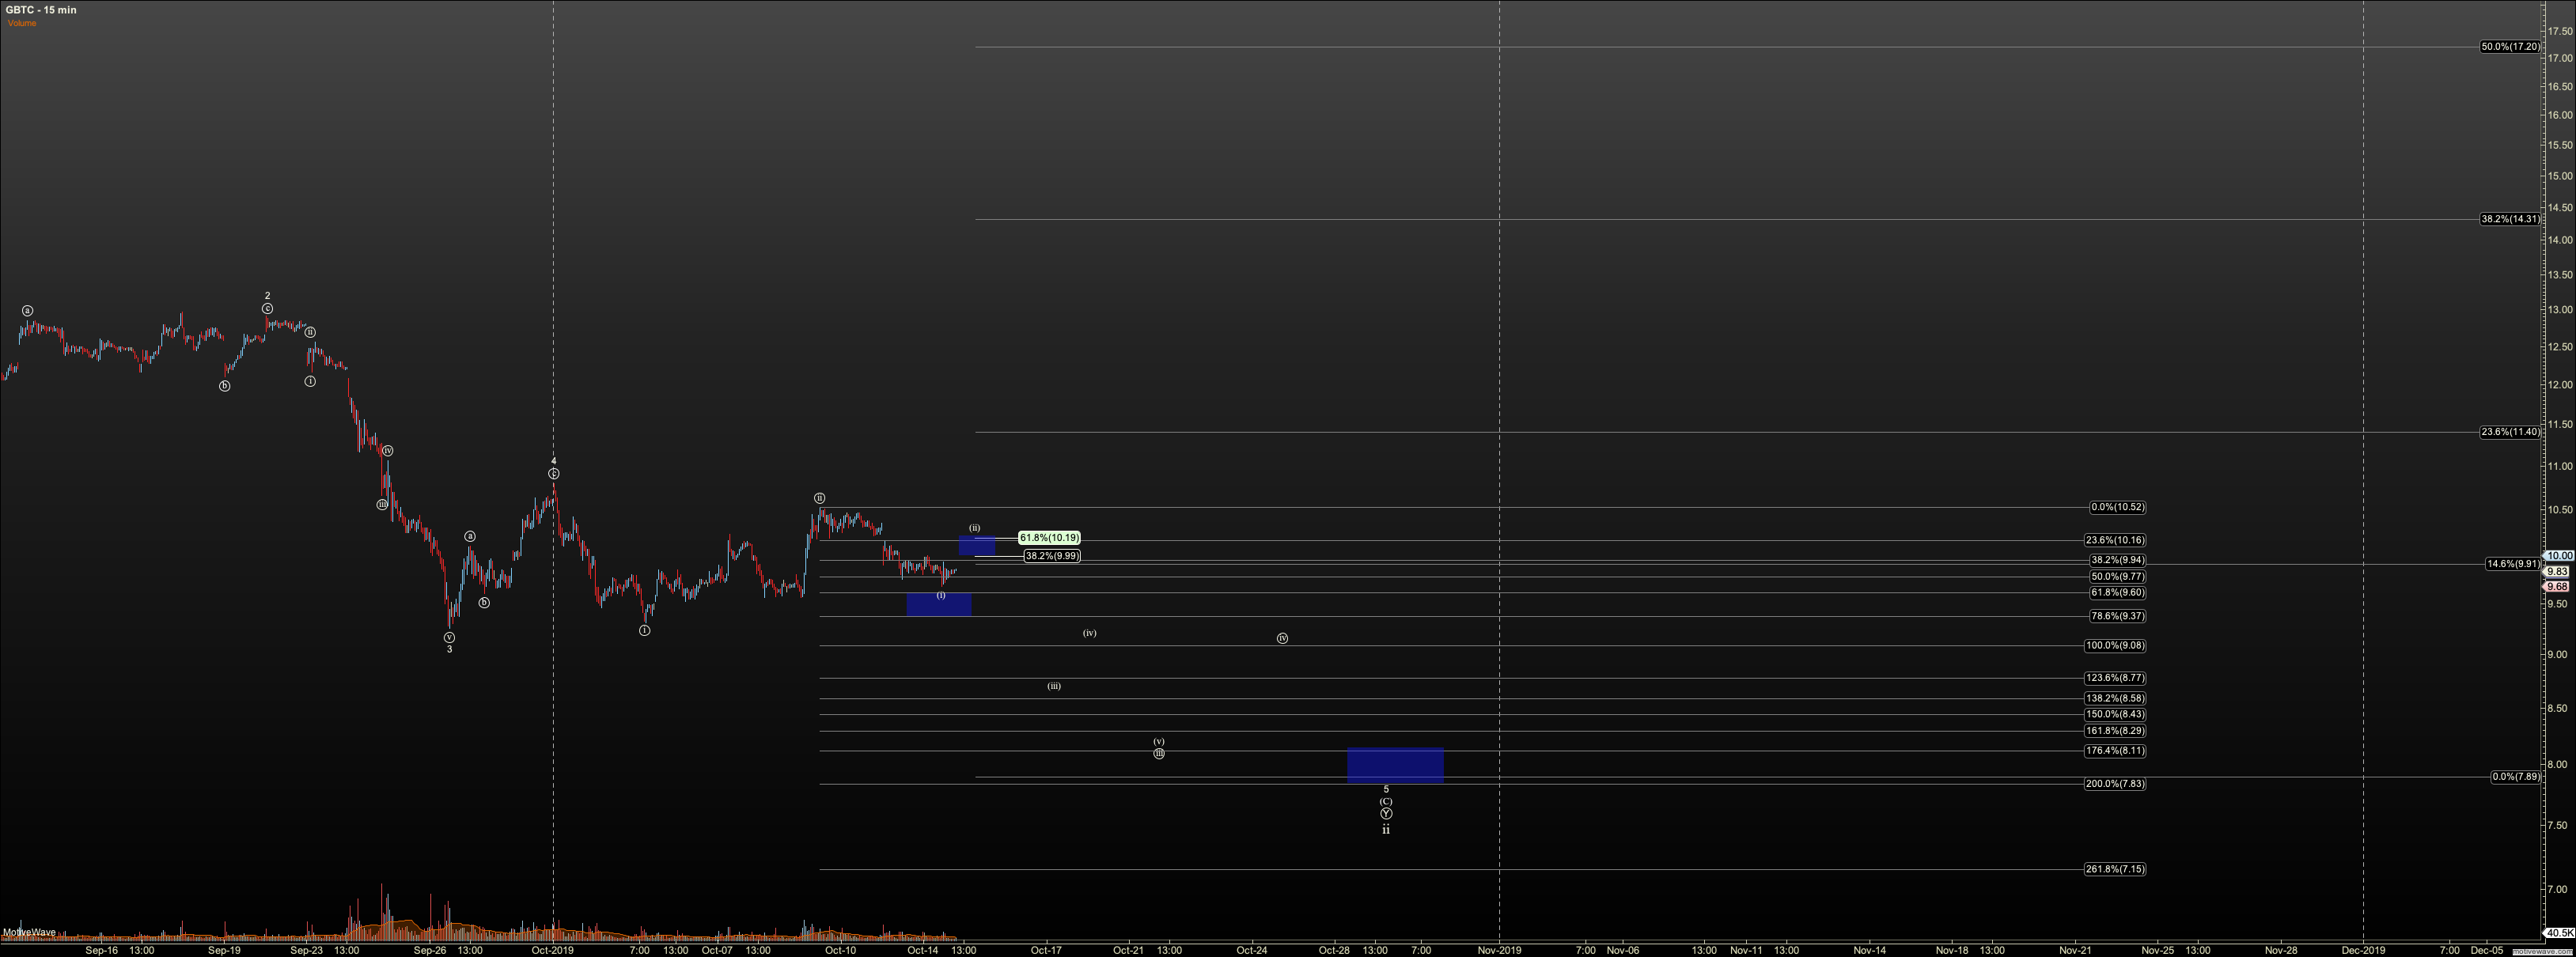
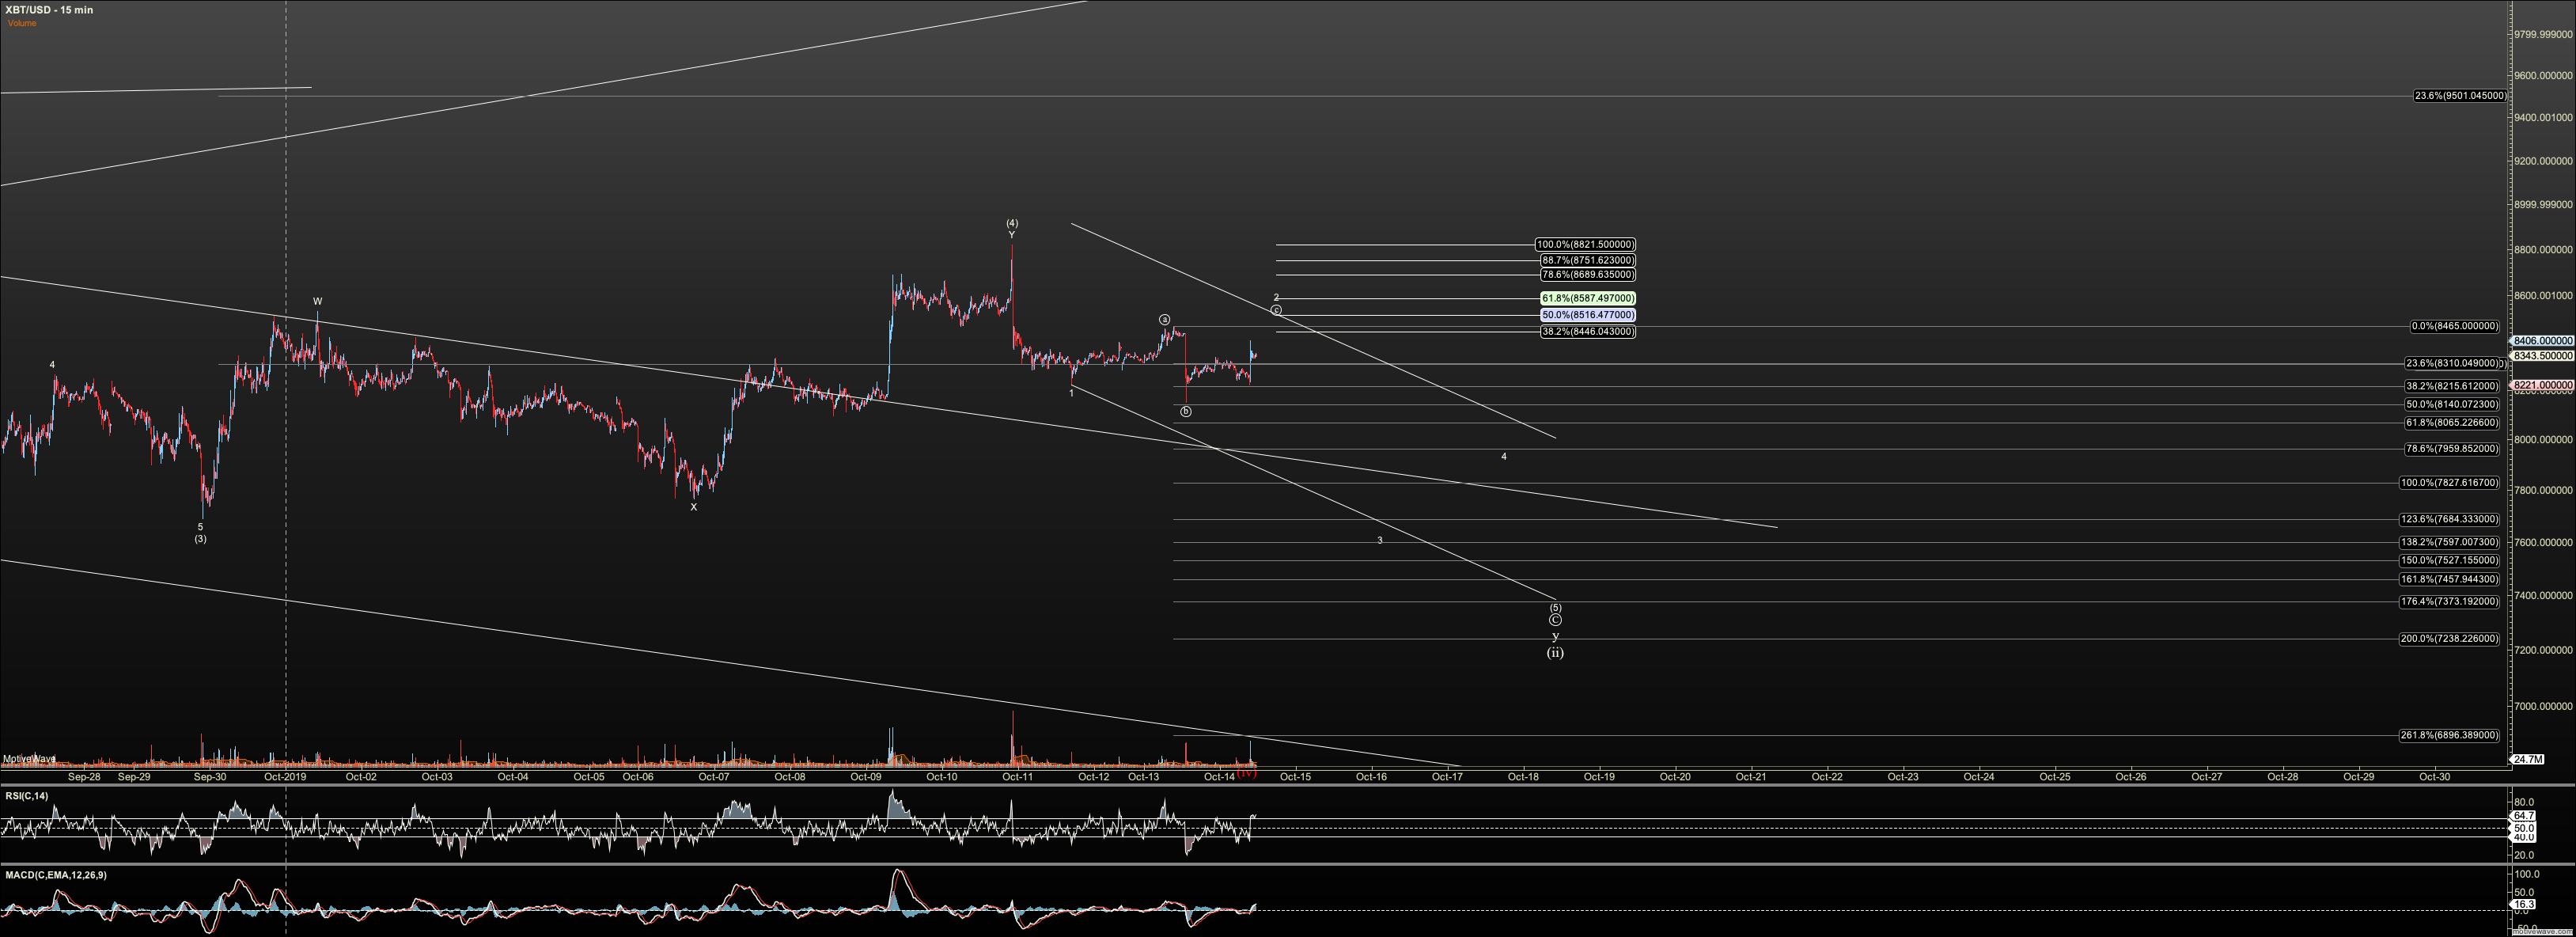
My title refers mostly to the coin charts as GBTC is behaving as expected. We are simply seeing three wave drops that fall short of a full impulse. Today is an example with BTC dropping in three waves last night, and working on an impulse back up. Either we are going down in a diagonal, with an ABC structure in the third, or we simply bottomed in a deep B wave and wave 2 is still in progress. The latter is pictured.
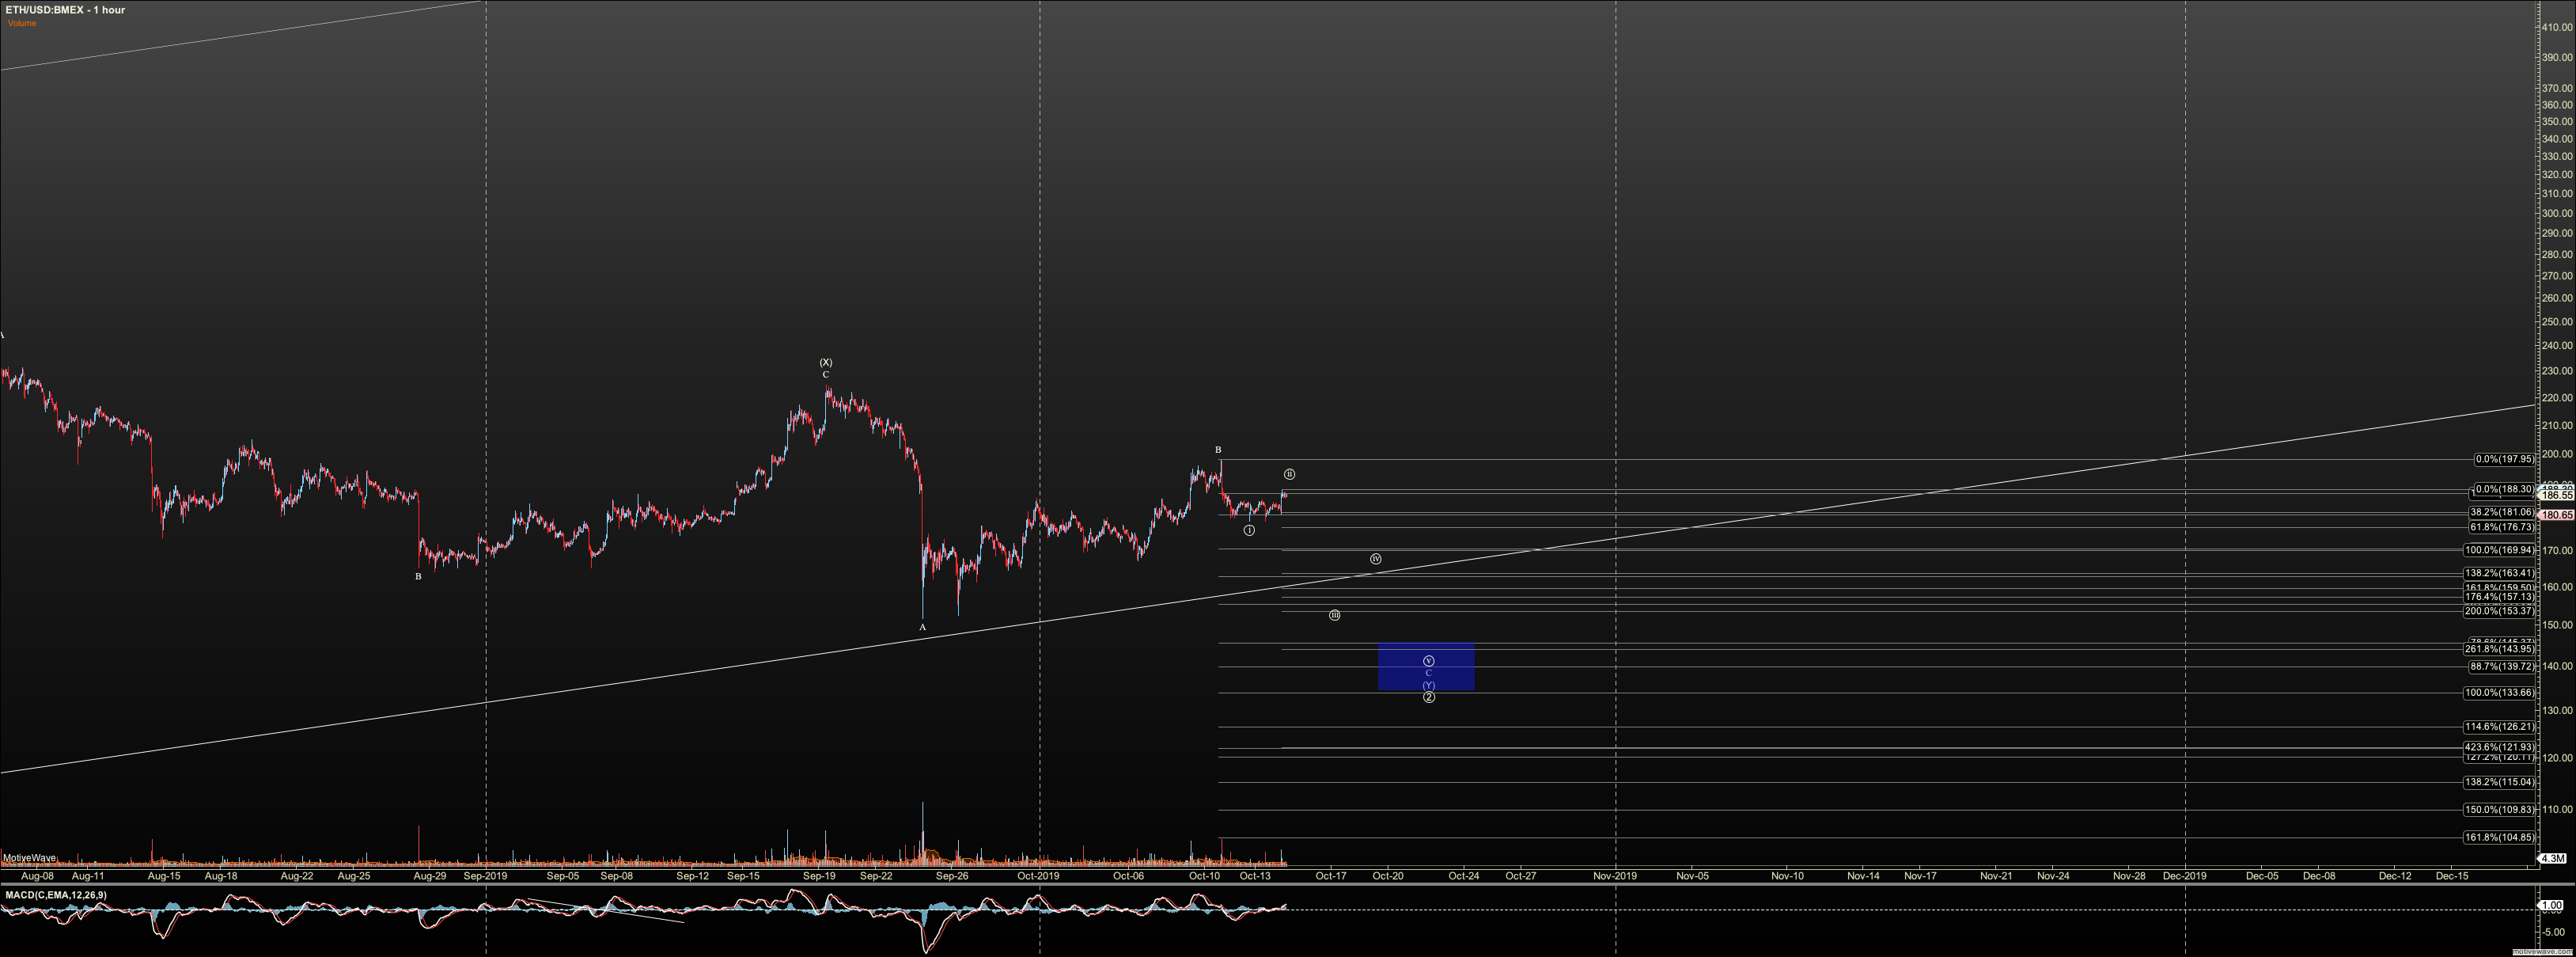
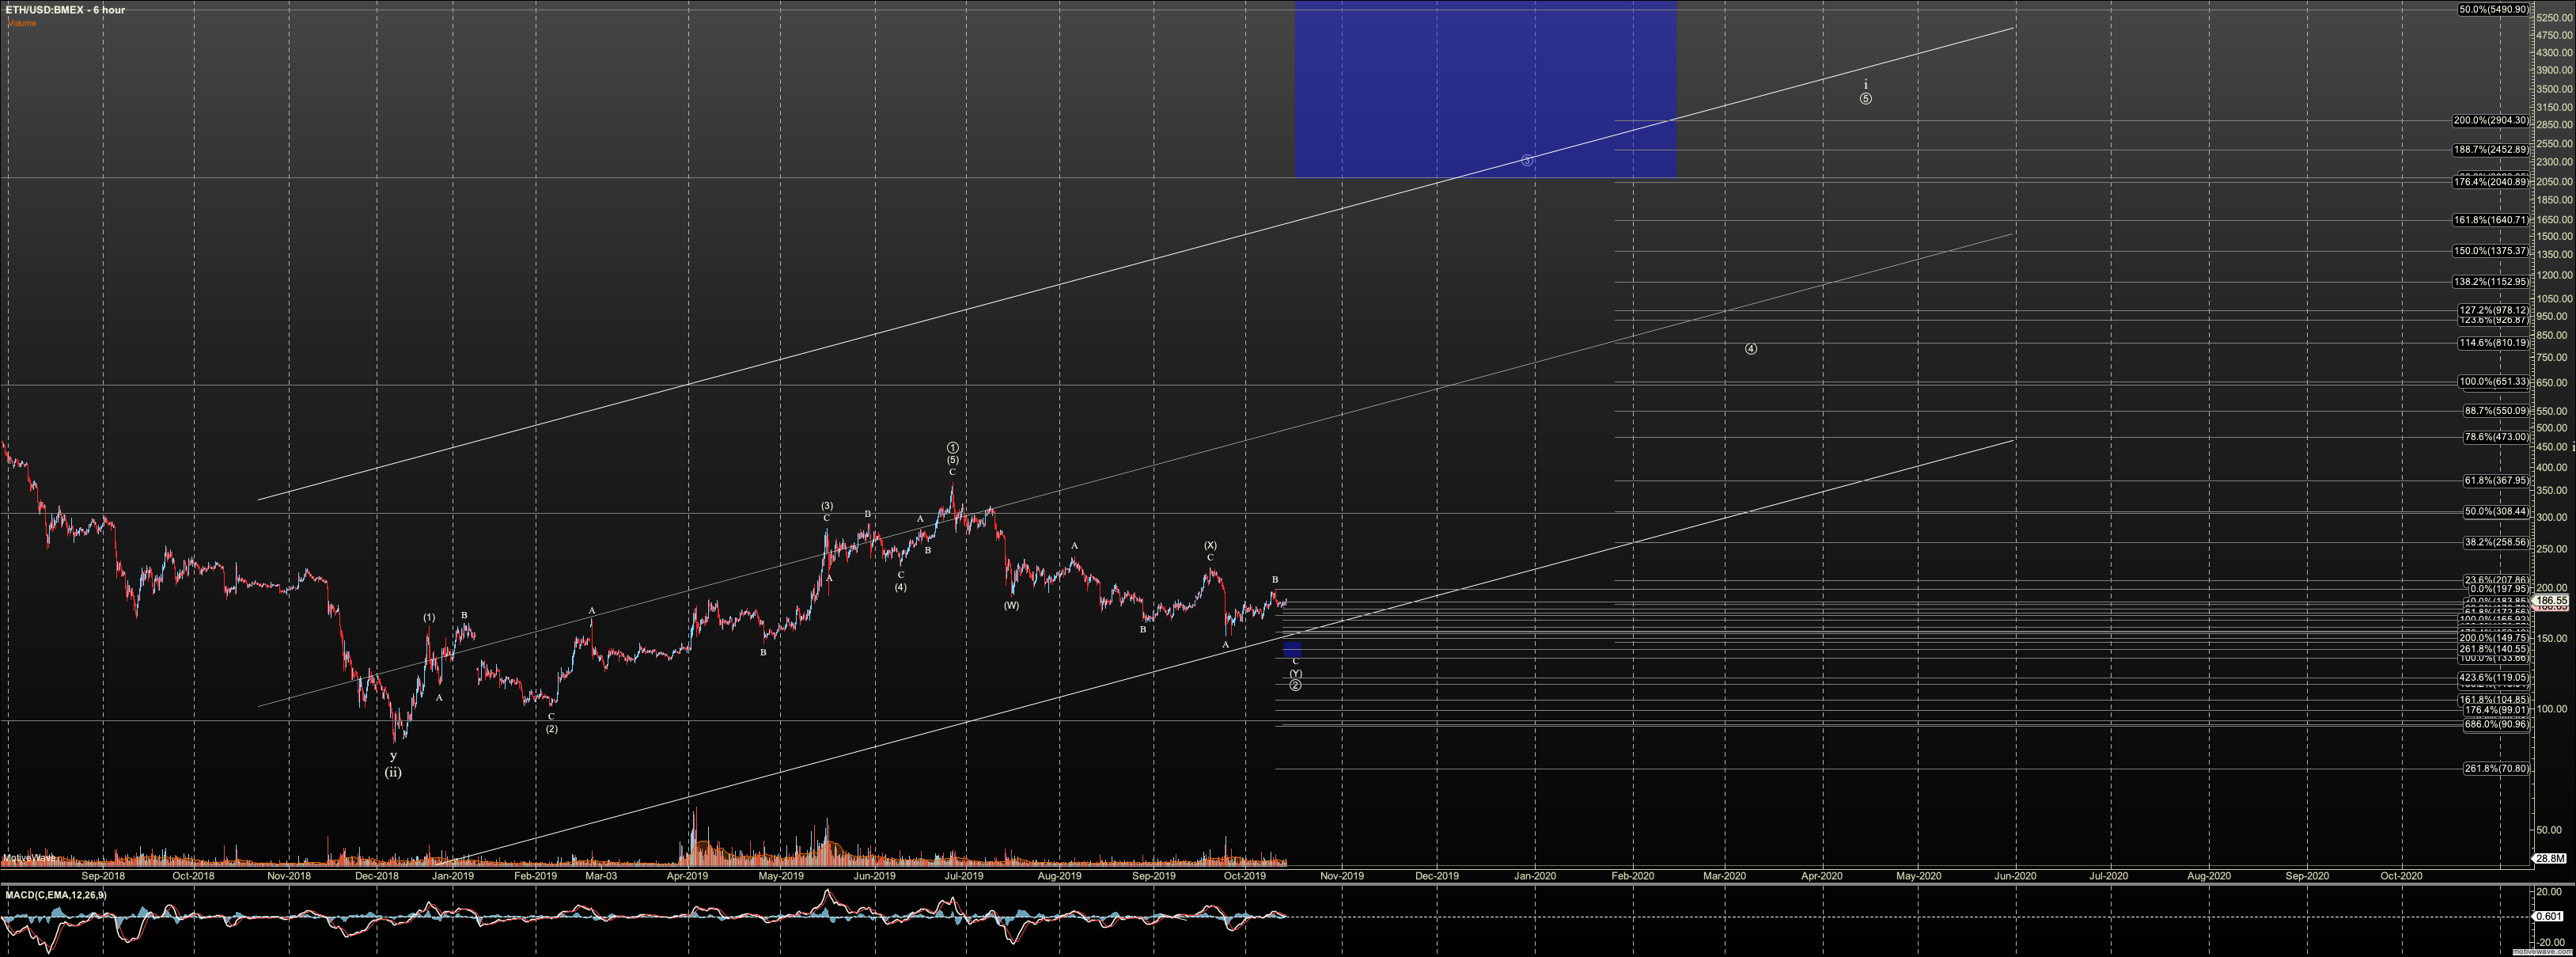
Though ETH is still fighting off downside, I have taken red count off. Unless we break over $198 I just see little reason to bring it back.
GBTC hit the pivot region and appears to have bottomed in a very ideal wave 1 of three. I would have loved to see a gap down, but we are still setup nicely for an impulse down.
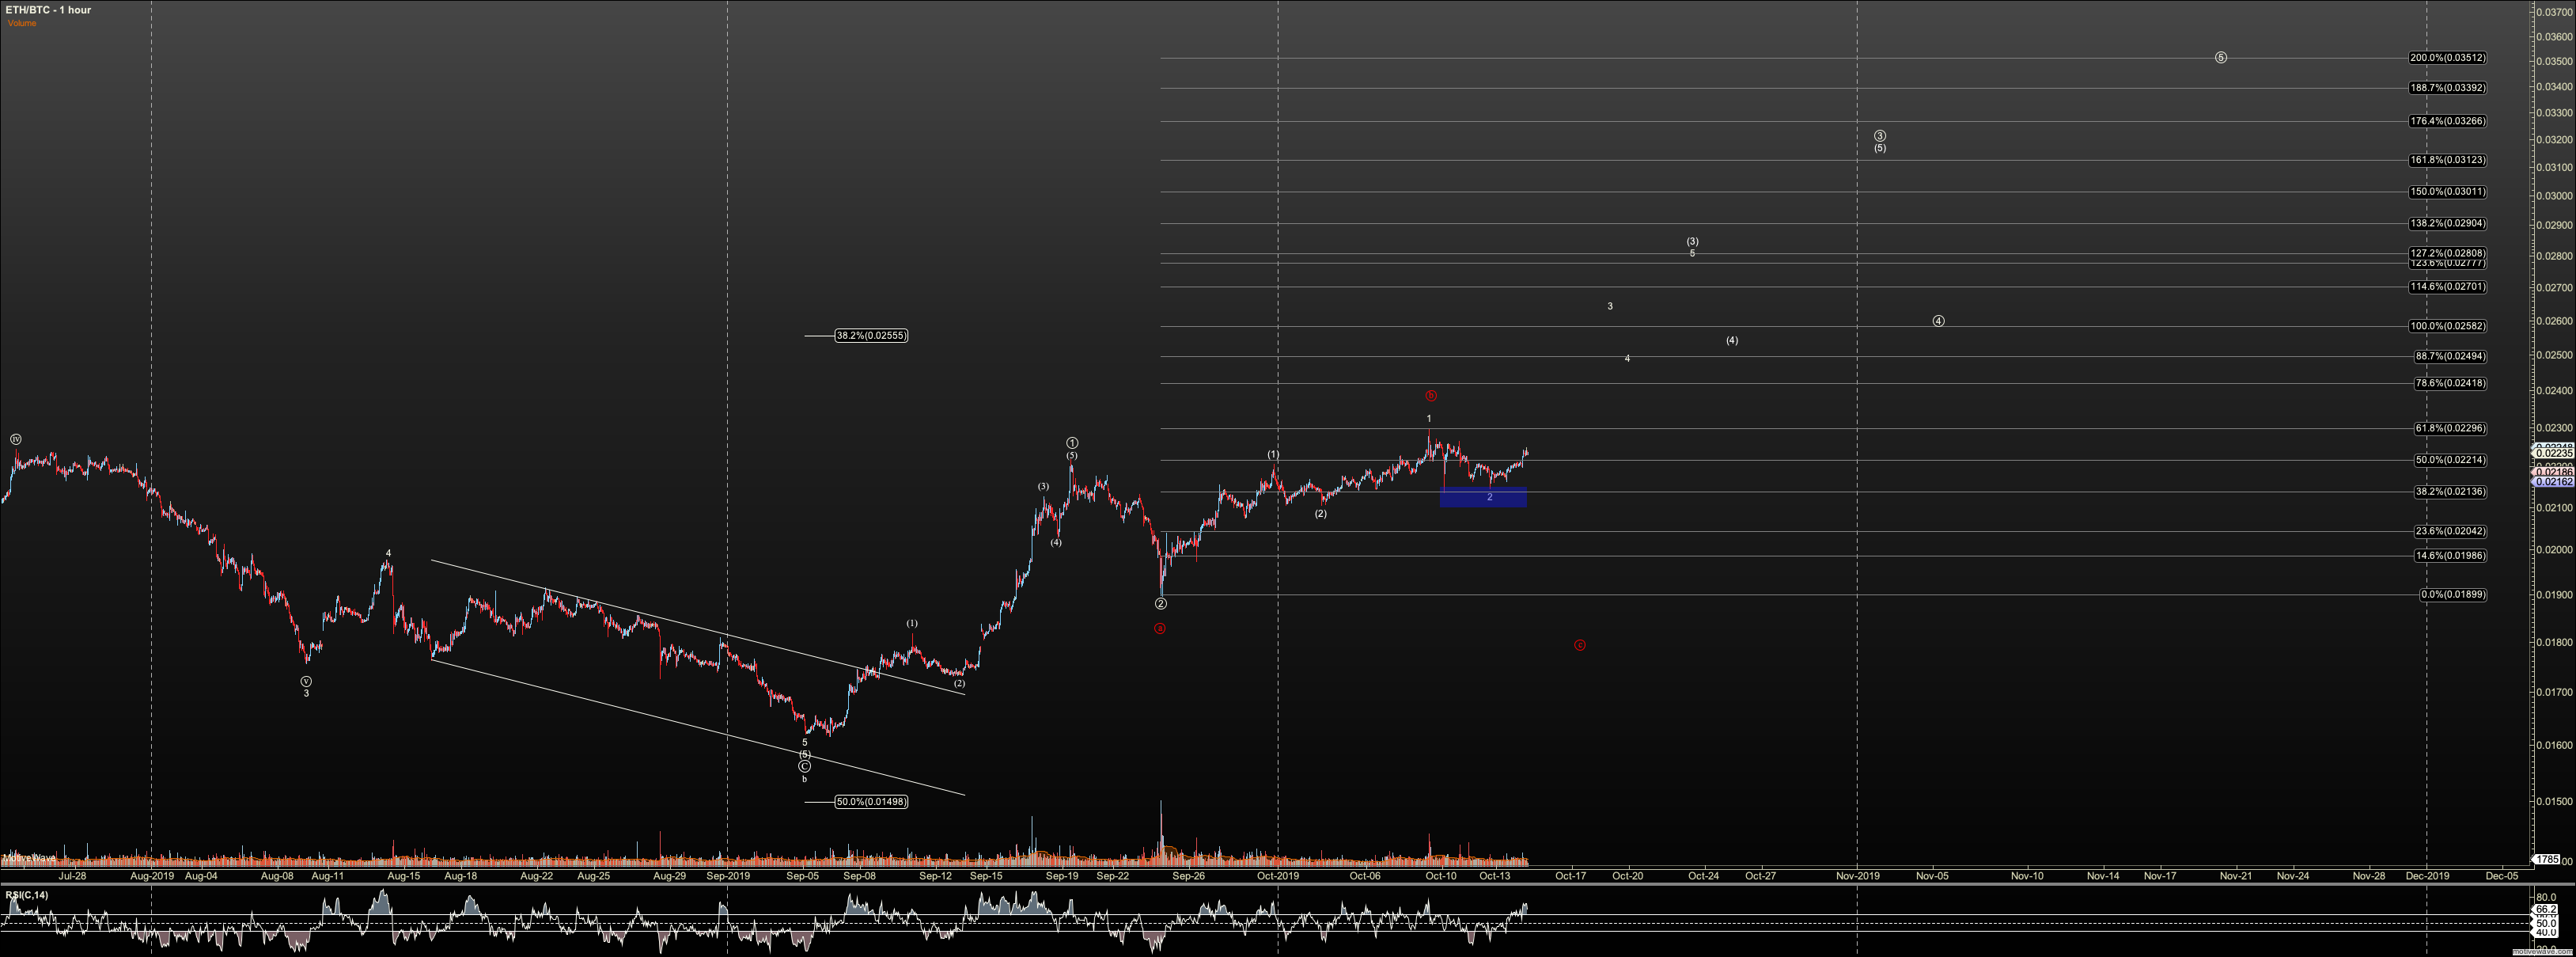
ETHBTC is progressing nicely. I'd like it now to stay over the bottom at .0215. That's only a small notch higher than my .012. Below .0215 I see the red C as increasing in probability.
Intermediate-term Outlook:
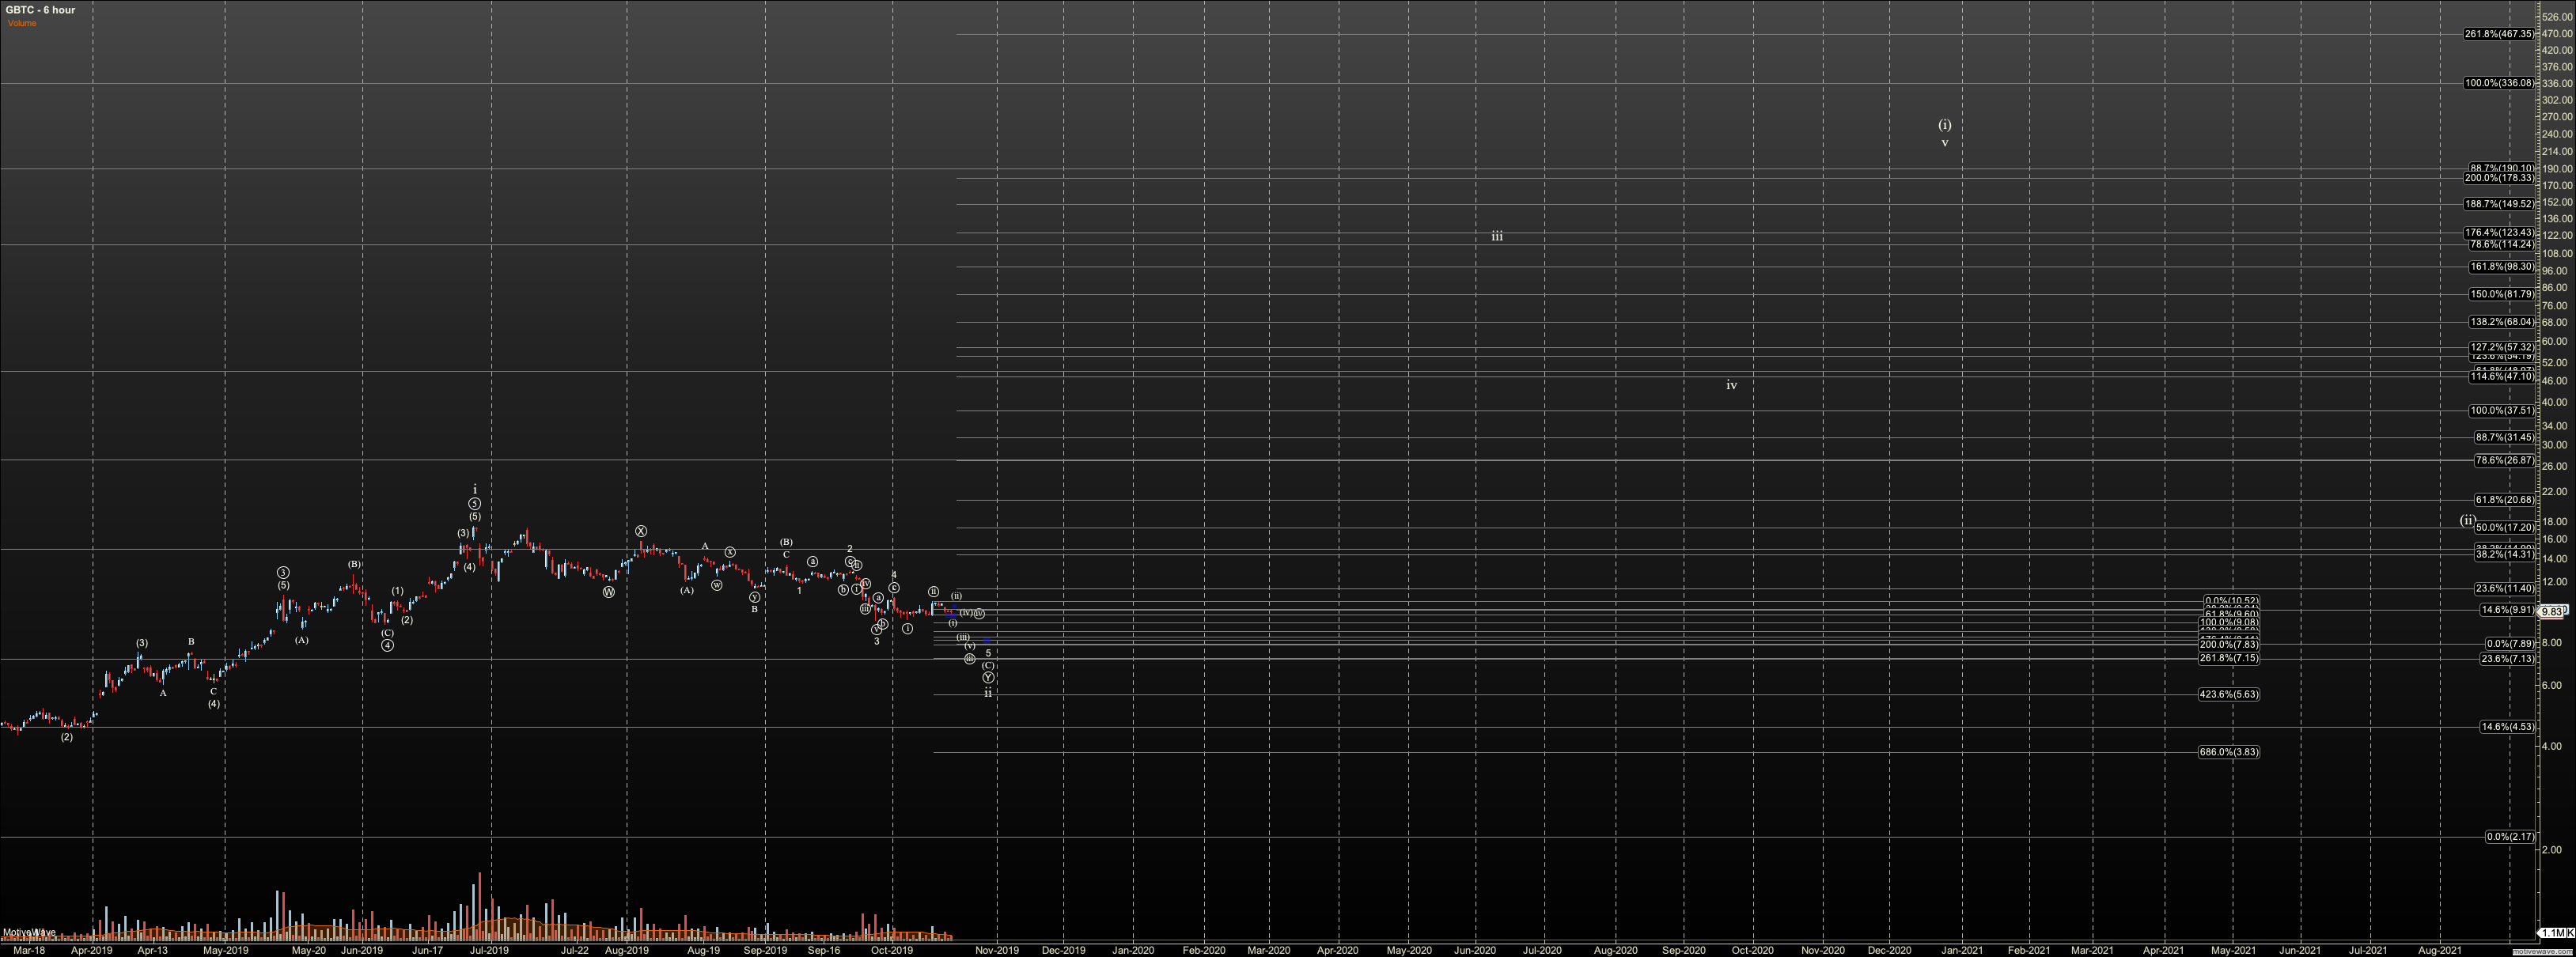
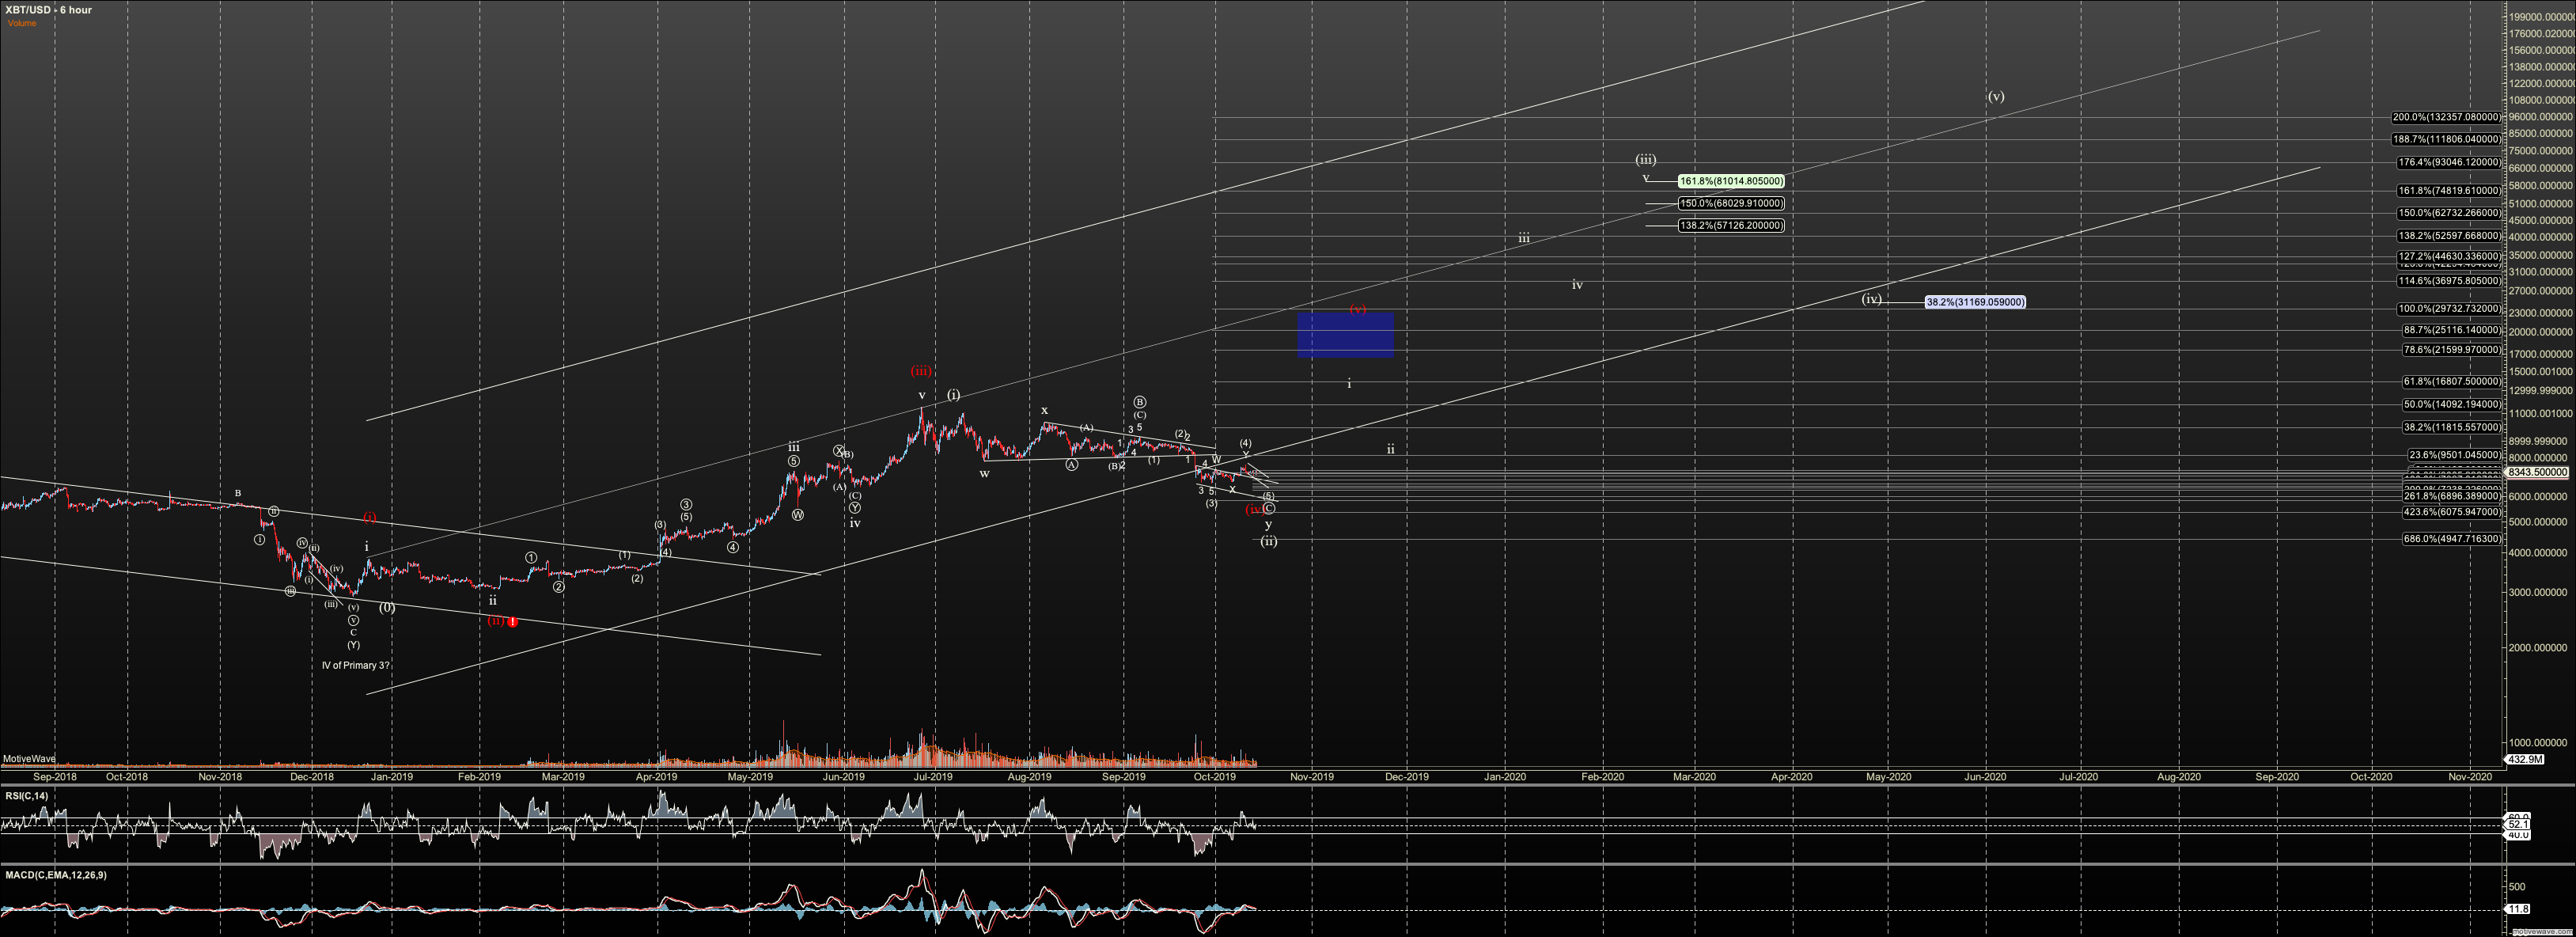
Regarding intermediate term, Bitcoin put in a strong bottom at $3120 which aligns with the long term support for my primary count, at $3000. Holding there suggests good probability that we see a run to $65,000 - $225,000. The current correction is primarily viewed as a wave two correction, which has support at $4300. We may never see that low, and the current leg of this correction targets $8,400 to $7,800. If we see an impulsive rally in that zone, though this is considered a shallow wave two, I will look forward to a completing a larger degree pattern potentially to between $129,000 and $160,000. By this we see how the smaller pattern refines targets for larger pattern.
The alternate intermediate view is that this is merely a wave four. In that view, the next wave, to the $20K’s may terminate the 2019 bull with a nominal new. Although, it is remotely possible we hold for a higher degree which will be discussed when important.
Note that timeframes is not a given. I am putting labels in a very aggressive timeframe but that may not be what we see. What is important is these price pivots and how price interacts with them.
Ethereum did not hold my ideal long term perspective by $10 in the 2018 bear as it fell below $81, suggesting that the low was a wave 2, and not the wave 4 which was primary. This creates some questions about its future as well. Further, it opens the door to a much deeper wave 2 to $40.
For the 2019 rally, there is some question whether we have a five wave move. If so, it is a diagonal. $113 is the litmus test. Below $113 and risk is on that we see $40 . Currently the local correction which, if wave two of the larger wave 1 of our third wave, targets the $145 region. If we bottom there, the fifth wave suggests we hit the $3000 region before a higher degree correction.
Note there is discordance between the long term GBTC count and that of Bitcoin, because of its release to the public does not match BTC genesis. And, so the question in my mind is whether GBTC will see a large ABC, or a full impulse in the longer term. If I am strict to the impulsive view, GBTC can bottom in the $9 to $10 region, corresponding to the $8,400 to $7,800 bottom in Bitcoin. And, the rally in Bitcoin to $129K+ can correlate to a move to $220 target in GBTC. If we only see a C wave, we should not see GBTC rally higher than $85. Knowing which from this vantage point is not possible and we’ll need to see the market progress.