CSIQ: Sentiment Shines Brightly
 By
Levi
By
Levi
How do you value a company that is yet to be profitable? When there’s no ‘E’ in the Price-to-Earnings equation, other metrics must carry the weight. Yet, we must keep in mind that companies such as CSIQ are building for their future. So, the true valuation is placed upon them via what the crowd feels they are worth. Is that an exact science of any kind, or at least a reasonable facsimile of one?
If you have been following our work and setups, then you know that there is actually real science involved in this — and mathematics. Let’s look back at the original thesis for CSIQ that began some months ago when Zac Mannes began to feature this ticker as a potentially powerful setup into the end of this year.
Note here that Zac was tracking the end of a Primary B wave. Although quite nuanced, our work really is as easy as A-B-C and counting from 1 to 5. So, naturally, Primary C follows the B wave low. And, inside that Primary C wave there would be 5 intermediate waves. Since markets are variably self-similar across degrees of structure, we would also be looking for an initial wave 1 of the larger wave (1) of that Primary C rally. Here is Zac’s weekly chart from the summer of this year.
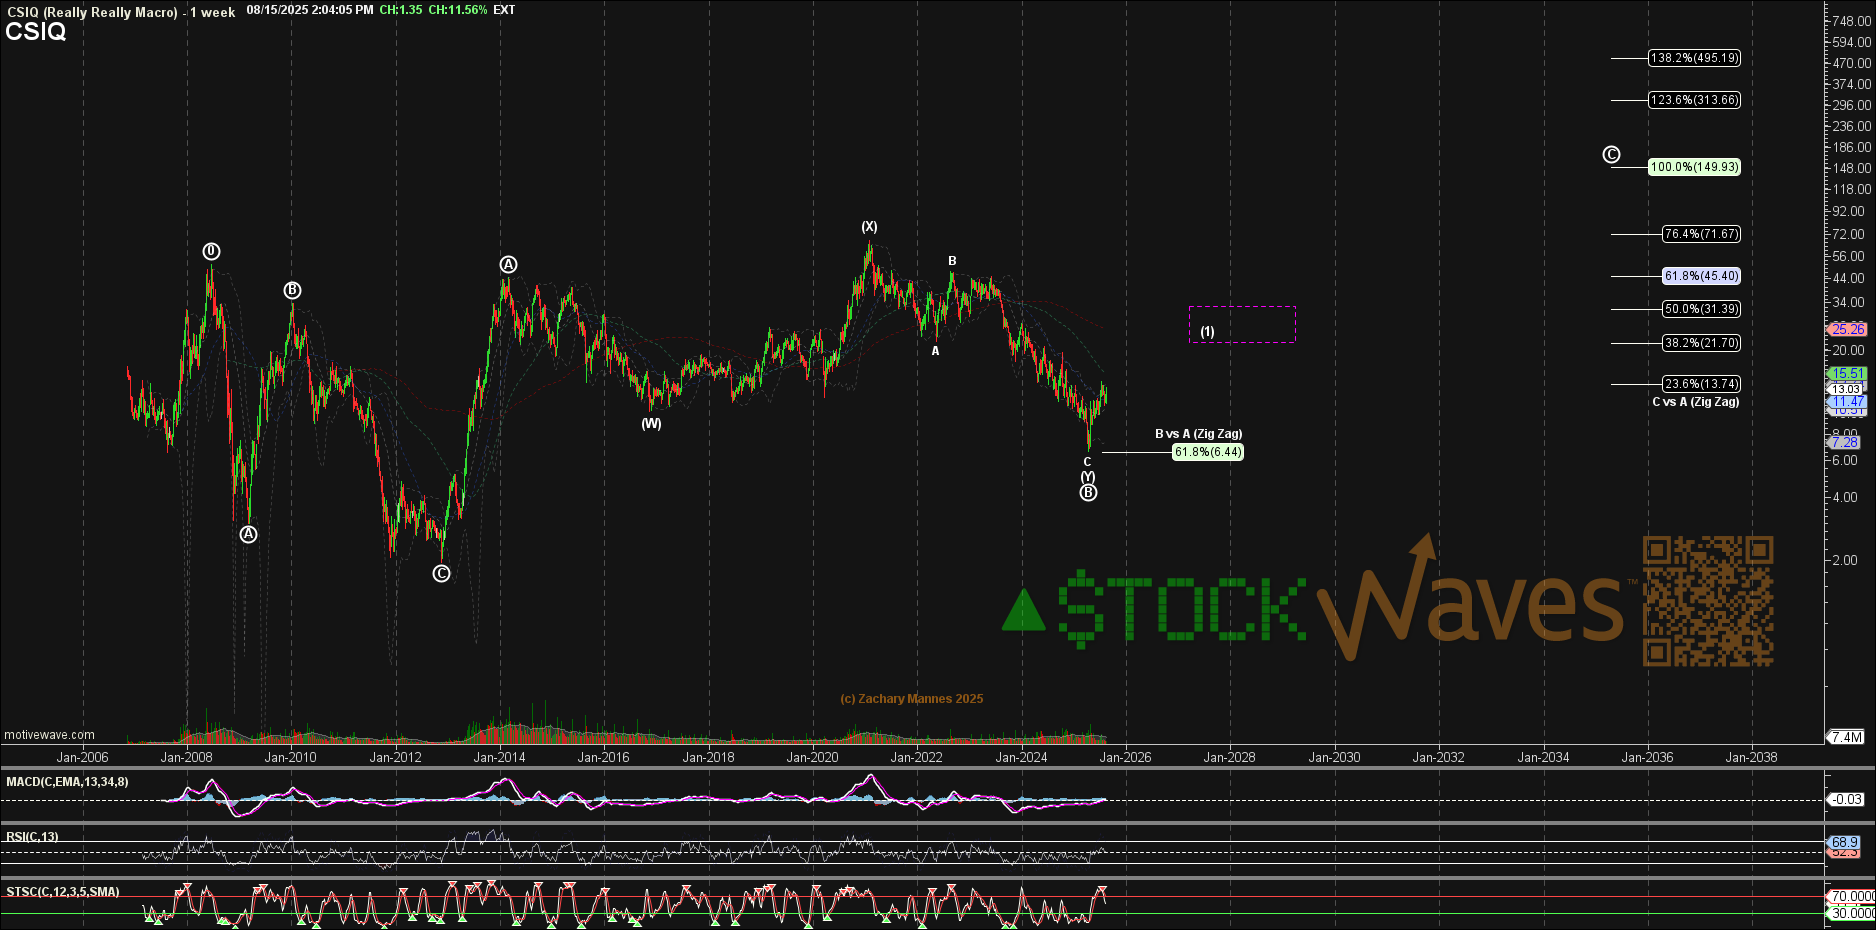
There you see the anticipated general target area for wave (1). As a brief aside, we had this as a wave setup back on September 5 with specific parameters for the near term. In the micro, that setup technically invalidated. However, that did not mean that we would give up on the larger pattern. In fact, the recent price action has further confirmed the primary path that is now en route. Let’s look a bit deeper into that.
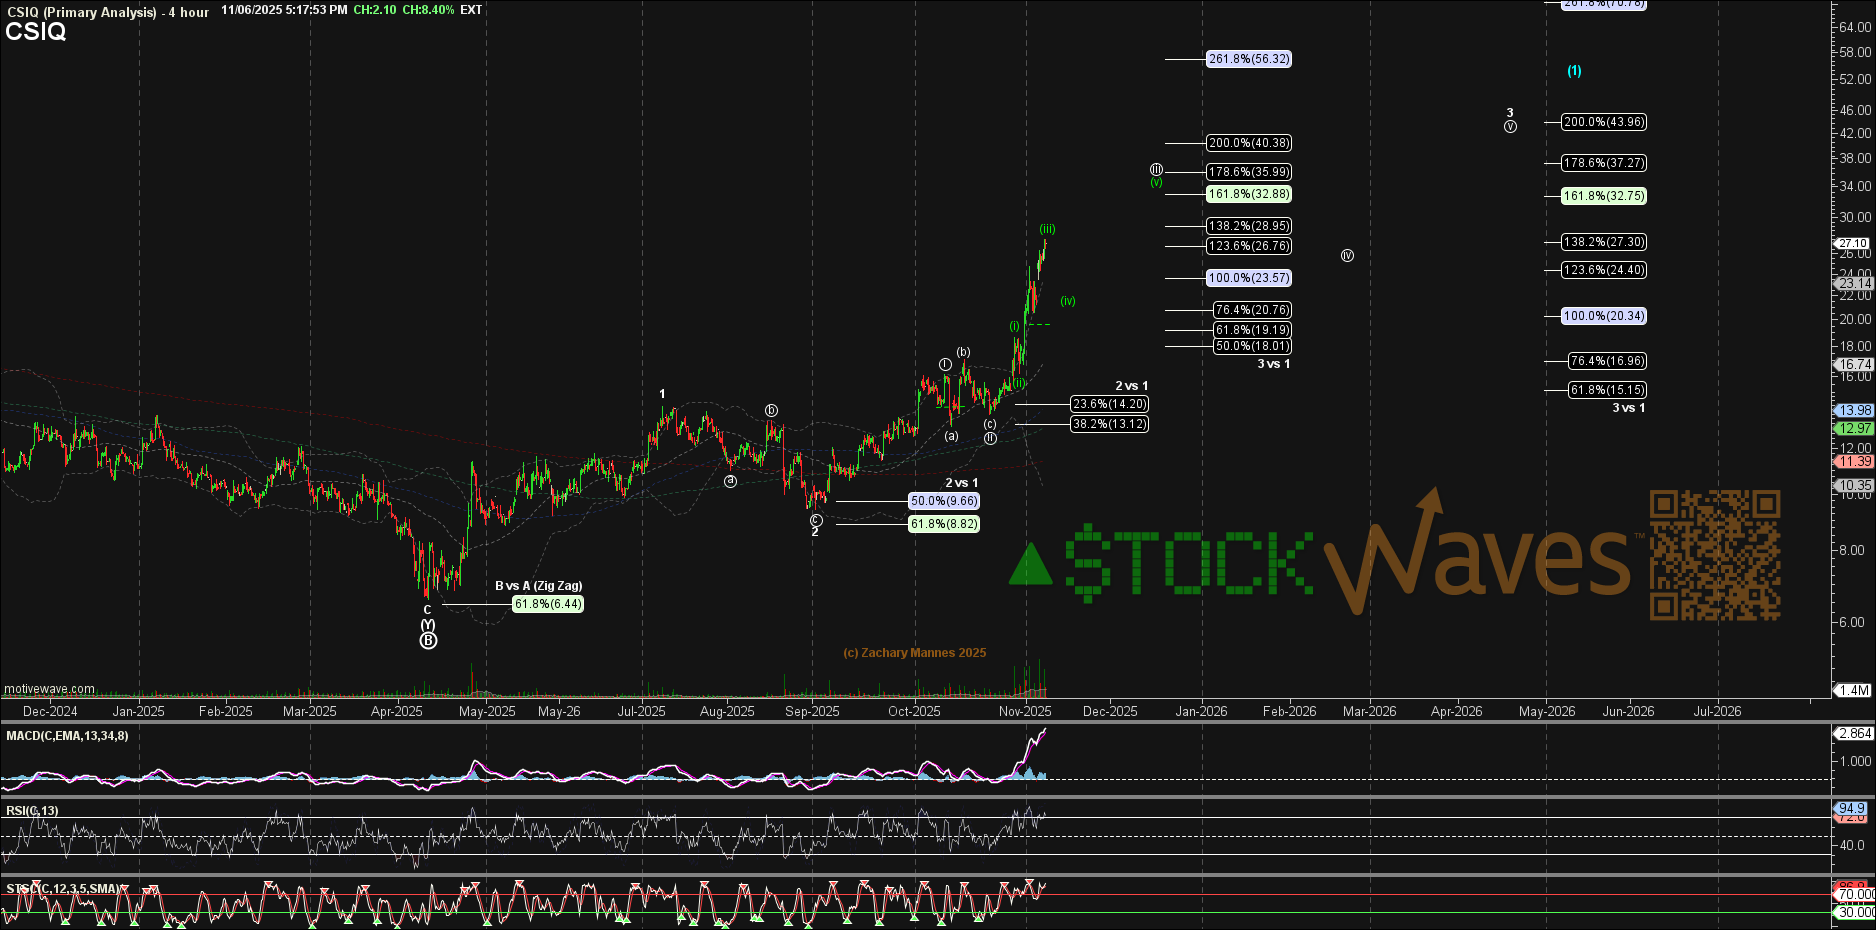
Speaking of shining — this is where Fibonacci Pinball beams. Price is likely inside the third wave of a larger 3rd wave — within the even greater degree wave (1). We now have clear parameters for additional validation of our projected path.
Wave (iii) of circle ‘iii’ of 3 of (1) is nearing completion. The pullback anticipated in wave (iv) should hold the .764 extension of the circle ‘i’-‘ii’ impulse at the 20.76 area. The next rally in wave (v) likely takes price to the 1.618 - 1.764 extension zone. Support would then move up accordingly.
As you can readily identify from the attached charts, we are smack in the middle of a third wave with clear support areas and target zones overhead. Sentiment is shining brightly here — it may just be illuminating the next powerful leg higher.
