
COF / WFC: A Dissenting Opinion
 By
Levi
By
Levi
On October 5, Morgan Stanley upgraded Wells Fargo & Co. (WFC) to Overweight, put a $102 target on it and named it a Top Pick. Not a routine nudge either. Wells had been the worst performing stock in their coverage this year. Over at Capital One Financial (COF), 21 of the 24 analysts tracked by MarketBeat have it rated a Buy, with an average target of $258.50.
So the Street has ruled, and it isn't close. The majority opinion on both of these banks is bullish.
We respectfully dissent. The structure on both charts points lower from here, and as we see it these are two of the higher probability near term bearish setups on our radar right now.
A dissent gets written down and signed, and it stays on the record long after the vote is taken. The reasoning goes in there too, so anyone can come back later and check the work. Ours comes with one thing a court's usually doesn't - the price that would overturn it. Every dissent owes the reader its reasoning, so here is ours.
The Probabilistic Lens
The scientific study of probabilities is the branch of mathematics that measures how likely an event is to occur. It investigates apparent randomness or uncertainty and attempts to assign some sort of reason to the madness. Let me state from the outset that this is not that.
We use some slight artistic license with the root word “probable”. Our employment of “The Probabilistic Lens” is regarding paths and projections on a stock chart. This likelihood is derived from the context of prior price action. The structure in place is writing a story that is yet unfinished. And it is the fractal nature of the markets that provides the next chapter.
In practice we hold several paths on a chart at once, give each one a weight, and let price cross them off as it goes. Most of the time more than one is still standing. Every so often the structure narrows things down to a single path worth acting on, with a single price that tells us we're wrong. This does not mean we are forever correct. What it does signify though is a binary type setup, straightforward right or wrong.
With that disclosed and in the open, let's advance to the practical usage of this method — how we use it across hundreds of charts.
The Setups
Both banks are in the same sector and share similar setups. Slight variations exist in the smaller subwaves but the overall projection is communal. When we scan across all of these charts there is a specific setup that typically provides a higher probability outcome, particularly in a bearish case. COF and WFC both are presenting this type of structure. In plain English, that's a first leg down and a partial bounce, and then the larger decline gets going. Let's get into the parameters and levels.
This is the chart for COF at the daily interval. Note the initial circle ‘a’ decline from what is counted as a larger A wave rally. This circle ‘a’ is followed by a clear 3 wave corrective rally marked circle ‘b’. What's next?
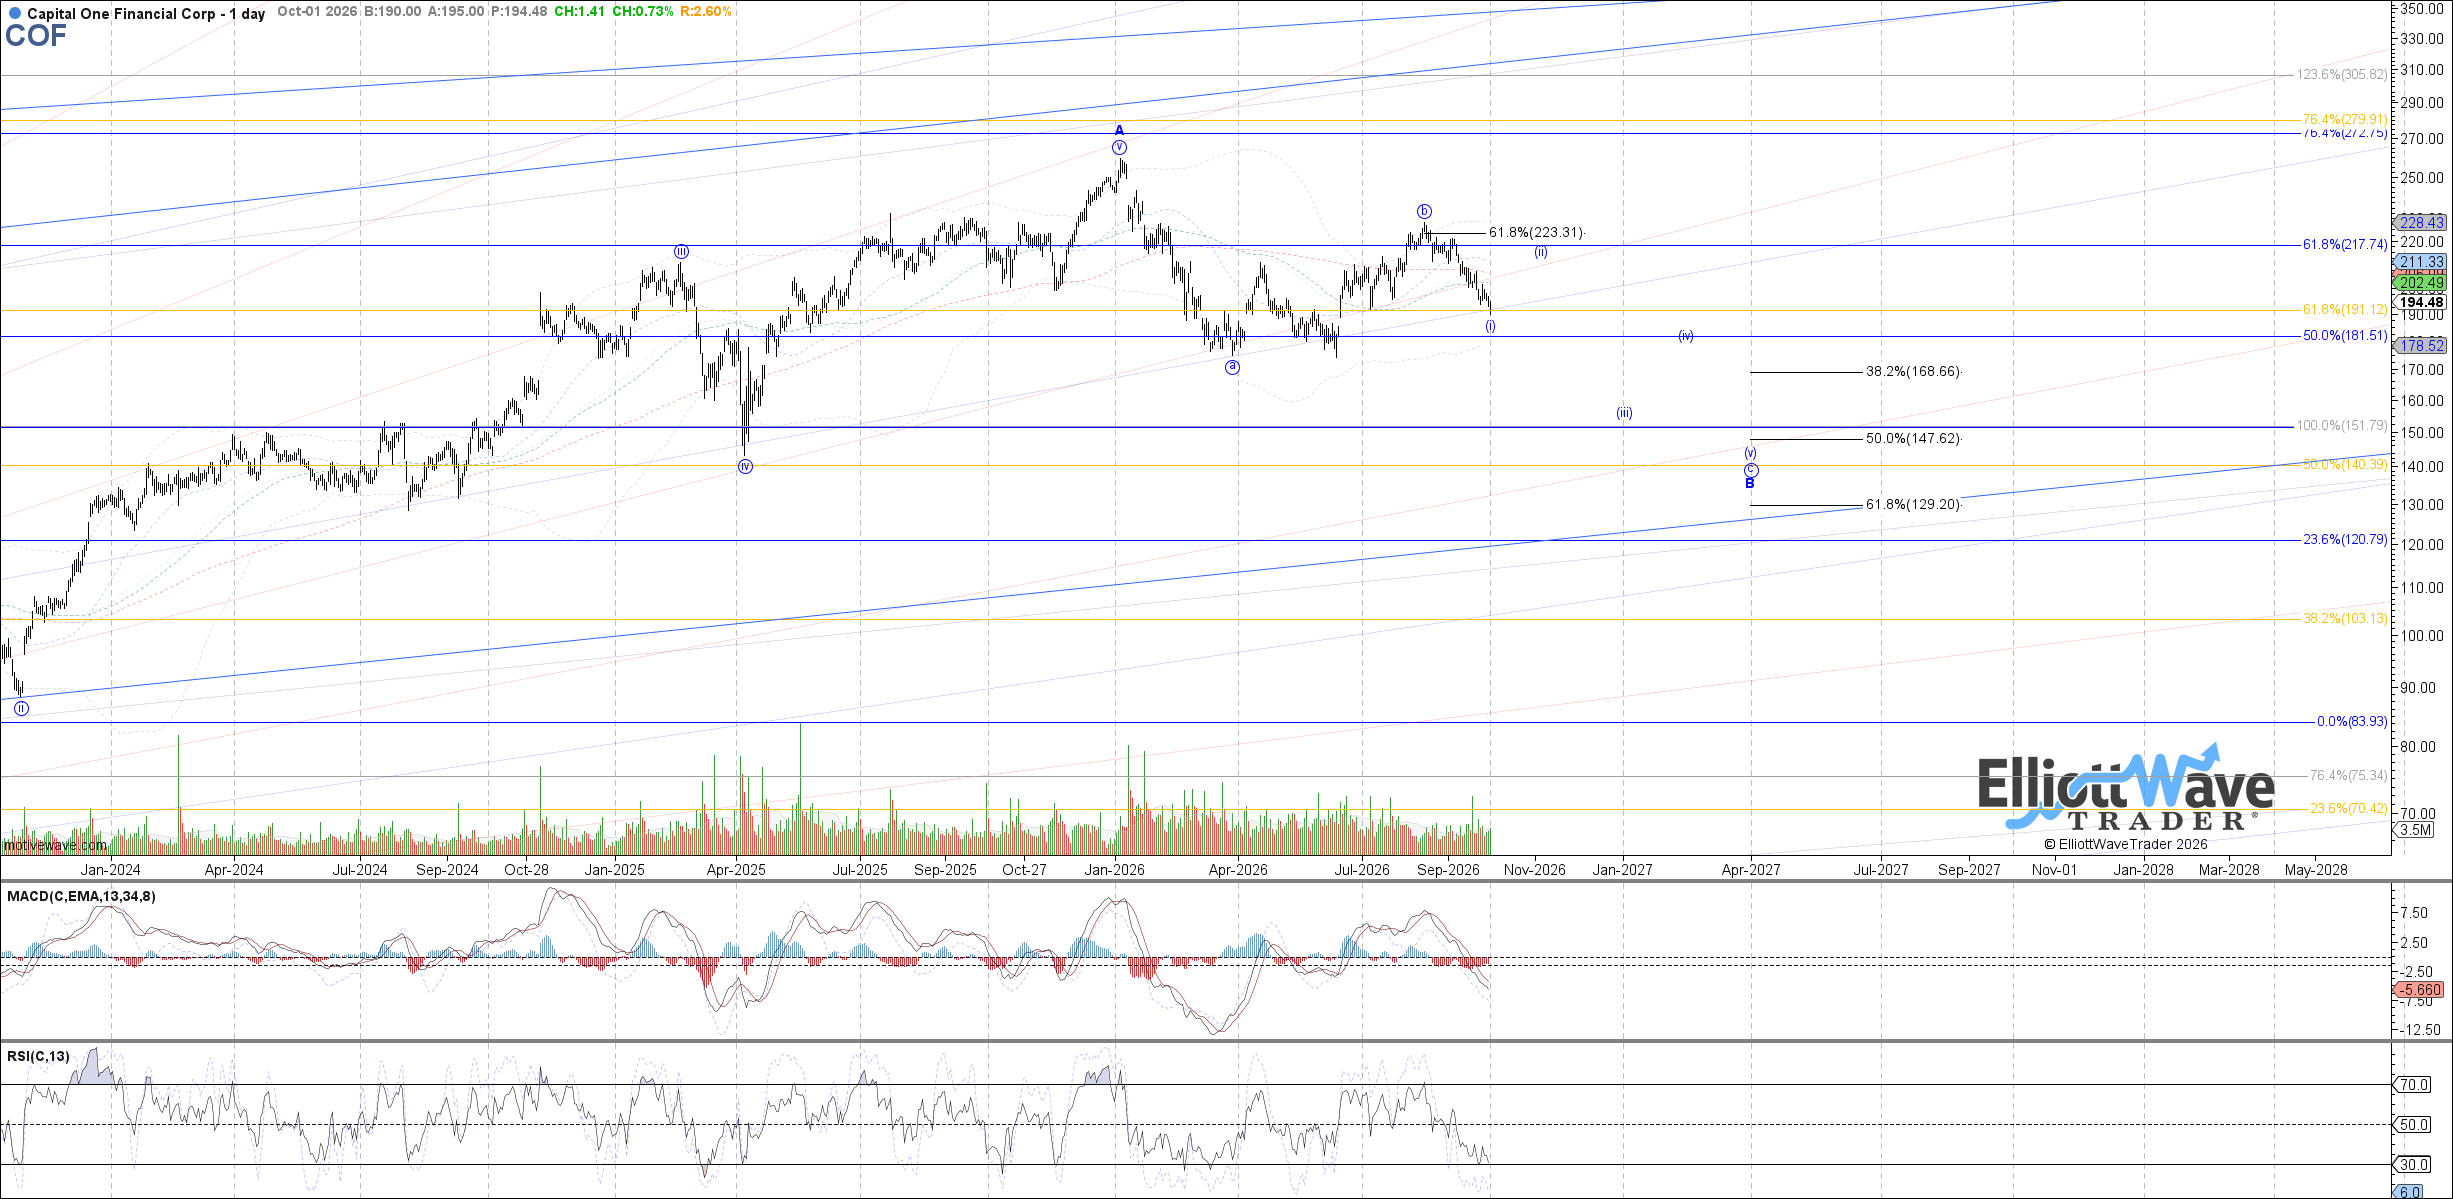
Circle ‘c’ is on deck. Other than triangles, C waves are always five wave structures. Wave (i) is in place and we await a smaller corrective bounce in wave (ii). That would be the highest risk/reward setup for this chart. What's more, we are now able to follow a standard Fibonacci Pinball structure to the downside. This will quickly tell us whether the scenario is confirming the projected path or if it should be modified.
The invalidation of this bearish scenario currently resides at the top of the prior circle ‘b’ struck at $228.14. Once the corrective bounce anticipated as wave (ii) forms it will then give us a more accurate target area for all of (v) of circle ‘c’.
For COF, the trade we’d watch for is an entry in the $205 to $210 area, the invalidation is above $228.14. That risk level would move down to the wave (ii) high once struck. At the moment, a target area of $129 to $148 is projected.
Now, to be fair to the majority. Capital One beat handily last quarter, earning $5.81 a share against a $4.79 estimate, and we are not calling this a broken company at this time. The bench is starting to show a few cracks though. Within the past week Citi and Evercore ISI both trimmed their price targets while keeping their ratings. That reads like a majority that still believes, just with a little less conviction than it had a month ago. Capital One reports third-quarter results after the close on October 20, so the setup has an earnings report to get through. We'll see what the crowd makes of it.
You can see a similar type of setup for WFC on the daily chart below. The A wave decline off the January high is in, followed by a clear three-wave B wave rally.
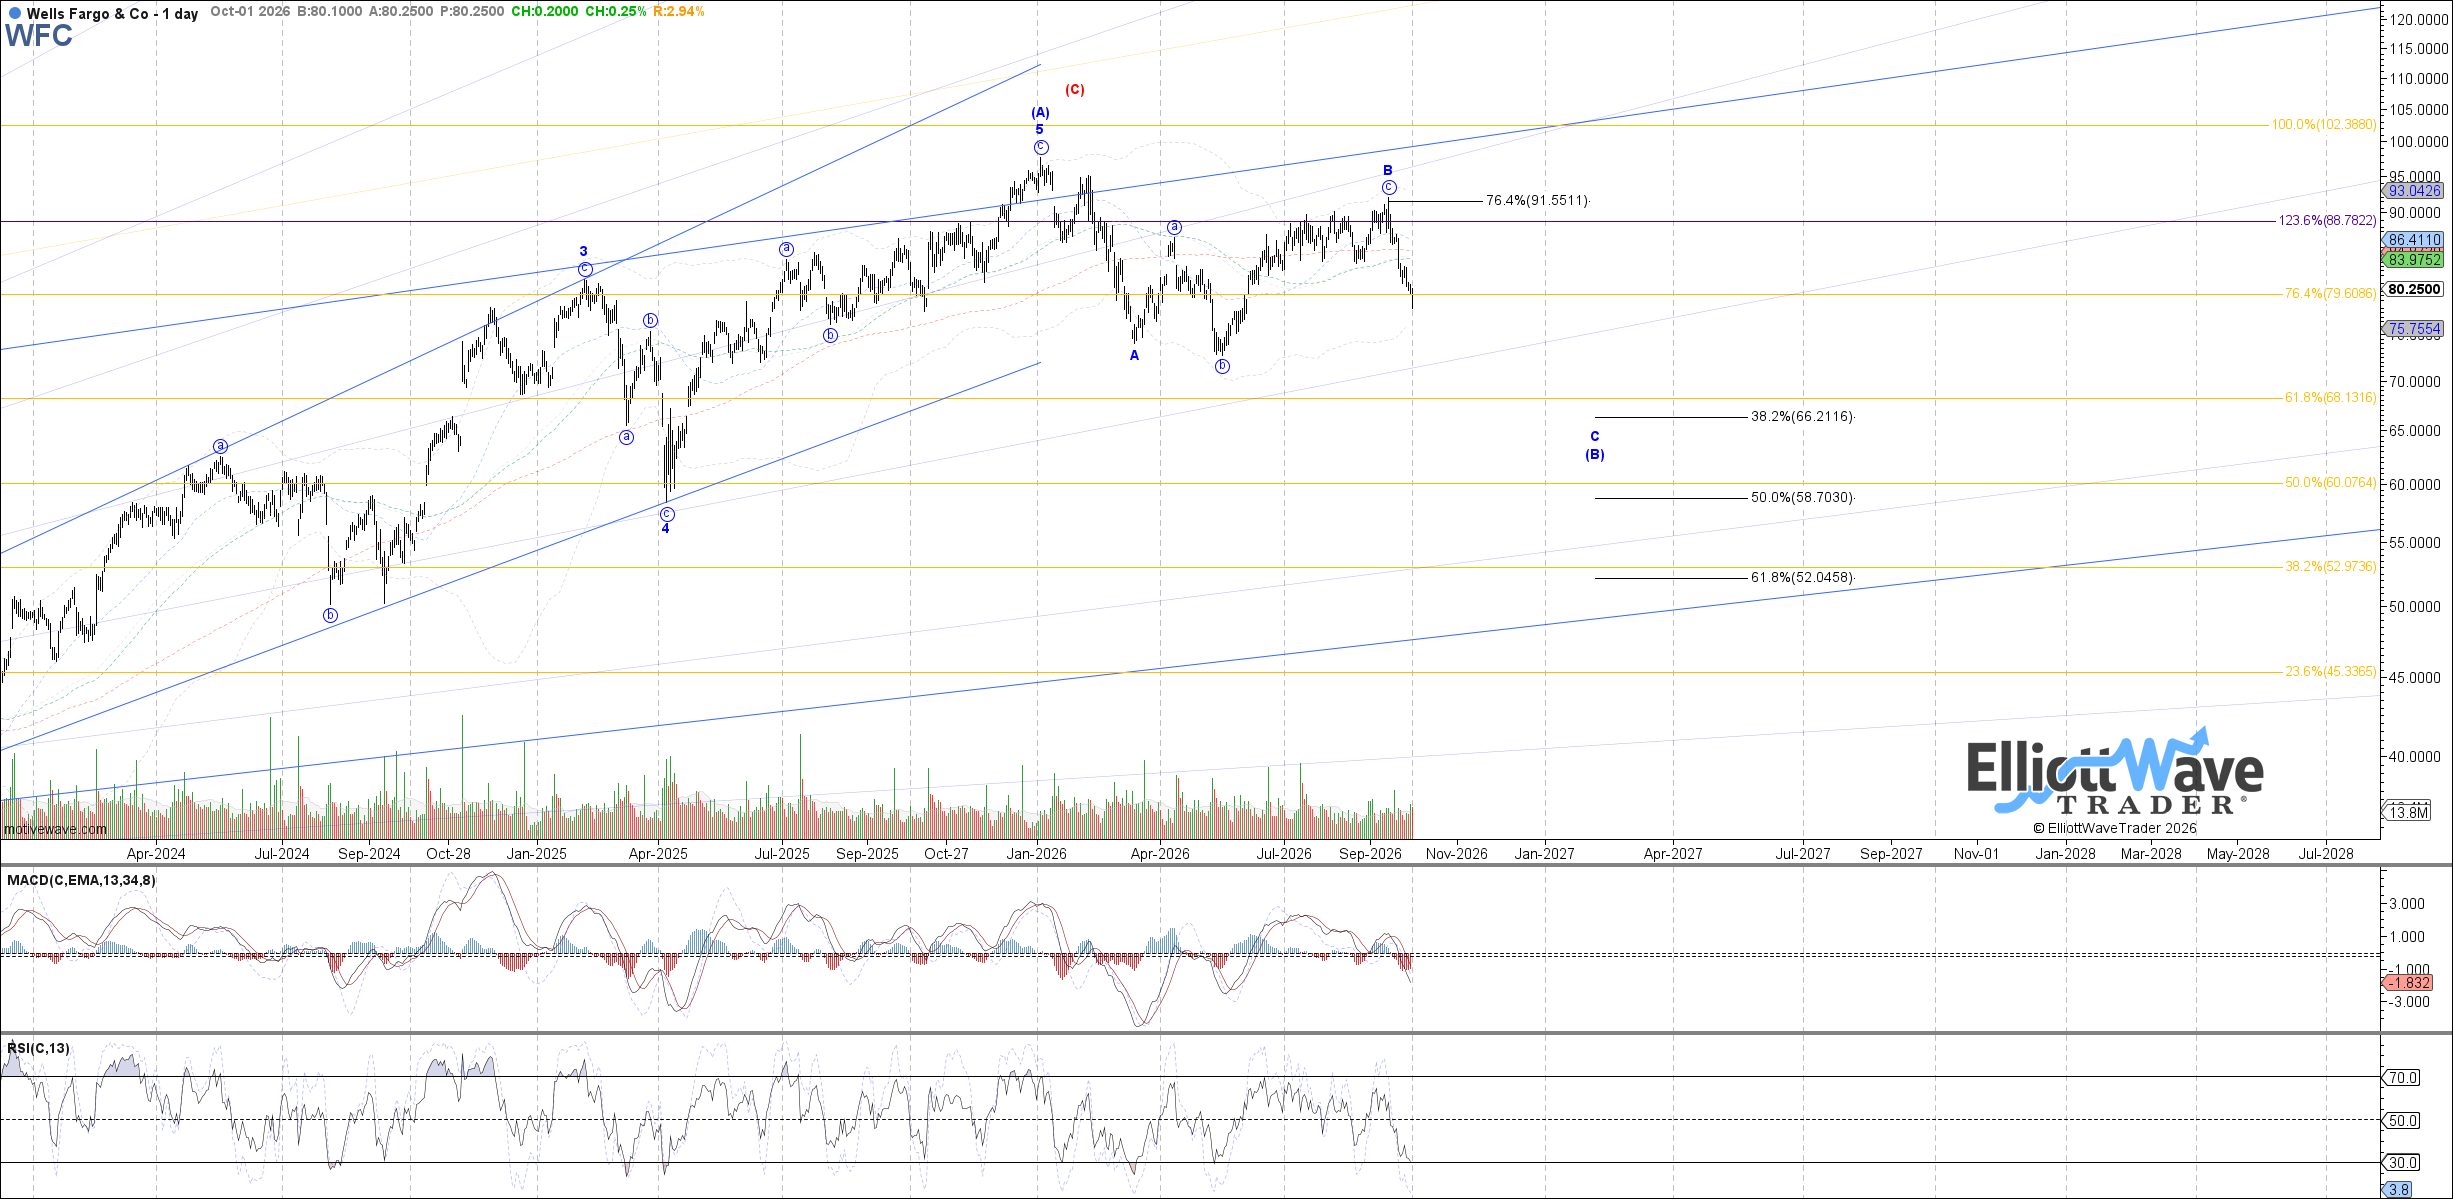 This may just be a small step behind COF in its initial wave ‘i’ of C of (B) down. But the parameter similarities remain. For now, invalidation of the near term bearish scenario is at the prior B wave high, $91.99. The red (C) you notice above that main high is a potential marker for a larger alternative path. It would not affect the near term projections.
For WFC, we’d be looking at an optimal area for a wave ‘ii’ bounce at the .382 to .618 retracement of wave ‘i’, once that gives indication that it is complete to the downside. Invalidation is above the $91.99 high, and the initial target is in the $60 area, to be clarified closer with the wave ‘i’-‘ii’ projection.
Wells Fargo is where the majority is loudest. Beyond Morgan Stanley, 18 of 26 analysts tracked by LSEG rate it a Buy or Strong Buy, and Truist recently raised its target to $95. JPMorgan stayed at Neutral with a $91.50 target, which happens to sit just under the near term bearish scenario invalidation. (Make of that what you will.) Wells reports before the open on October 13, a week ahead of Capital One. That will be the first hearing for this dissent.
Conclusion
This way of looking at the markets does seem like we are going on record ahead of the verdict. It is the crowd that over time will render its decision. The likely path ahead, as we see it, projects down for both COF and WFC charts. We have a clear invalidation level just overhead where the setups would be discarded.
We have seen this type of setup play out many times before. One verdict alone doesn't make a method, ours included. The record across many setups is what counts, and that record gets built one public call at a time, the misses right along with the hits.
If either of these trades above its invalidation, we'll report it right here, plainly, and move on to the next chart. Until price overturns it, our dissent stays on the record.
