Buyers Failed To Capitalize at 4200s+ ... Can Sellers Force A Breakdown Into 3300s?
 By
Ricky Wen
By
Ricky Wen
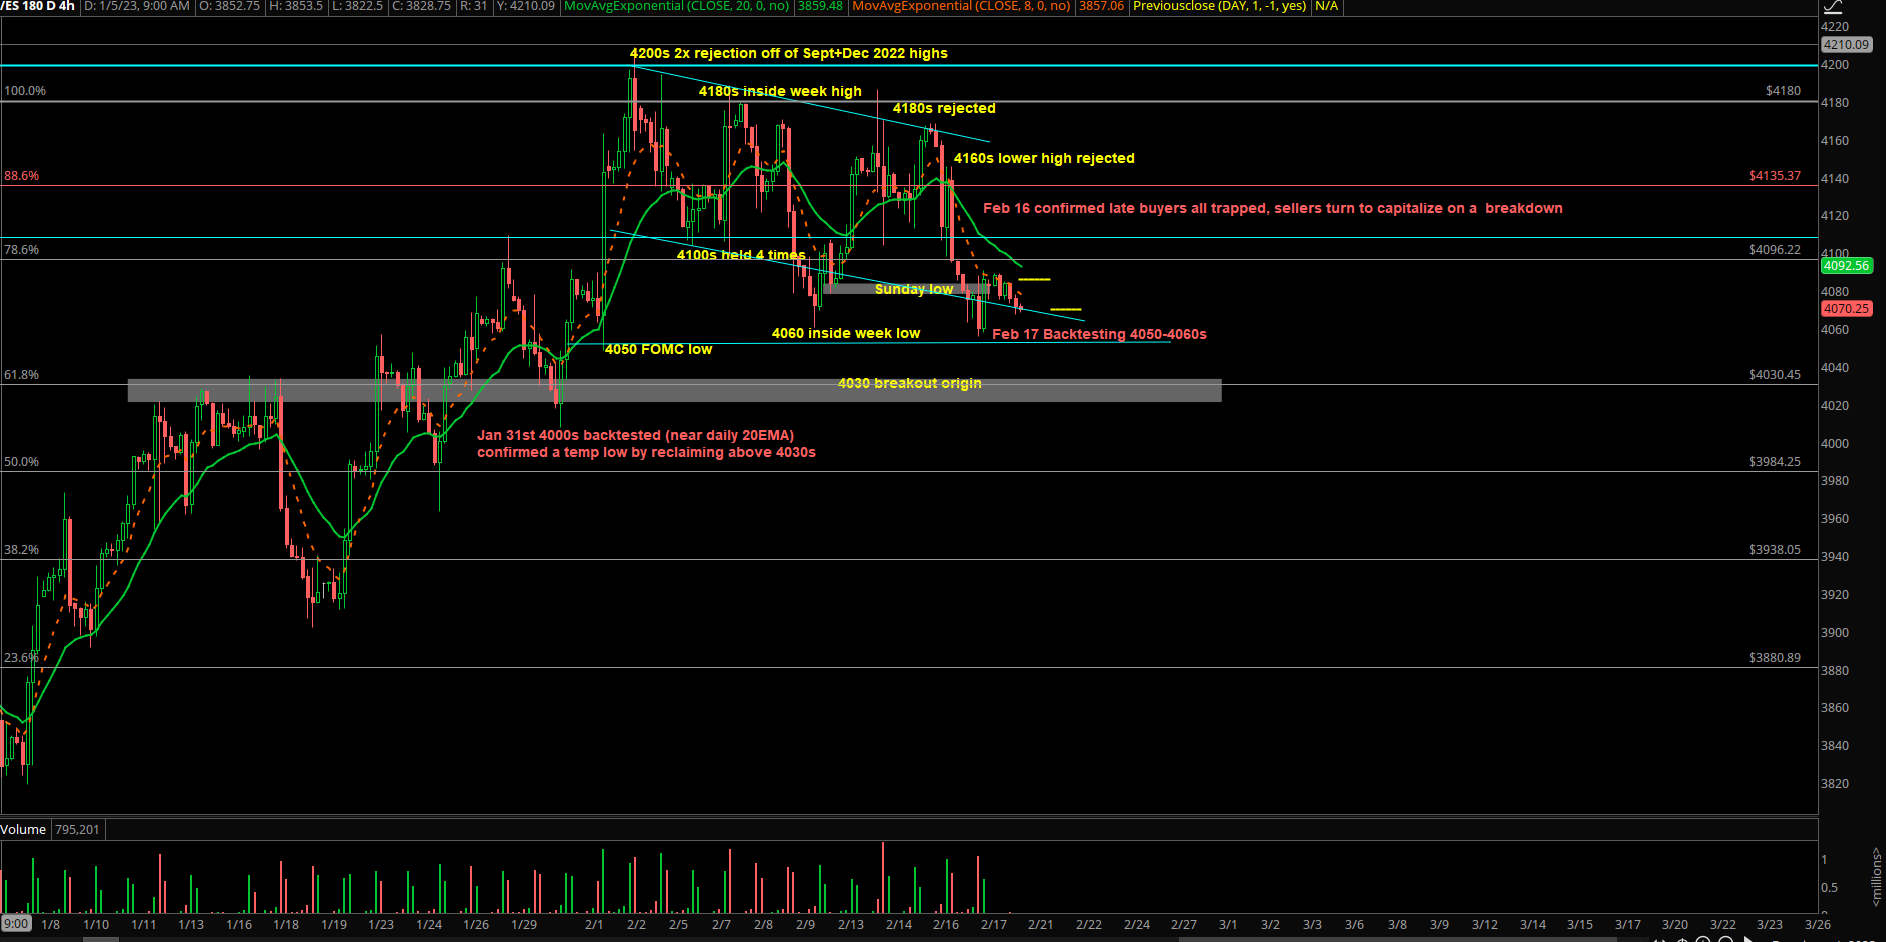
The third week of February mostly played out as another inside week within the price levels of the first week of the month. Rangebound trading continues and price action is getting very close to a large range expansion given the amount of trapped market participants here. The most significant thing we can glean from this action is that buyers have failed to capitalize on the technical bull flag with the inability to go any higher than 4200s on the Emini S&P 500 (ES). Buyers are running out of time and price is being rejected at the multi-month resistance zone. Price is falling back below daily 20EMA, so we’re currently treating 4200s as the February monthly highs and possibly Q1 2023 range high. Let’s see if sellers can confirm an assault /range expansion lower.
Key weekly parameters going into Feb 21-24 (this section is only updated after every week completes)L
- Key weekly battle remains the same as last weekend report: between of 4060s vs. weekly high 4180s to open up bigger ranges and to gauge momentum on the incoming breakout/breakdown.
- 4200s is the foreseeable swing high/reference point going forward, until price proves otherwise.
- Price falling back below daily 20EMA, so we’re currently treating 4200s as Feb monthly highs and possibly Q1 2023 range high. Let’s see if sellers can confirm an assault /range expansion lower.
In general, here are our simplified parameters below:
- A daily close and hold below 4050 opens 4030/4000/3960 as continuation targets.
- A daily close and hold above 4130 opens 4150/4180/4200 as continuation targets.
Intraday trading parameters (updated for every session):
- Using 4050-4060 as immediate support zone and momentum gauge.
- Short-term price action leaning towards neutral-bear biased.
- If price can break and hold below 4050, then 4030/4000/3980 act as immediate breakdown targets (trend day down scenario).
- If price holds and sustains above 4060, then 4080/4100/4115 are deadcat bounce targets (range day)
- Currently, any daily close that is below 4130 is considered as a deadcat bounce.
- If you zoom out a bit, market is simply consolidating above the daily 20EMA for the past 13~ sessions and attempting to form a technical bull flag of sorts that is very close to failing (Friday 17th poked into 4050-4060s and hovering just below daily 20EMA).