Buy the Dip, then Sell the Rally
 By
Ricky Wen
By
Ricky Wen
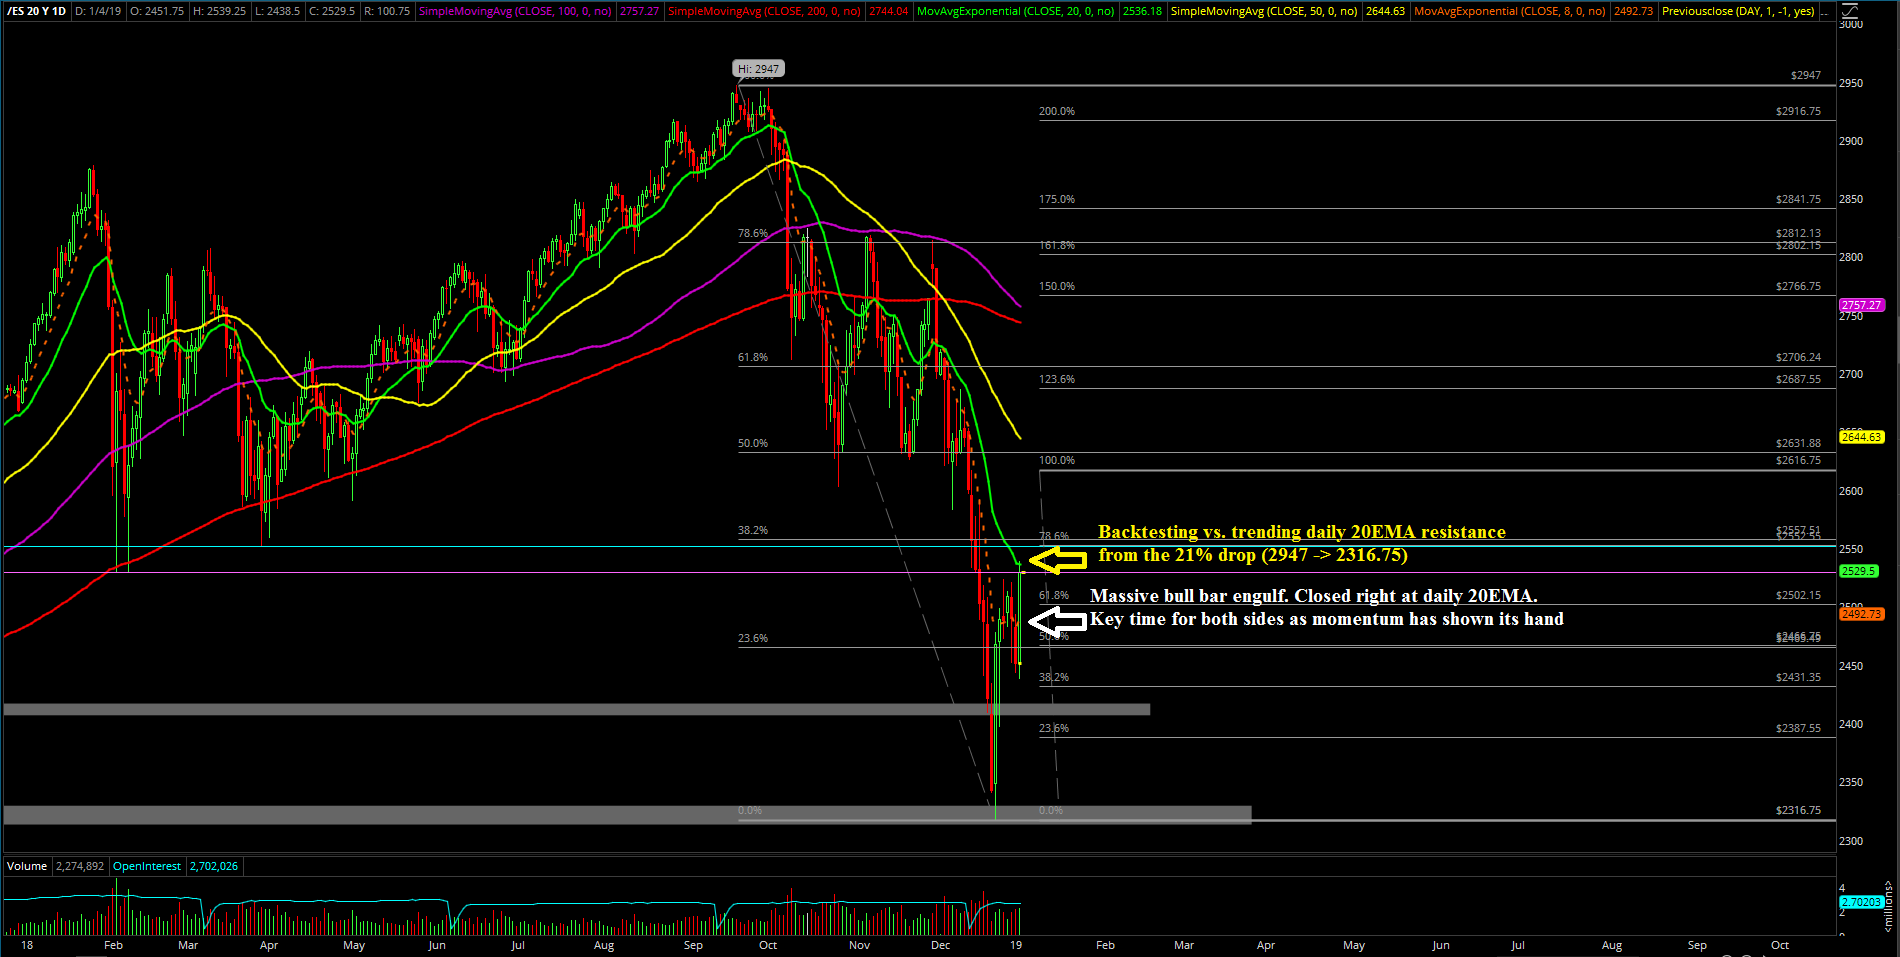
The first week of 2019 was about the battle of the trending 20 exponential moving average (EMA) to retest the December range low or morph into a bull flag breakout. In simplest terms, it was an inside week that got shot down back into the prior week’s top third trending support as bears failed to capitalize on the immediate downside flush setup.
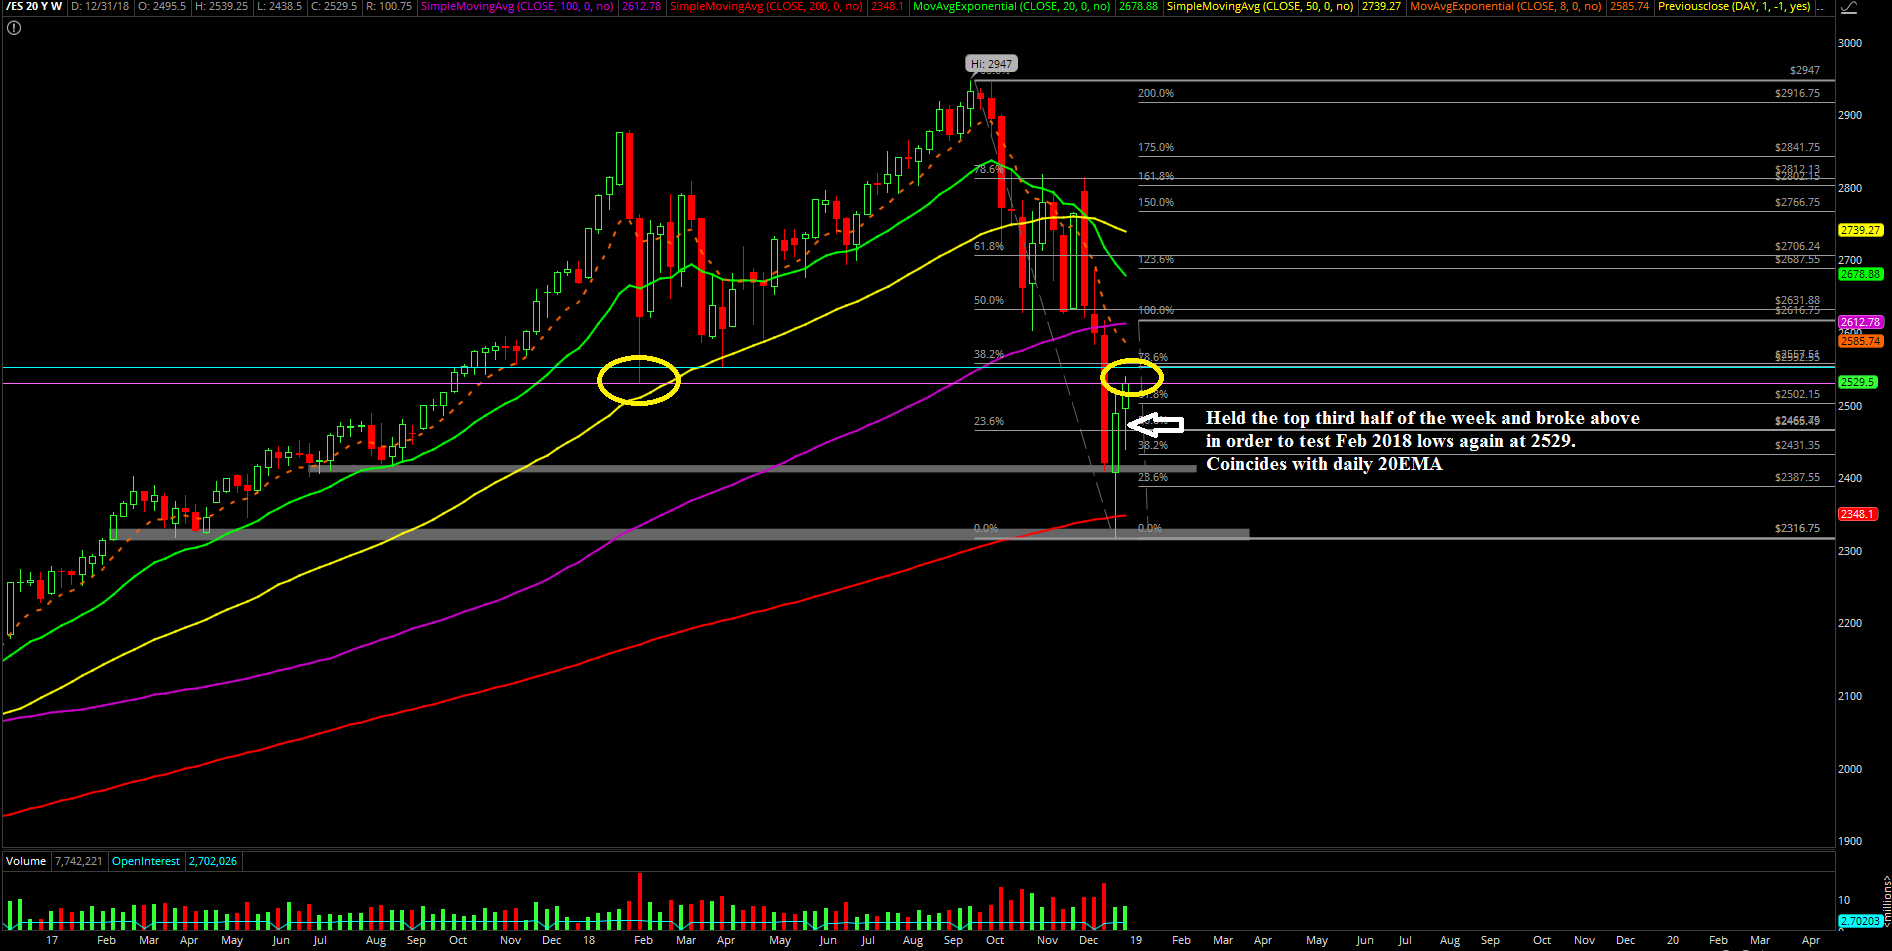
This paved the way for the feedback loop squeeze to commence that eventually broke to the upside in order to backtest the February 2018 lows of 2529 and coincidentally ended perfectly at the trending daily 20 EMA.
Overall, it was a fairly textbook week in terms of momentum as one side failed to do what they’re supposed to do, so the opposing side did a fast and furious squeeze.
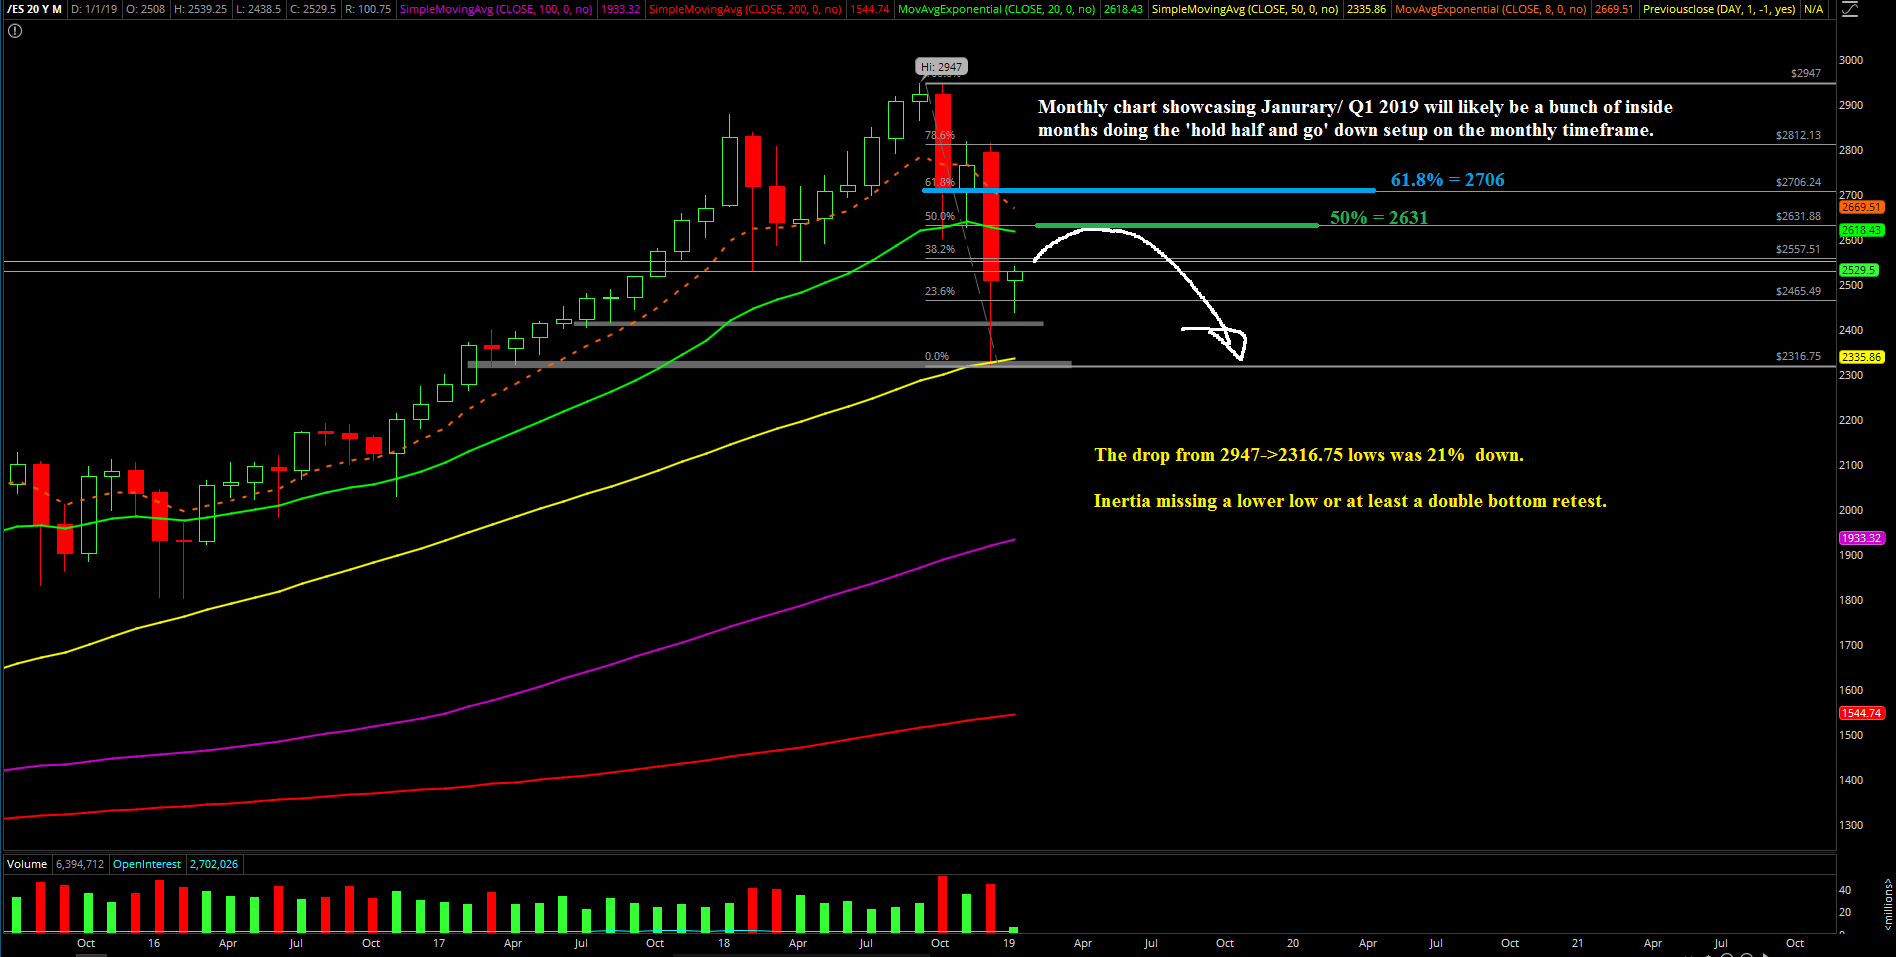
The main takeaway from first week of 2019 is that we have a fairly obvious short-term "hold half and go up" setup on the daily chart versus the monthly chart’s "hold half and go down" for January and Q1 in general. Short-term favors a sustained bounce if we can hold the midpoint of Friday’s range to keep up with momentum. Let’s see if the market gives us an easier time with BTFD (buy the f'in dip) at support than it gives us with STFR (sell the f'in rally) at resistance again.
What’s next?
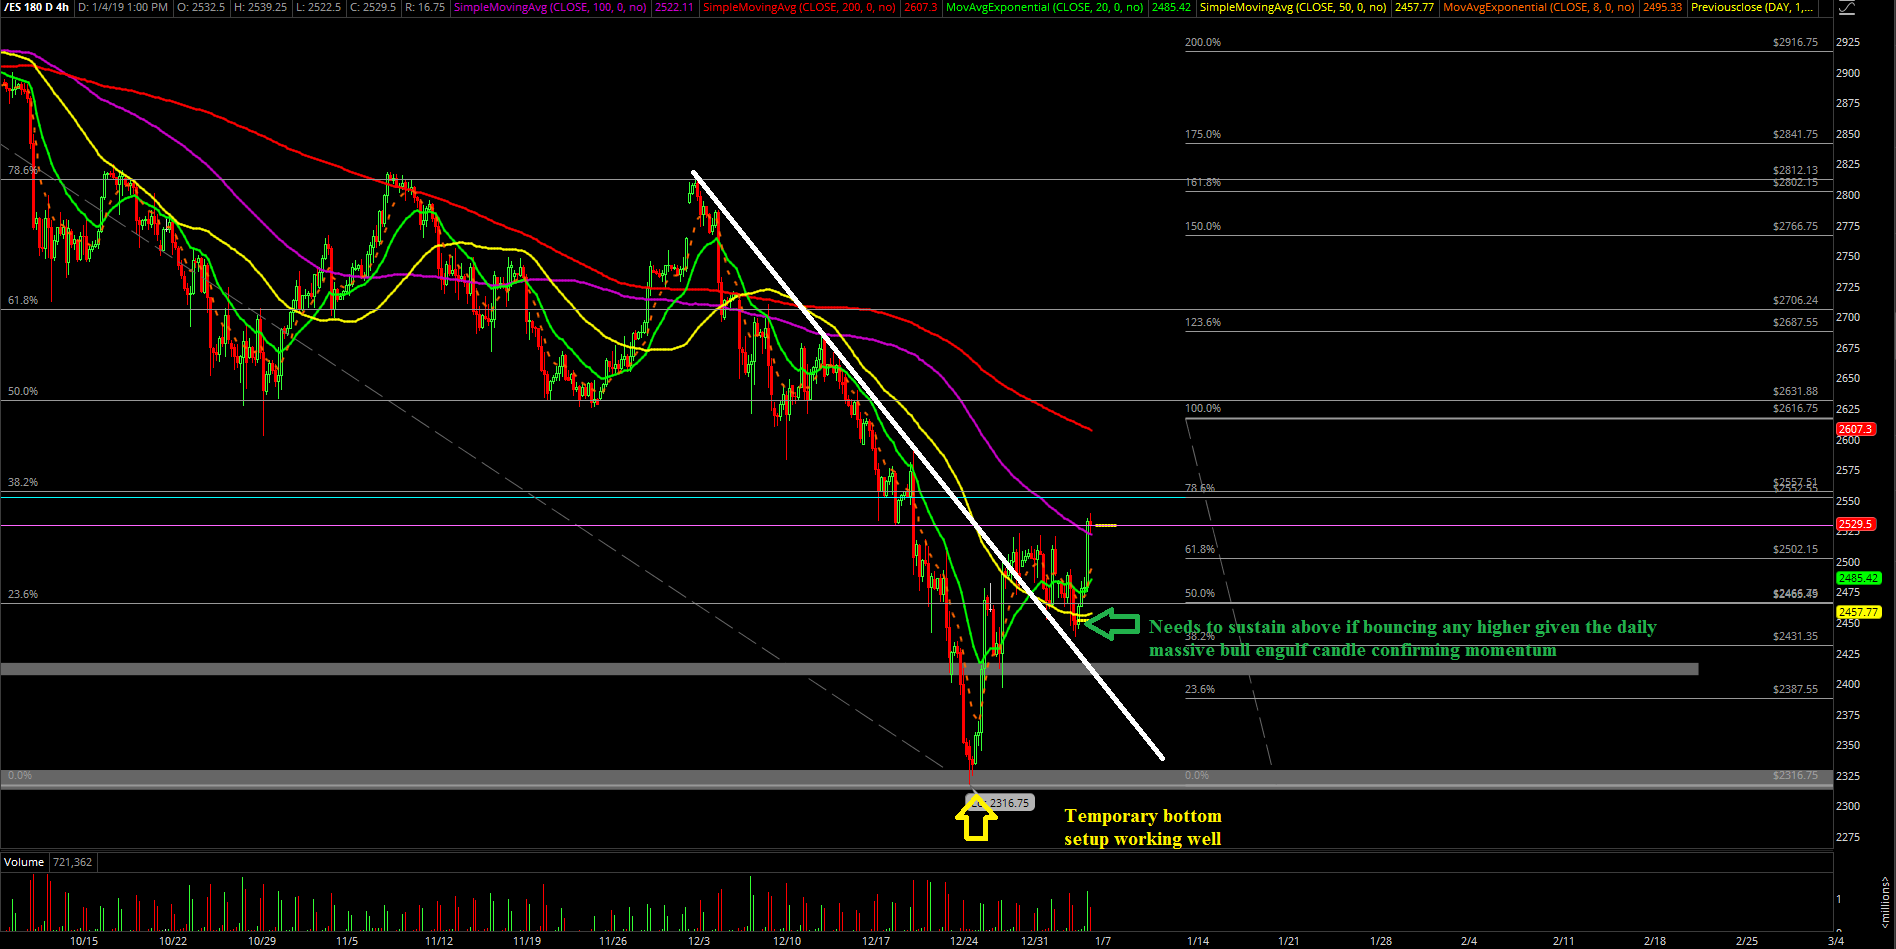
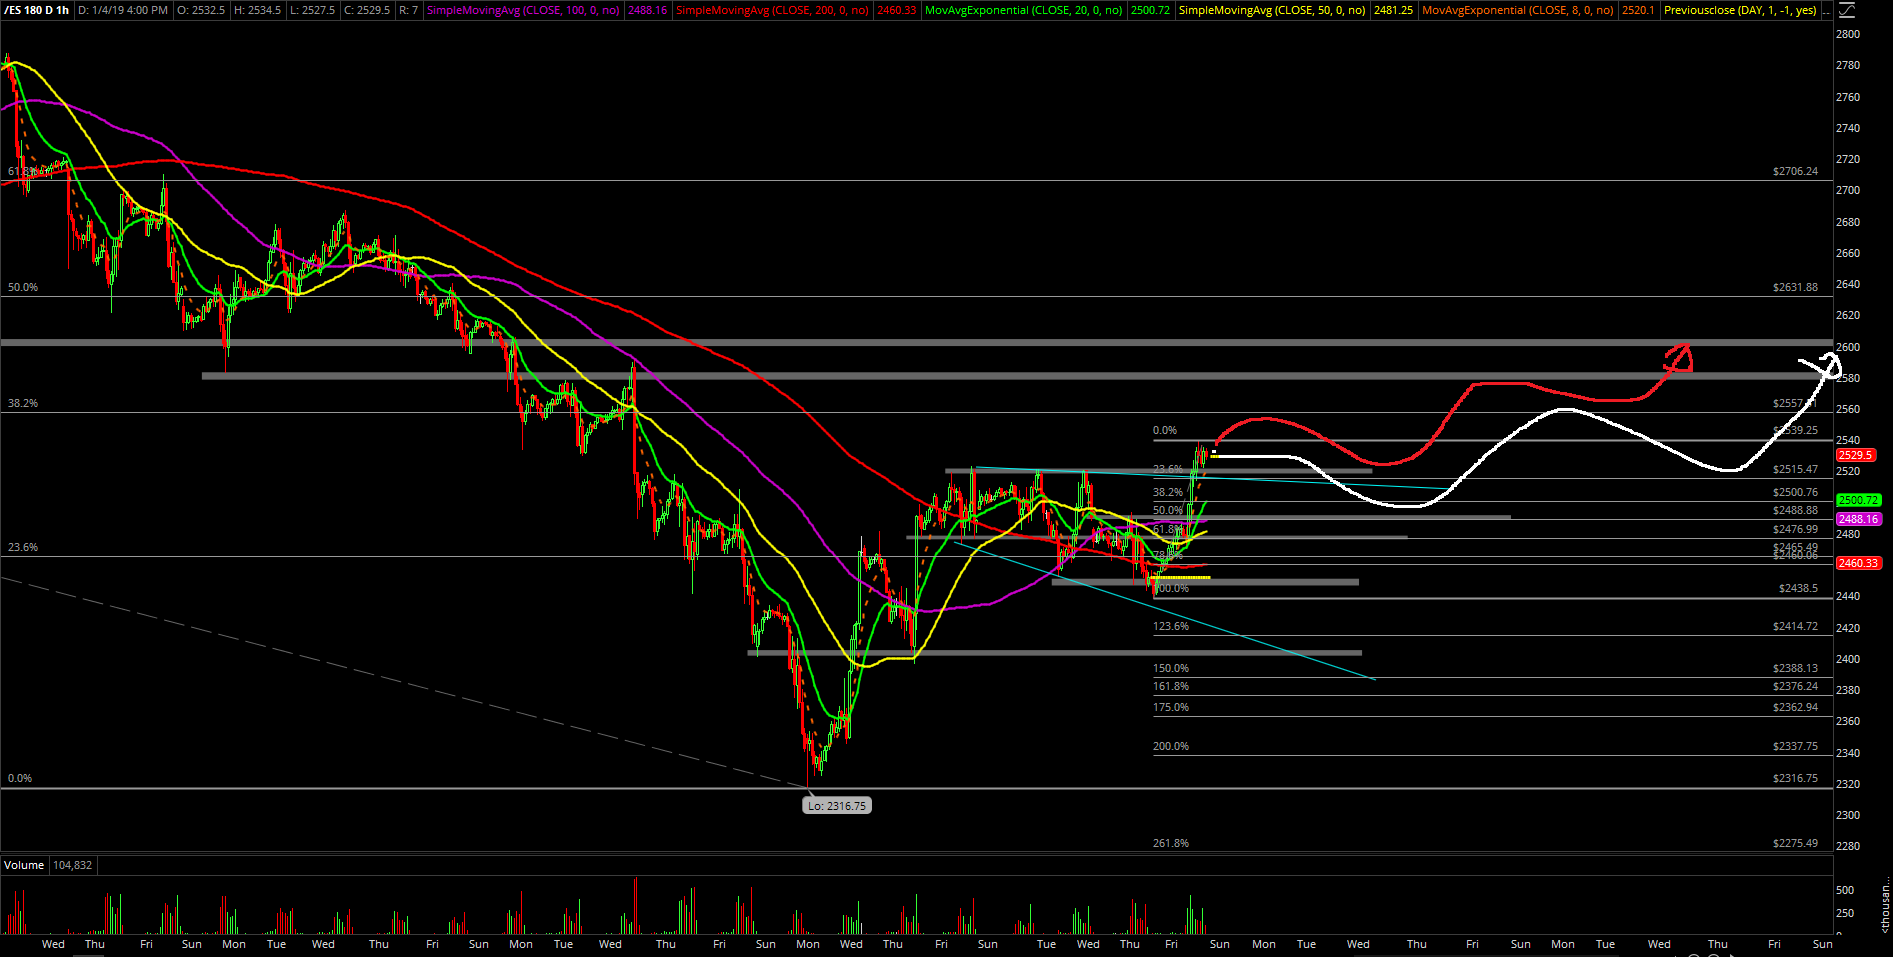
Friday closed at 2529.5 on the Emini S&P 500, which was right at the February 2018 low of 2529 and the trending daily 20EMA resistance. Heading into the second week, we’re going to be judging the current short-term momentum with the trending supports at 2493 and 2475. The latter is the must hold support if we’re going to play out the textbook "hold half and go" pattern on the daily chart timeframe.
As discussed during Friday, we’re looking for a continuation setup into the 2580-2600 zone as the short-term target. Then we'll judge where to STFR again as the higher timeframe such as the monthly chart is still showcasing that any bounce is treated as a dead=cat bounce when below key resistances such as 2631 and 2706.
The 1-hour chart below showcases our white line projection as primary, red as alternative for this early week’s roadmap and game plan.
In summary, we’ll try to execute the BTFD strategy when trending above 2493/2475 for a 2580-2600 target zone. Then, wait and see when to STFR near resistance as the market showcases more clarity. If short-term cannot sustain 2493/2475, then be aware of backtesting against Friday’s low of 2438 immediately and lower because momentum should not fail like that.