Buy the Dip Crowd Doing Well, New Highs Attempted
 By
Ricky Wen
By
Ricky Wen
The first week of August was fairly simple as most of the action went according to our expectations. The bulls were once again able to keep the ongoing daily Aug 20 exponential moving average bull train alive by stick-saving at the necessary key supports at the beginning of the week. Then, a huge bull bar reversal ensued on Thursday to cement the trapped bears and attempt the squeeze setup on Friday, and they succeeded by wrapping up the week at the highs.
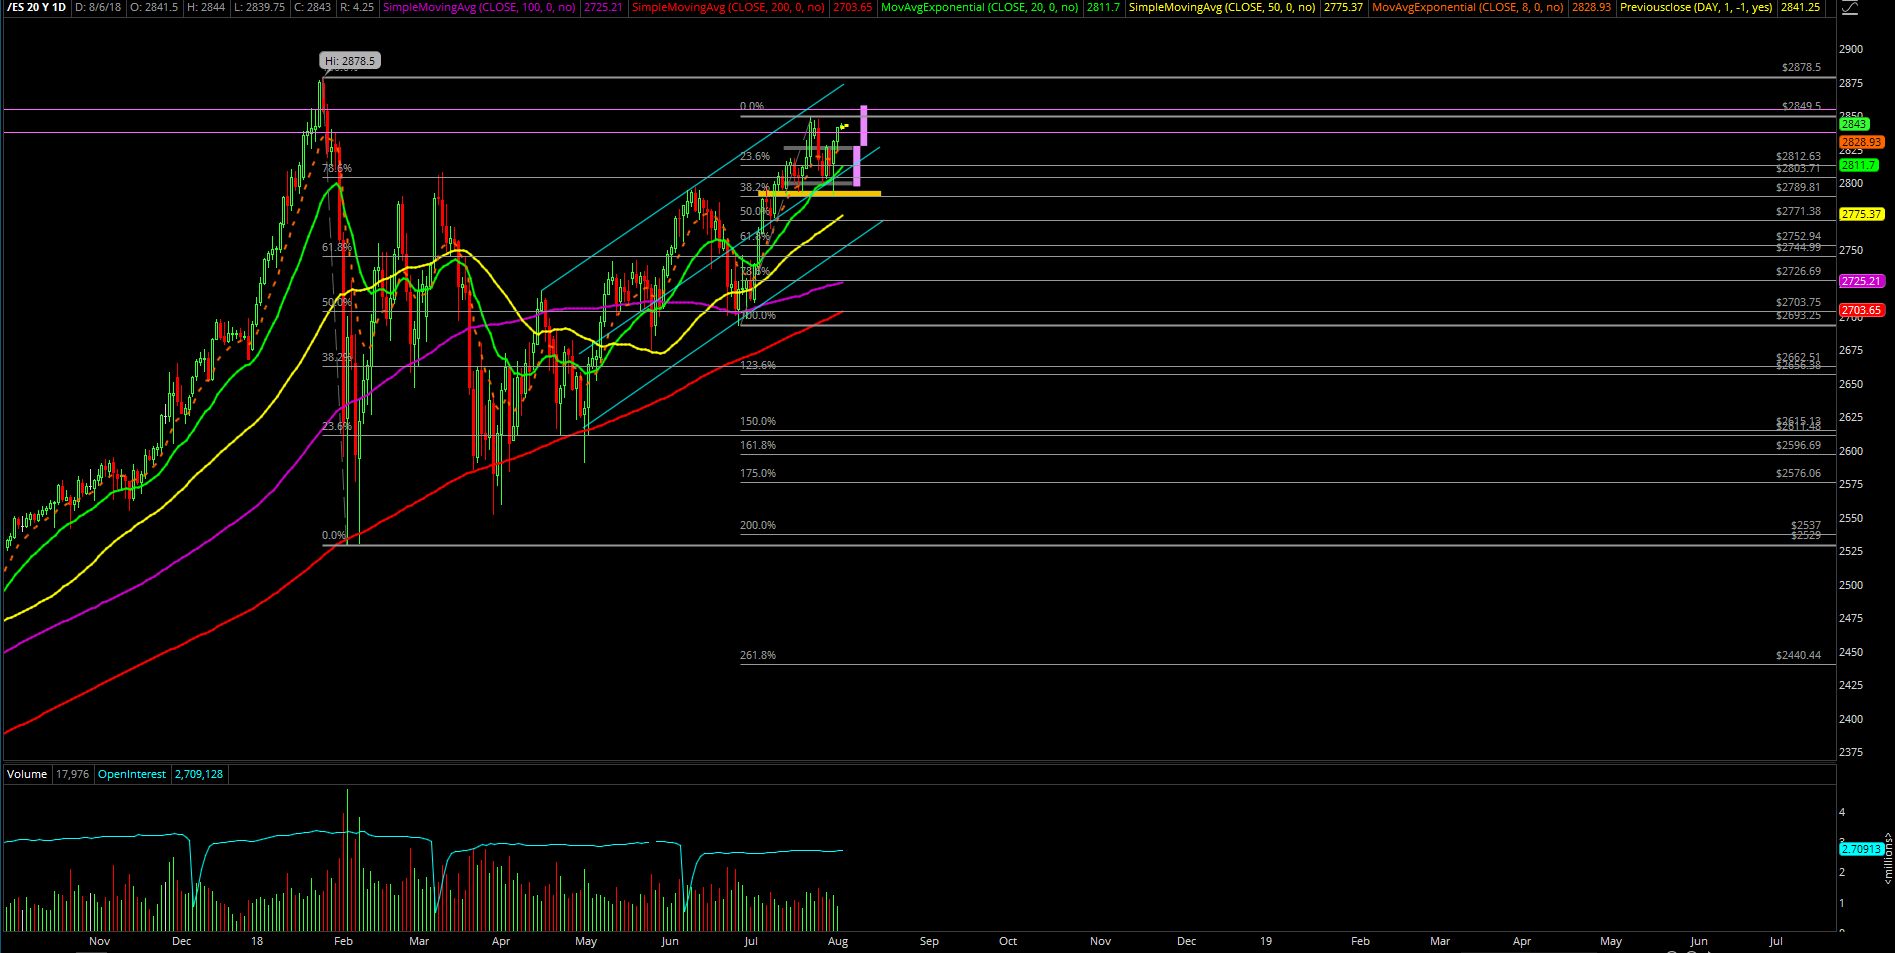
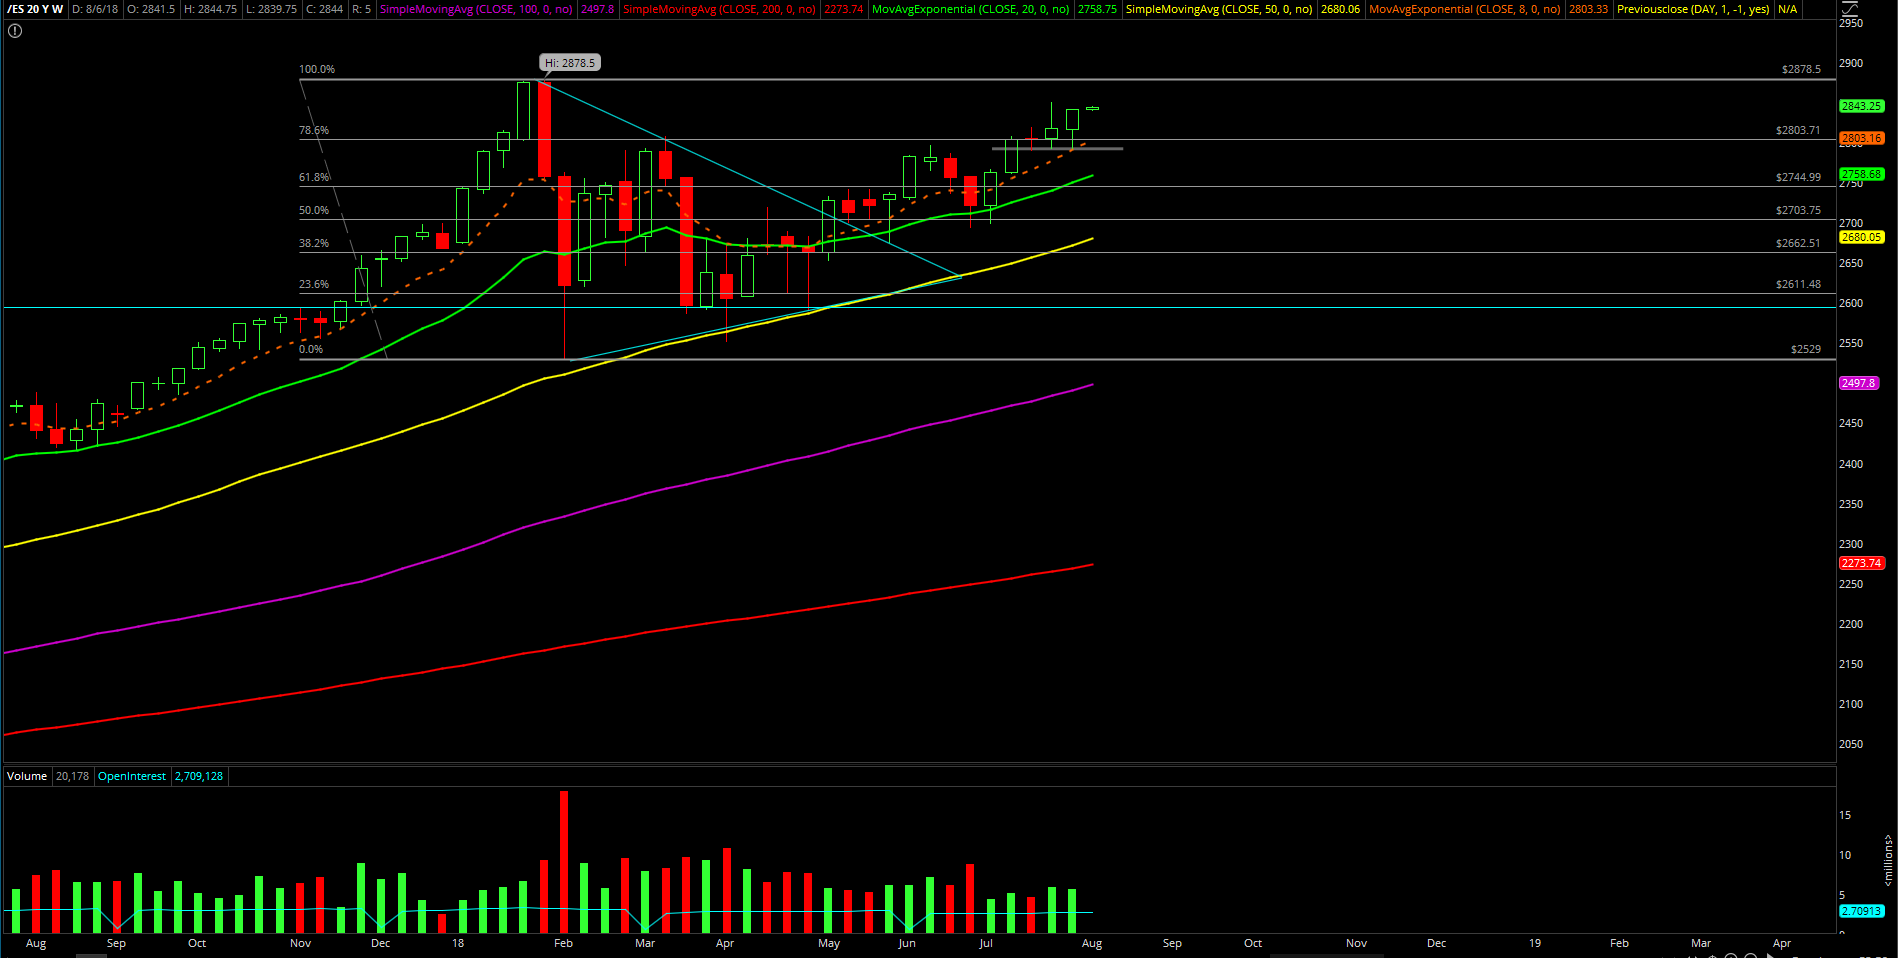
The main takeaway from this week was that the high-level consolidation is nearing its end since the S&P 500 is near the July high of 2849.5 and the bulls are trying to accelerate the train into the all time high of 2878.5. It’s been three weeks of bullish consolidation if you look closely on the weekly chart where it showcases a typical bull flag/continuation pattern.
What’s next?
Friday closed at 2841.25 and the high of the week and right where we expected it from the ES trading room per Friday morning's measured move calculations. It was a fairly impressive feat by the bulls on last Thursday to cement the huge bullish reversal candle that had a range of 40 points. In simplest terms, one candle engulfs the prior three sessions, so there were enough trapped market participants for the squeeze on Friday and heading into this new week.
There are no changes in terms of immediate target/perspective since the Wednesday’s KISS report; we’re still waiting for the 100% measured move to 2858 to be fulfilled. At this point, immediate trending supports have moved up once again, and are now at 2835 and 2825.
When above these levels, bulls are so immediately strong that it’s not wise to be a bear until something dramatic occurs to change our view. Stick with a level-by-level approach; when the 2858 level gets claimed, and then we can look for the next level at 2878.5, the prior all-time highs from the end of Janurary. To be a bear and look for a temporary top, price must go below Friday’s low of around 2825 first to open back-up levels; otherwise, the buy the dip mentality continues.
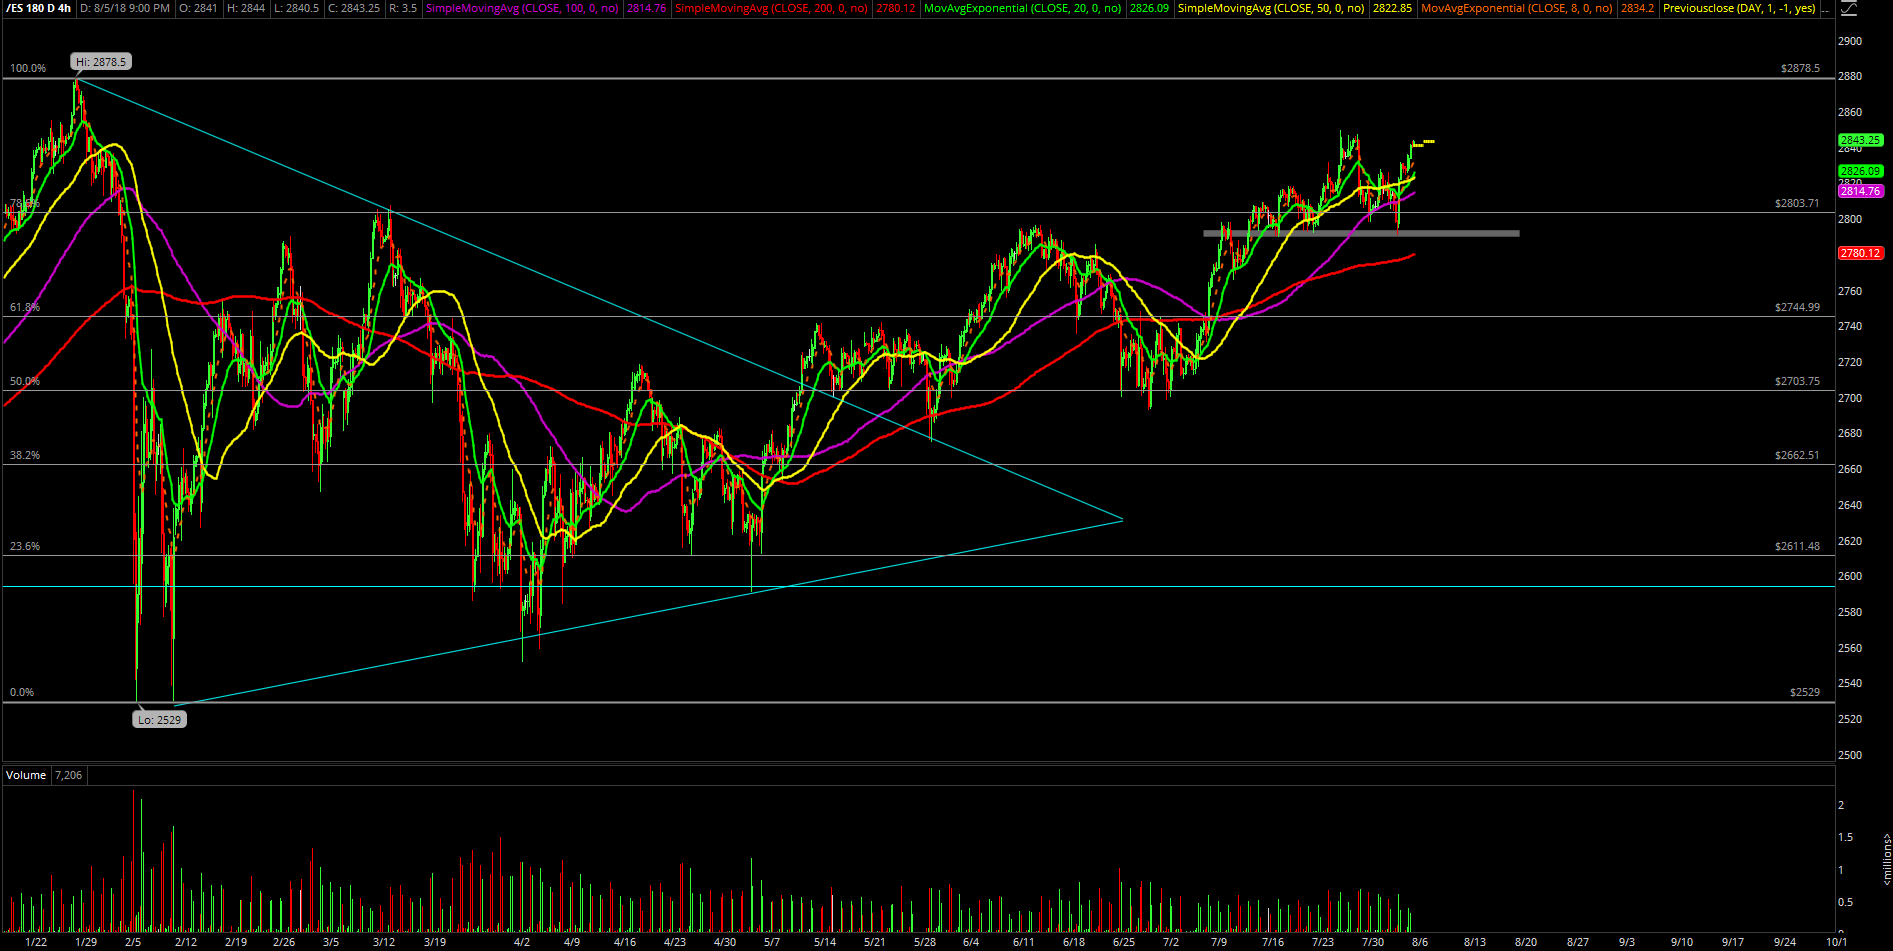
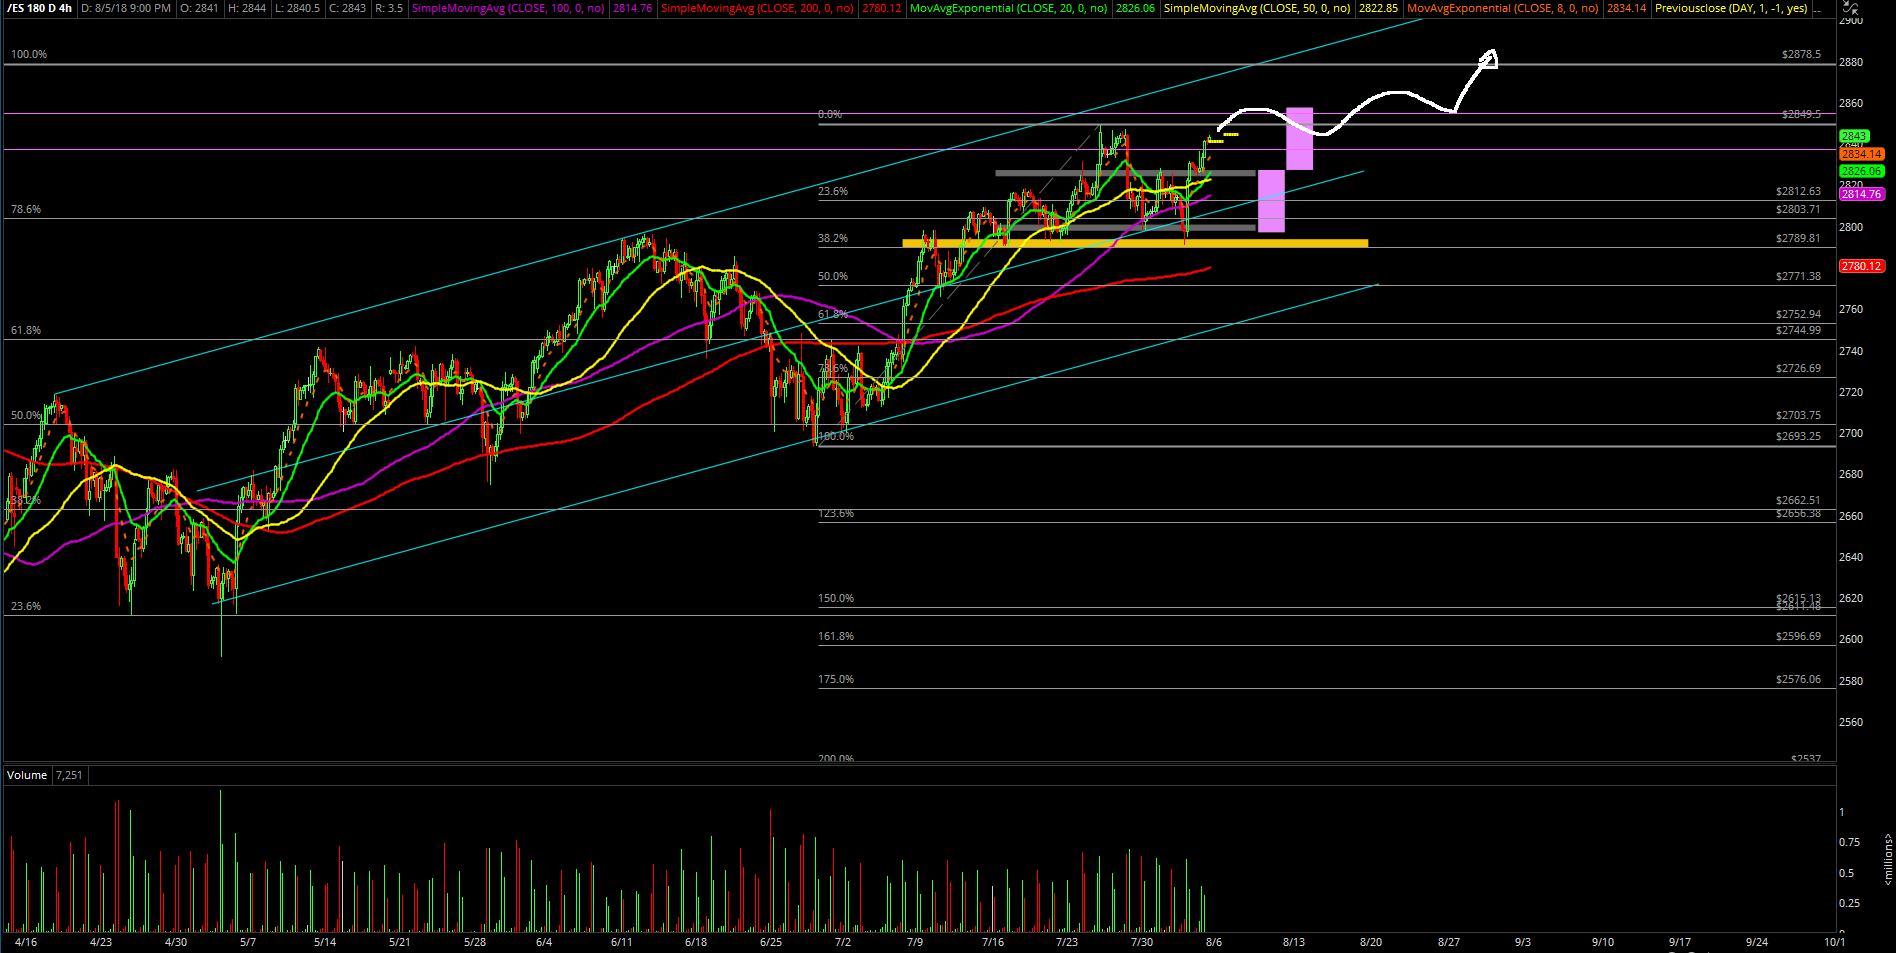
The current 4-hour white line projection chart shown below defines our expectations going forward and it remains king until something changes to invalidate the trend/perspective.