Bullish Consolidation Pattern - Market Analysis for May 7th, 2020
 By
Ricky Wen
By
Ricky Wen
Wednesday’s session played out as an inside day as the "gap up and go" could not be sustained in the morning so the price action was confined within Tuesday’s range.
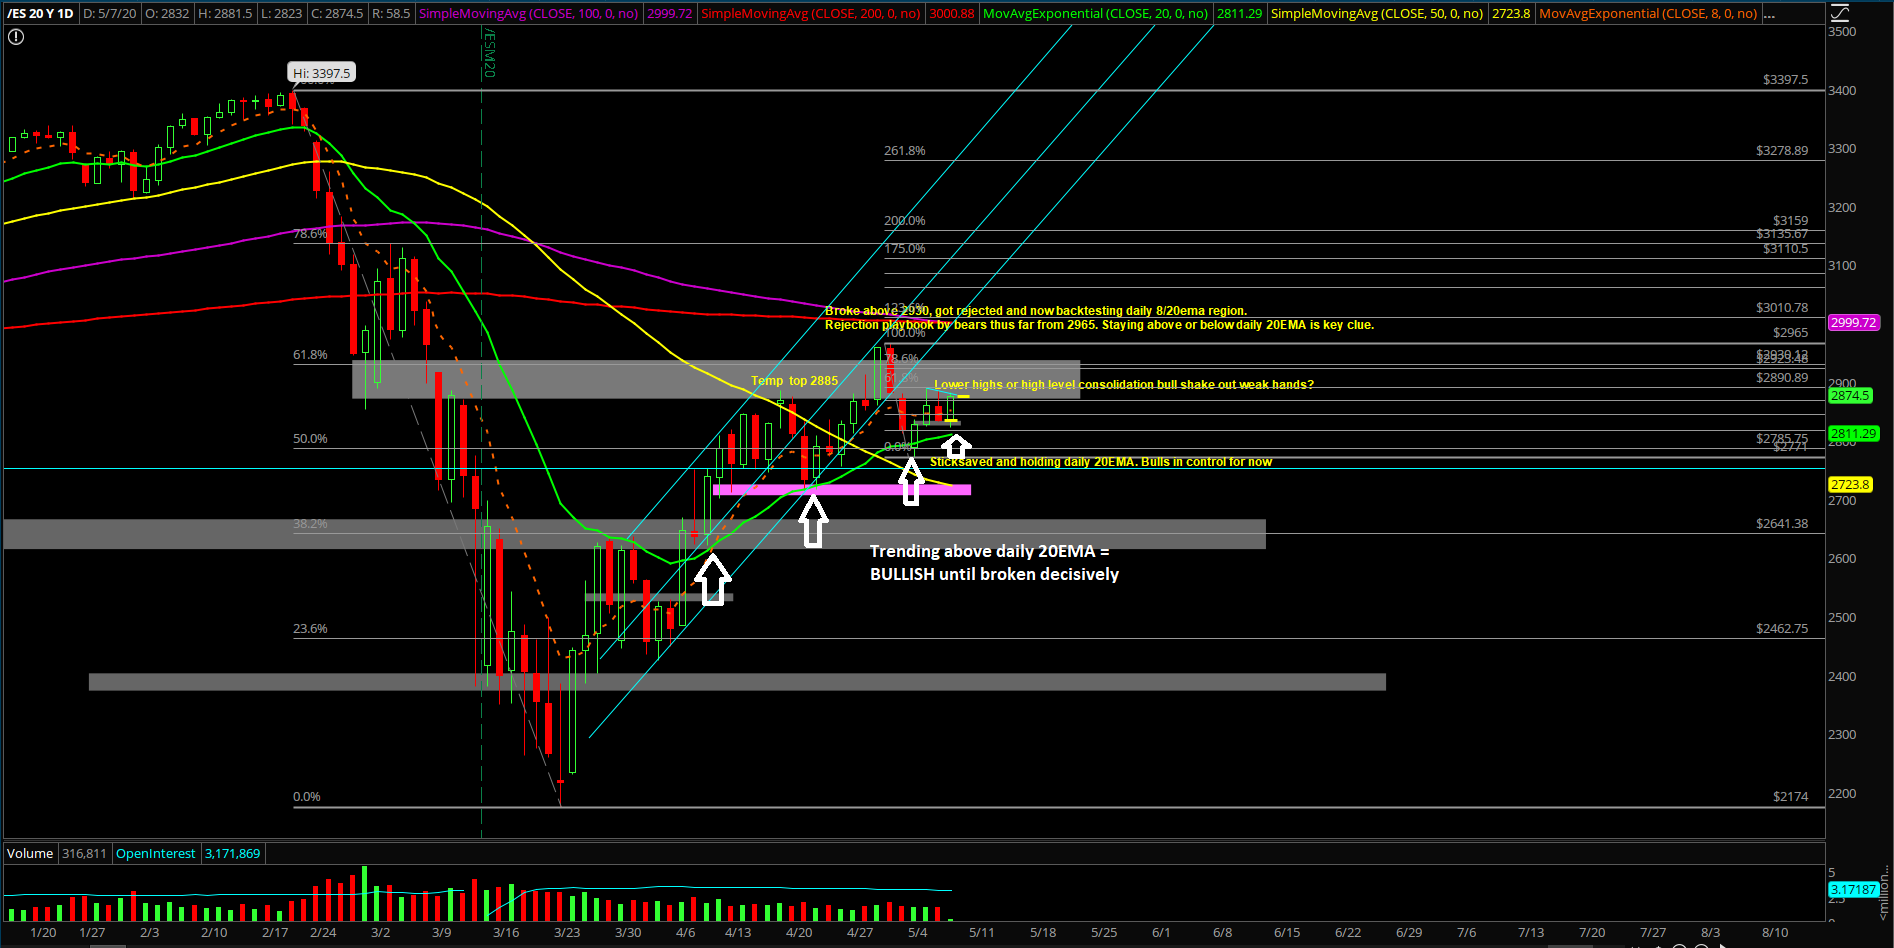
If you understand our thesis, the past 3 days has been playing a bullish consolidation pattern given the ongoing bull train/trend setup above daily 20EMA. This allows the market to trap in more market participants and then ramp higher. It’s a feedback loop of bears trying numerous times on breakdown, but they have failed countless times in the past few days/weeks. Every single backtest of daily 20EMA have been bought since the April 6, 2020 breakout. The bears are now running out of time based on our odds calculation and the current market structure as we head into Friday’s weekly closing print.
The main takeaway remains the same from the prior report that the intraday bulls had a textbook gap up and go structure, but after the RTH open when the countertrend bears mounted a successful attack in order to disallow the bulls from IMMEDIATELY continuing the trend higher.
This meant that bears are not truly dead yet as it’s still an ongoing battle within this consolidation zone, but they are fighting a losing battle given the bigger timeframes such as daily+weekly charts. Please be aware, the longer this consolidates/bull flags, then the chances become higher and higher for the ongoing bull trend/train given the context and momentum of the past few weeks. Bears are the ones running out of time right now, looking for an immediate reversal to the downside every single day and have been failing miserably at it.
What’s next?
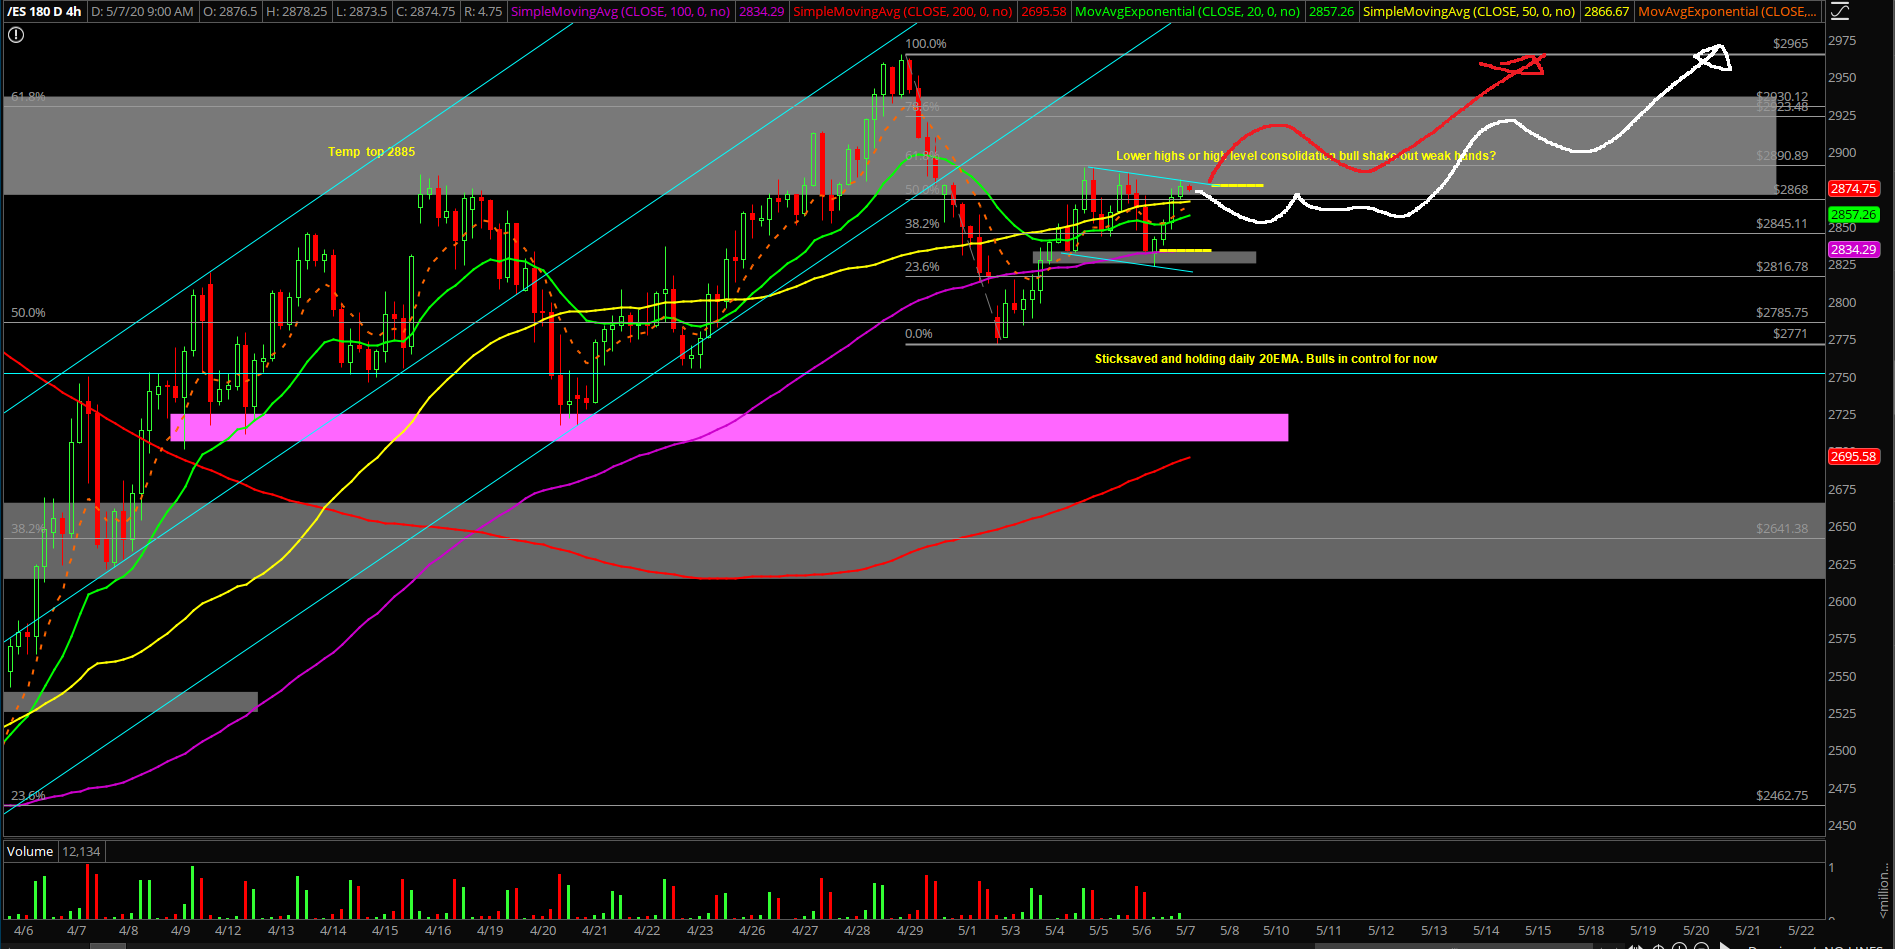
Wednesday closed at 2834 on the Emini S&P 500 (ES), around one of our key pre-determined levels at 2830 as the intraday bears sold off the market in the final hour of regular trading hours going from 2860 to 2830 swiftly. The daily chart timeframe is structure is quite easy. Price action is trending above daily 8/20EMA as bulls held key support on Monday and has bounced +100 points since then.
Summary of our game plan:
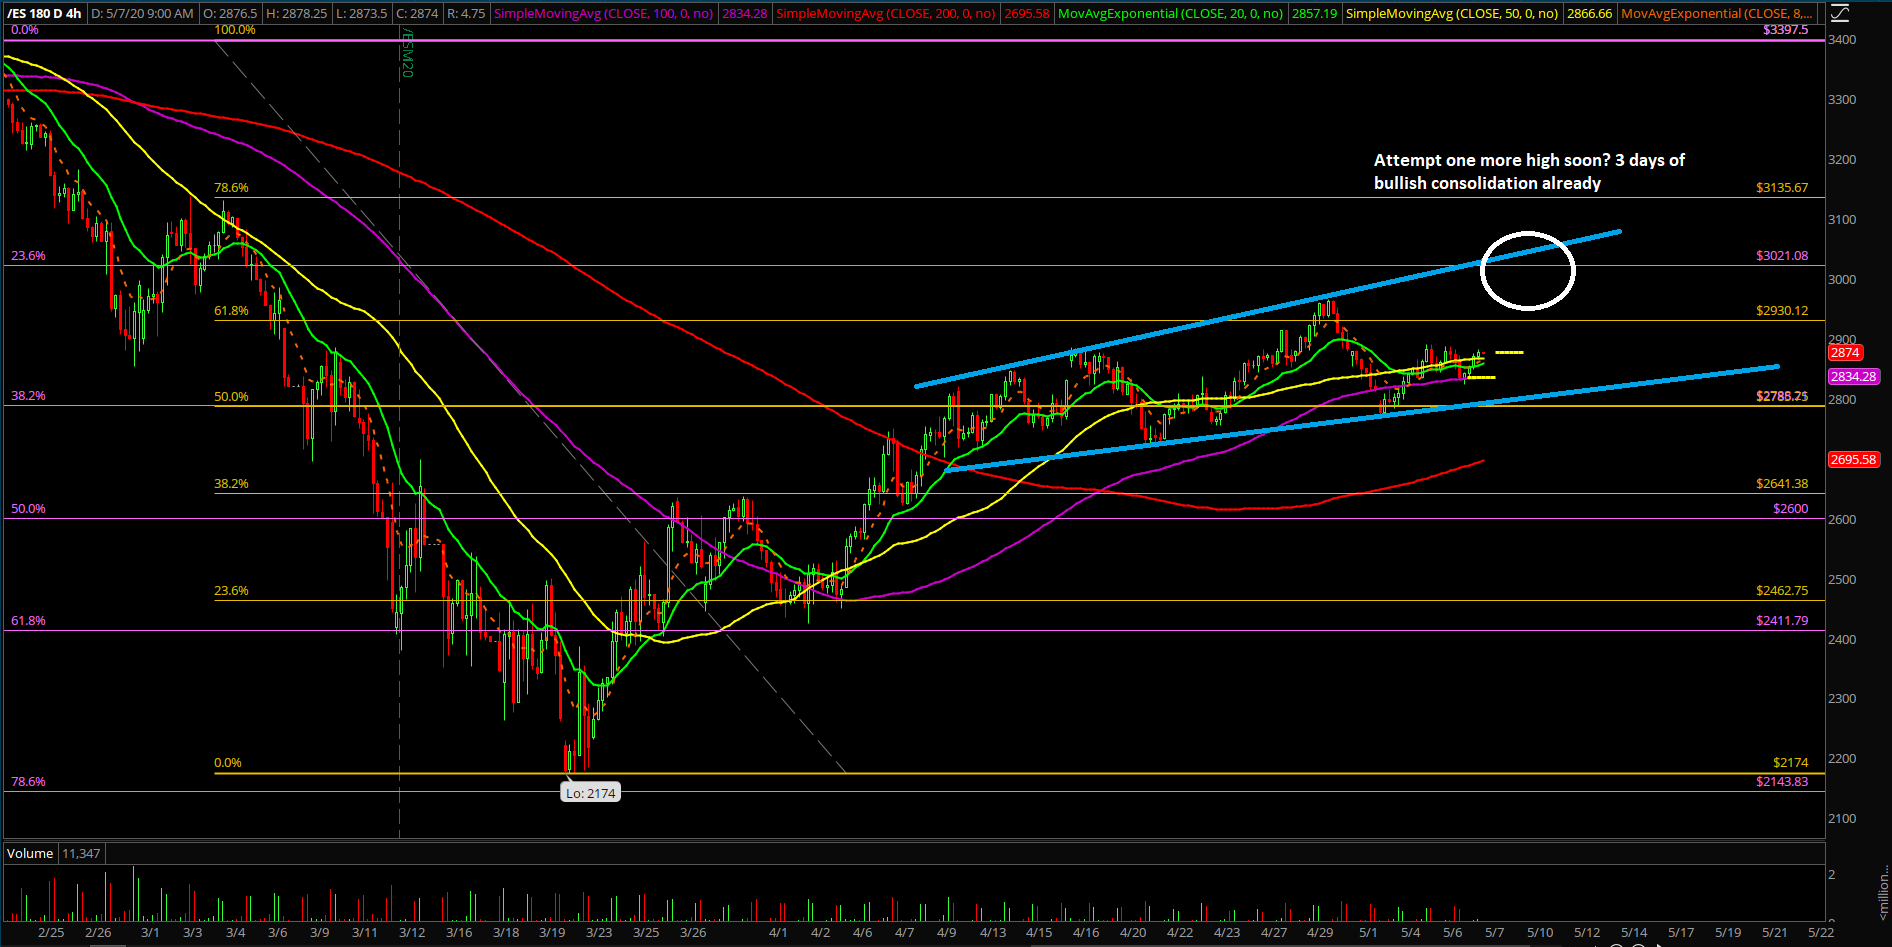
- 4hr white + red lines are our primary and alternative scenarios for now. Note: same end goal expectations when price action remains support
- For those that traded overnight using our levels, they should had accumulated long positions from 2830~ like our algo utilizing the level by level approach and leveraging the on-trend bullish setups when market is trending above daily 8/20EMA as discussed previously
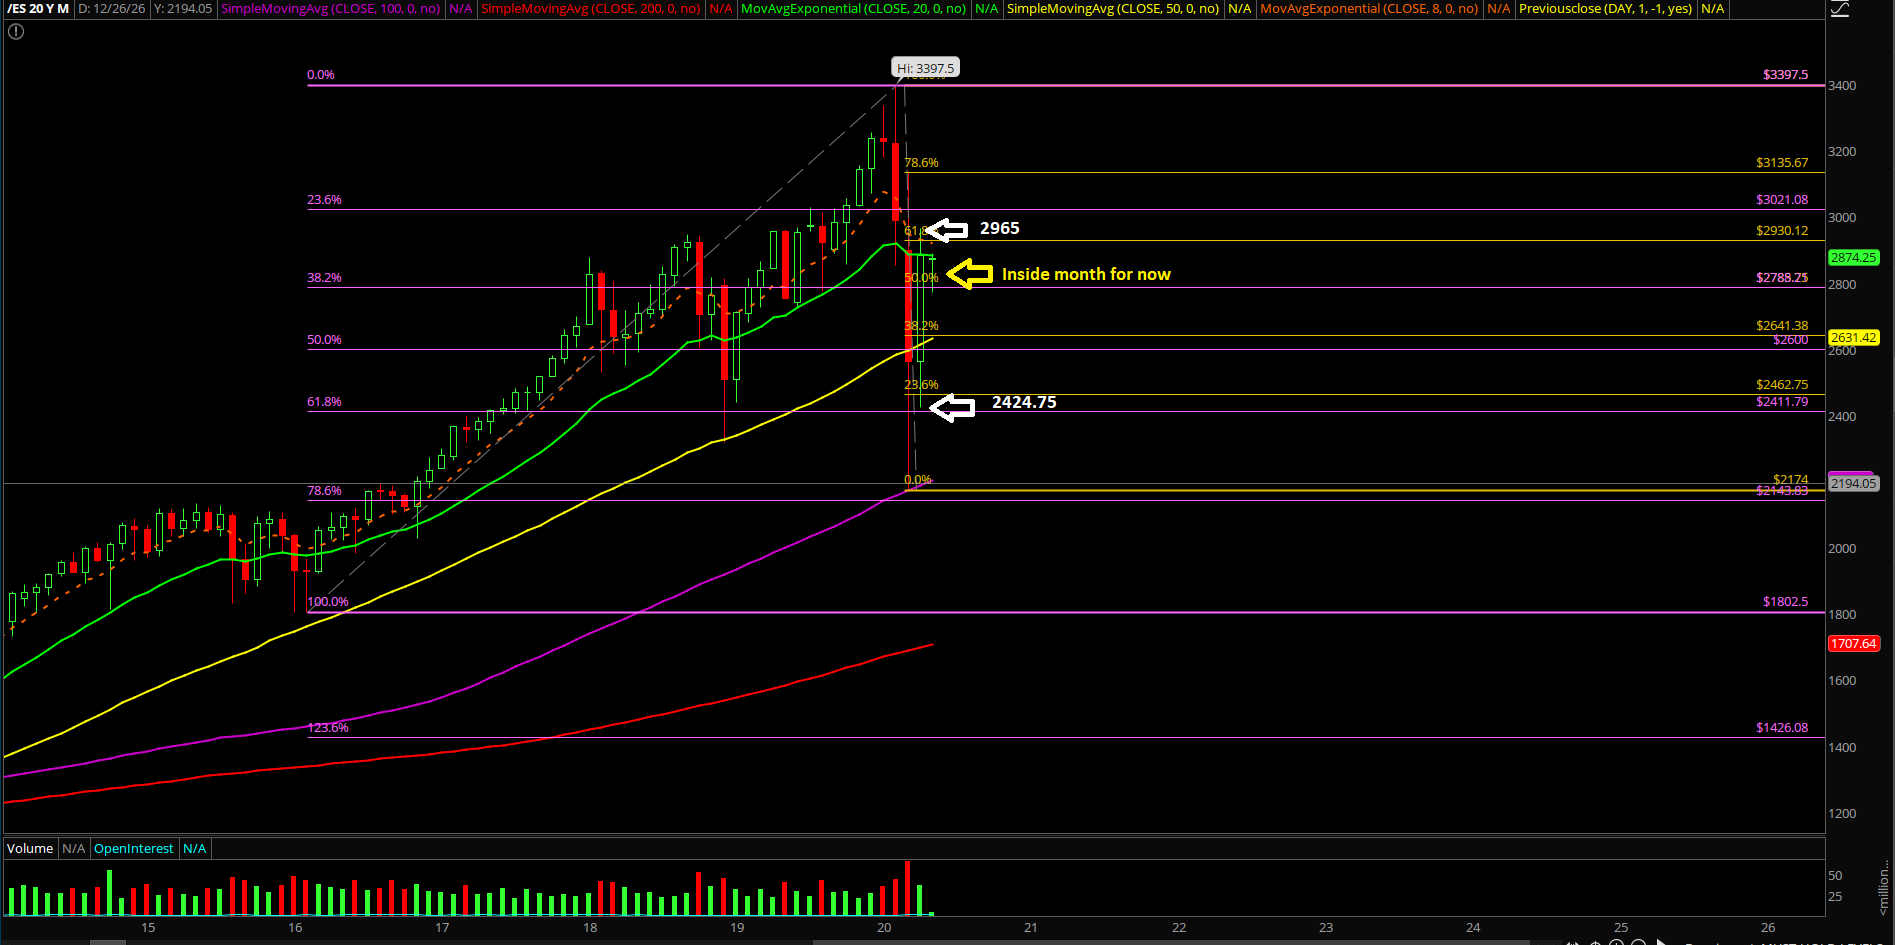
- Same things from yesterday: We’re bull biased, when above 2850, 2900/2916/2930 are the immediate continuation targets
- When below 2850, 2830 and 2800 support levels open up immediately. Level by level approach
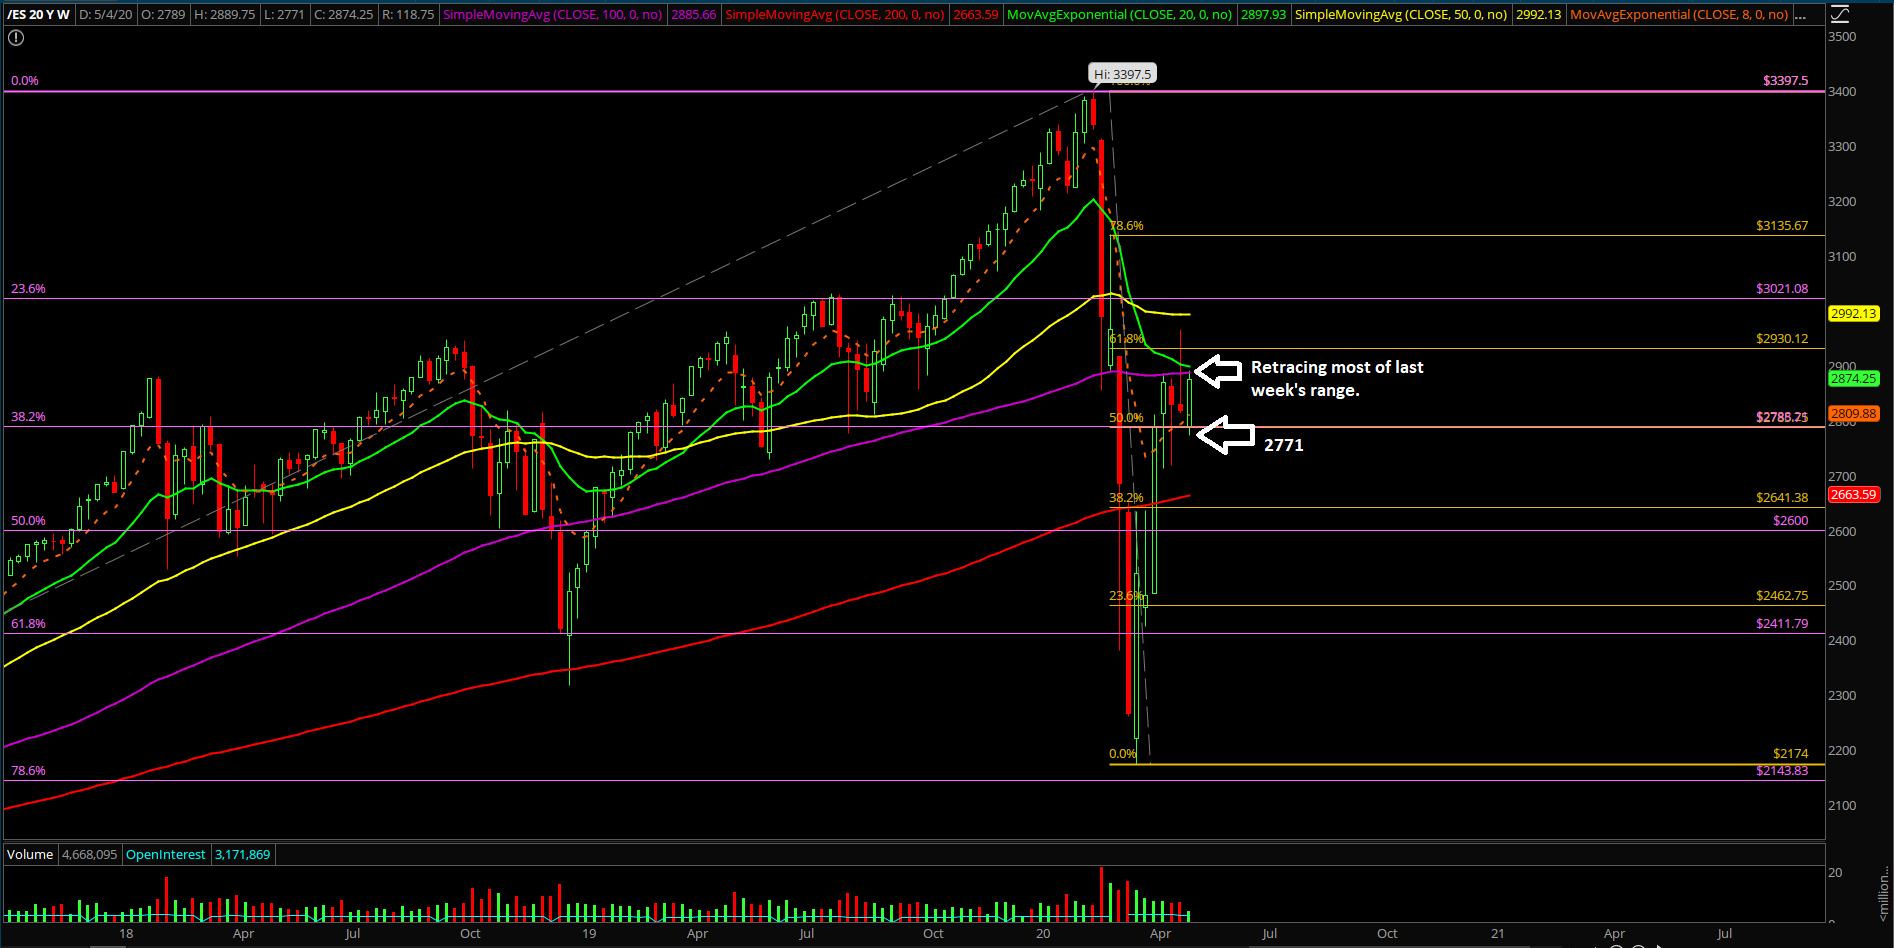
- There is an ongoing feedback loop squeeze setup from 2771 Sunday night low and yesterday’s RTH low of 2788.50. Remember our rule, do not fight a train/feedback loop squeeze until the momentum actually turns. Otherwise, you will likely get killed 80% of the time dependent on timeframes.
- 2771 Sunday low COULD be the low of the week already, unconfirmed, see how it develops.
- We are on hold for our intermediate bearish bias until there’s a decisive breakdown below 2752, followed by 2717 indicating immediate momentum aligns with micro+intermediate timeframes. Know your timeframes!