Bristol-Myers Squibb: Rotation Will Cost
 By
Levi
By
Levi
By Levi at Elliott Wave Trader; Produced with Avi Gilburt
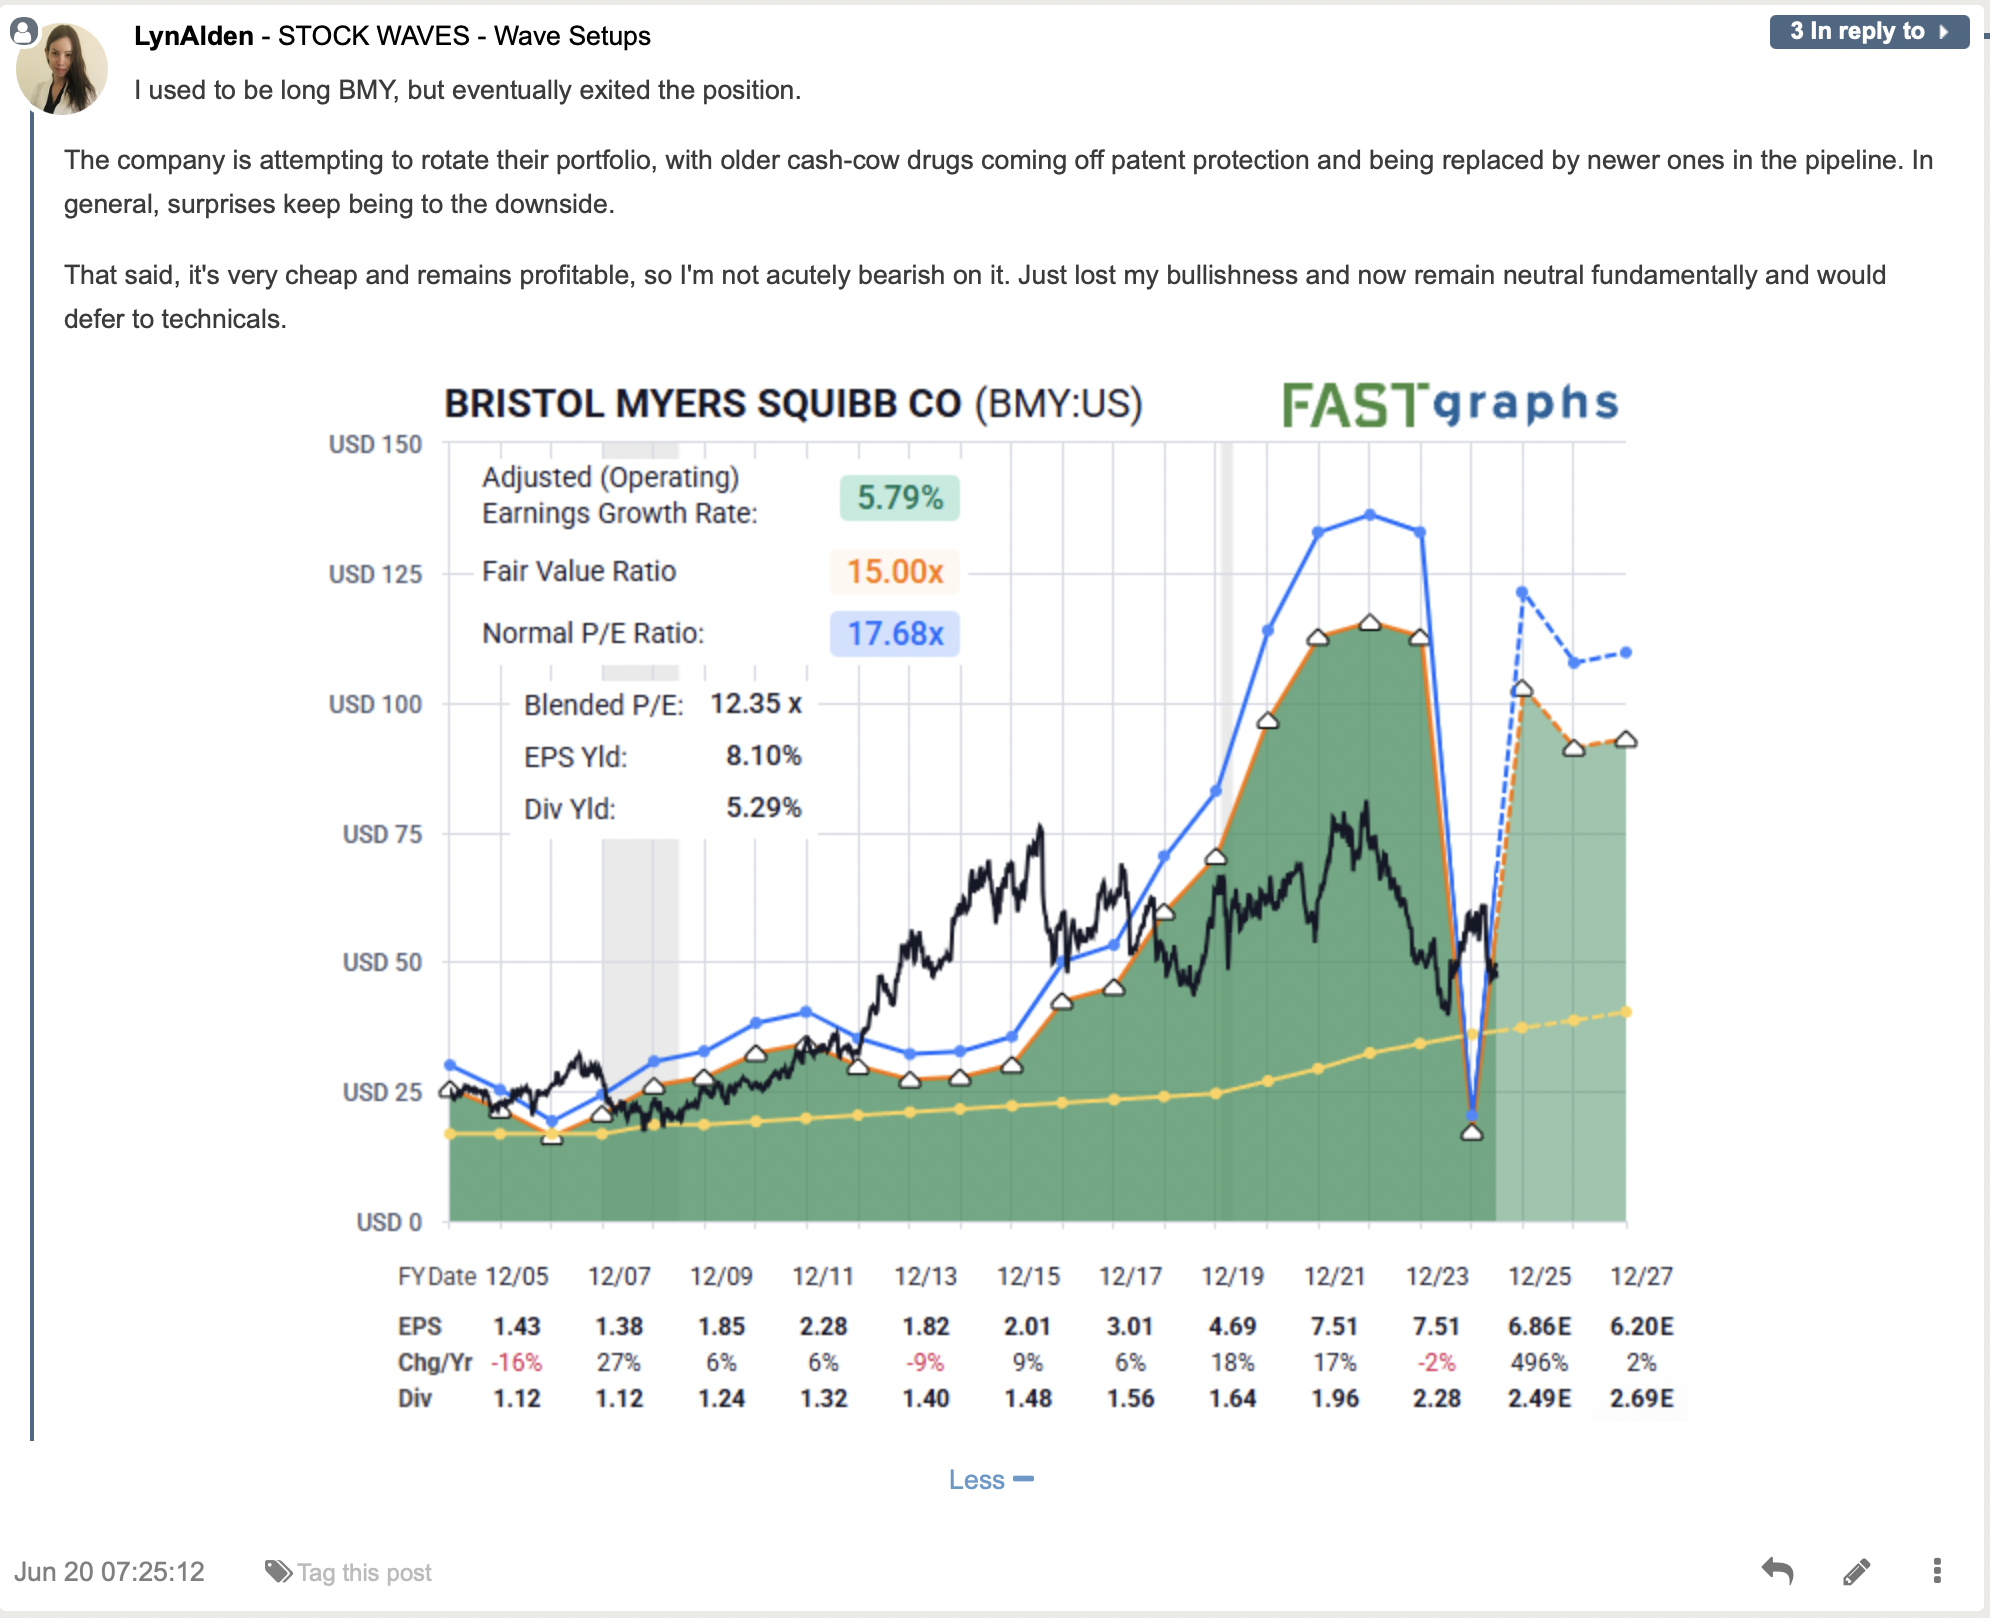
“Surprises keep being to the downside”. So summarizes Lyn Alden, our lead fundamental analyst, regarding BMY’s current status. But, eventually the stock would reach levels that would make it attractive from a valuation standpoint, right? Or, could this morph into a ‘value trap’ type of situation?
Let’s look at the fundamental snapshot with Lyn and then delve into the story being told by the structure of price on the chart. Lyn regularly shares deep insights, yet with elegant simplicity. Her conclusions reveal an understanding of a company’s current positioning and also provide guidance as to the big picture going forward. We can then match this with the study of sentiment to round out our opinion.
BMY’s Current Fundamental Position Suggests This Will Take Time
 When we are talking about the type of rotation that Lyn mentions, it will likely be a decent period of time to pass before a bullish setup materializes. This also suggests that “technicals” may be able the first to point out when this is likely to happen.
So we’ll use this premise and join it with what we are able to glean from the chart. To do so we must see where we currently find ourselves via the greater context. This means that we can zoom out and use this larger structure of price to project what is most likely next.
This Methodology Provides Context
What do we mean by context? The literal definition is something like this:
“The surroundings, circumstances, environment, background or settings that determine, specify, or clarify the meaning of an event or other occurrence.”
Now, let’s take that and color in the literal lines to give this a bit more understanding when it comes to the markets. Elliott Wave Theory is based on the fact that markets are fractal in nature. These structures are self-similar at all degrees. This means that the smaller structure should agree with the larger structure and vice versa. In fact, this is a way that a technician can ‘check’ their own work by making sure the subwaves agree with the larger context.
We know of no other type of analysis that can provide this method of location services, as it were. By identifying where we find ourselves in the larger structure of a stock or an index we are able to see risk versus reward in a given scenario. What’s more, it can tell us whether we should be aggressive or more cautious. What does the BMY chart tell us here?
Actionable Intel Via The Structure Of Price
Back in March of this year Zac put out a long-term chart of BMY that shows this structure in the larger rally up from the 2009 low. This is exactly what we are talking about when we reference the term ‘context’.
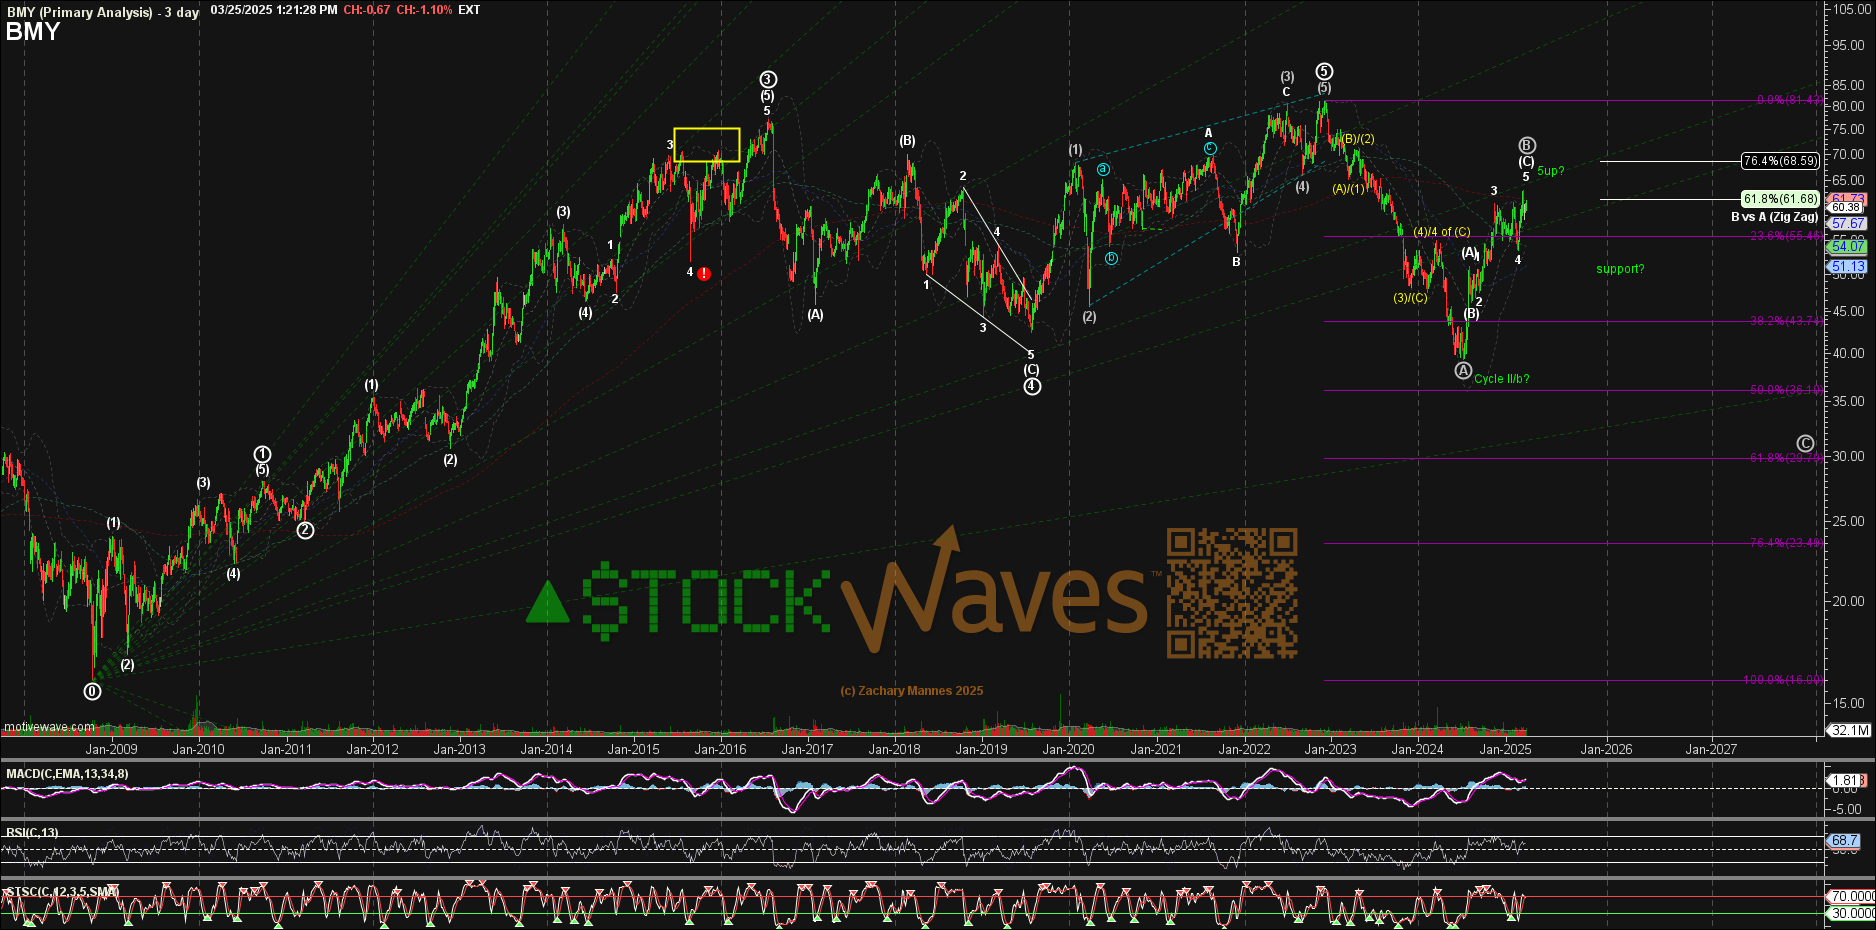
What do we glean from this chart? Note that we have a completed 5 waves up into the high struck in the beginning of 2023. Zac’s primary expectation is illustrated via the white path. There is an alternate, as is customary. As Avi Gilburt has written prior, this is much like a general preparing a battle plan with a primary scenario and an alternate should that primary deviate from expectations.
After this 5 wave rally structure that took some 14 years to complete, we would anticipate a prolonged consolidation and pullback phase. That appears to have started with the move down counted as Primary Wave ‘A’ to the low in 2024.
Now, with this context presented, let’s zoom in a bit to the near term expected path. On these next two charts you can readily see that our two lead analysts in StockWaves are in lock-step with the projected paths.
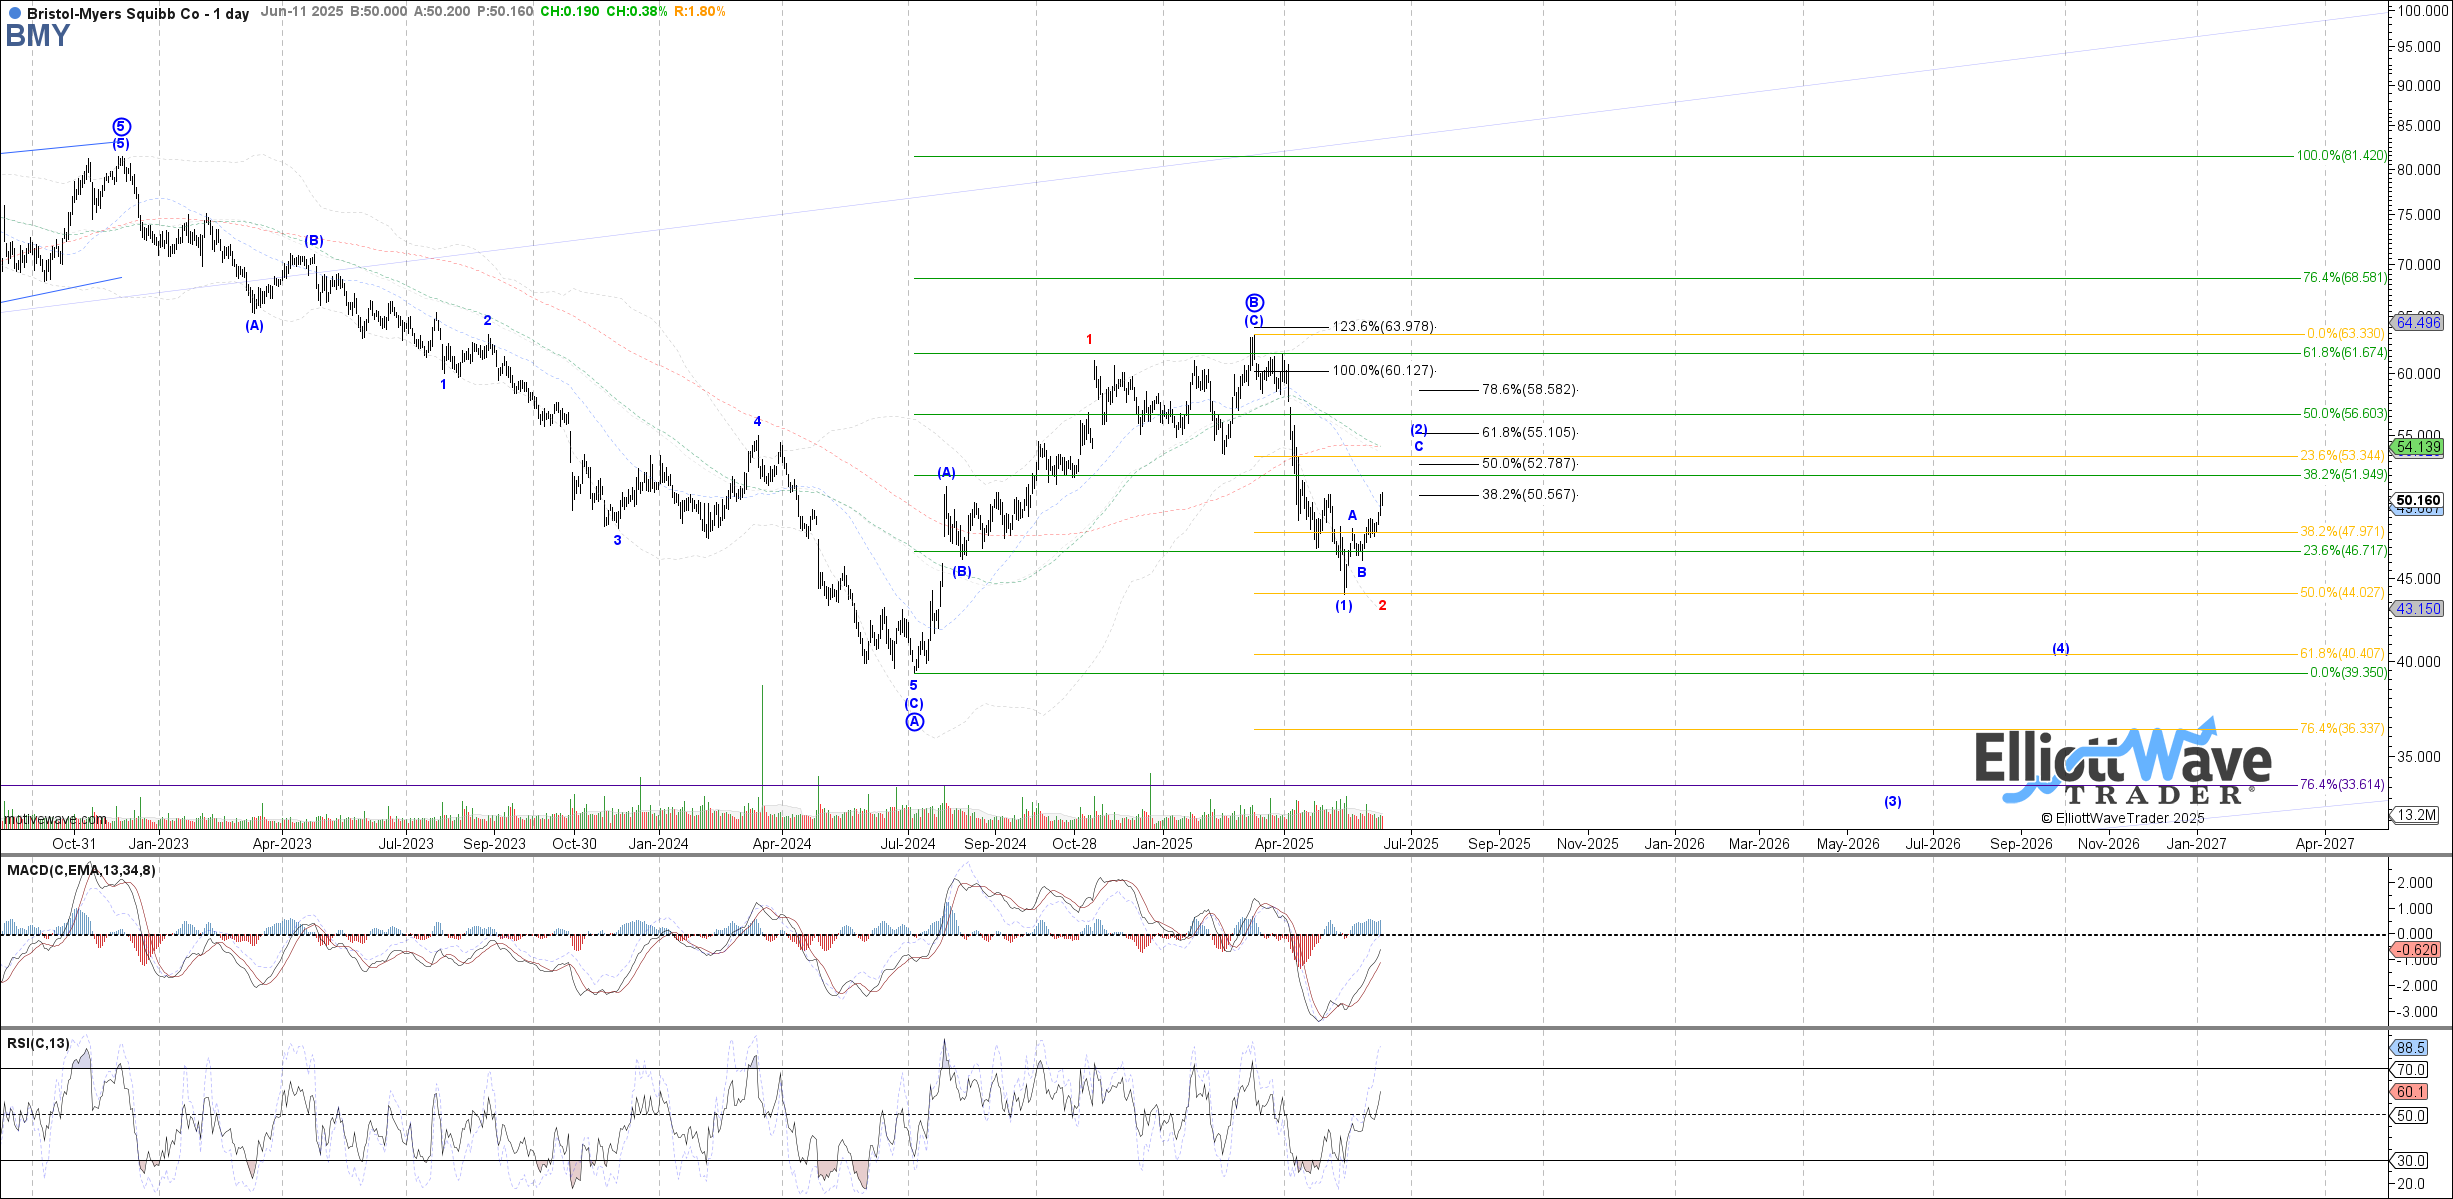
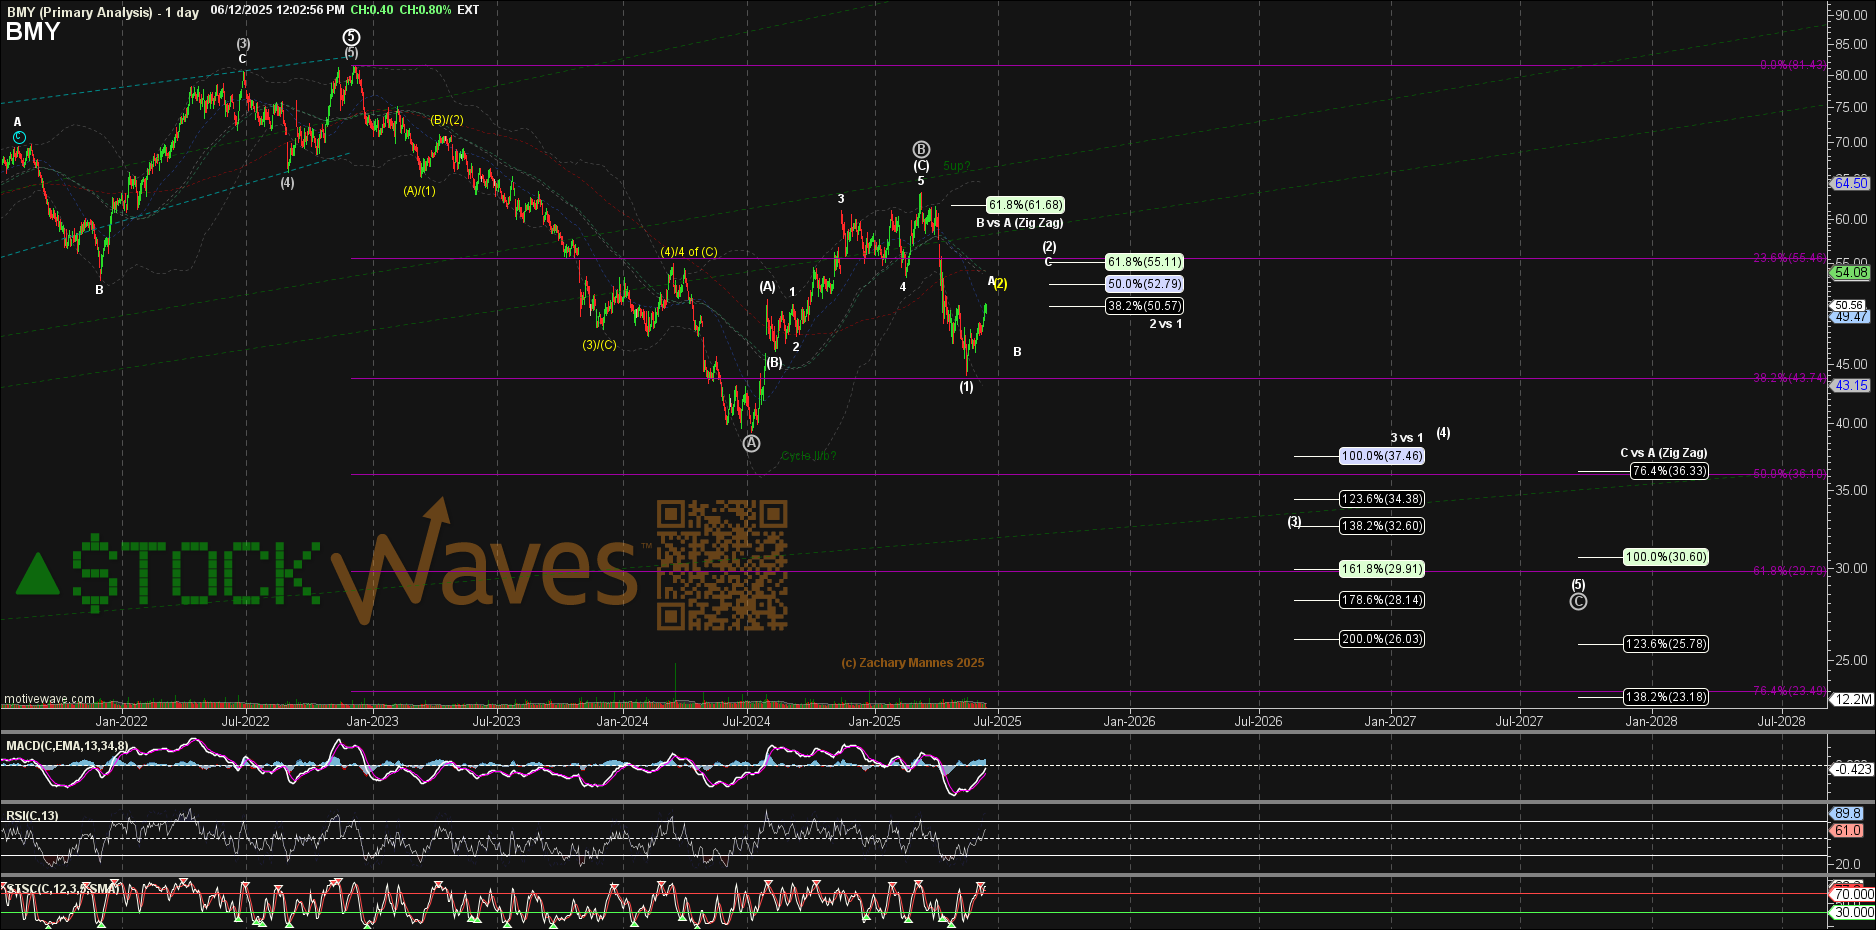
What’s more, we also have an on going Wave Setup with specific price levels to monitor going forward.
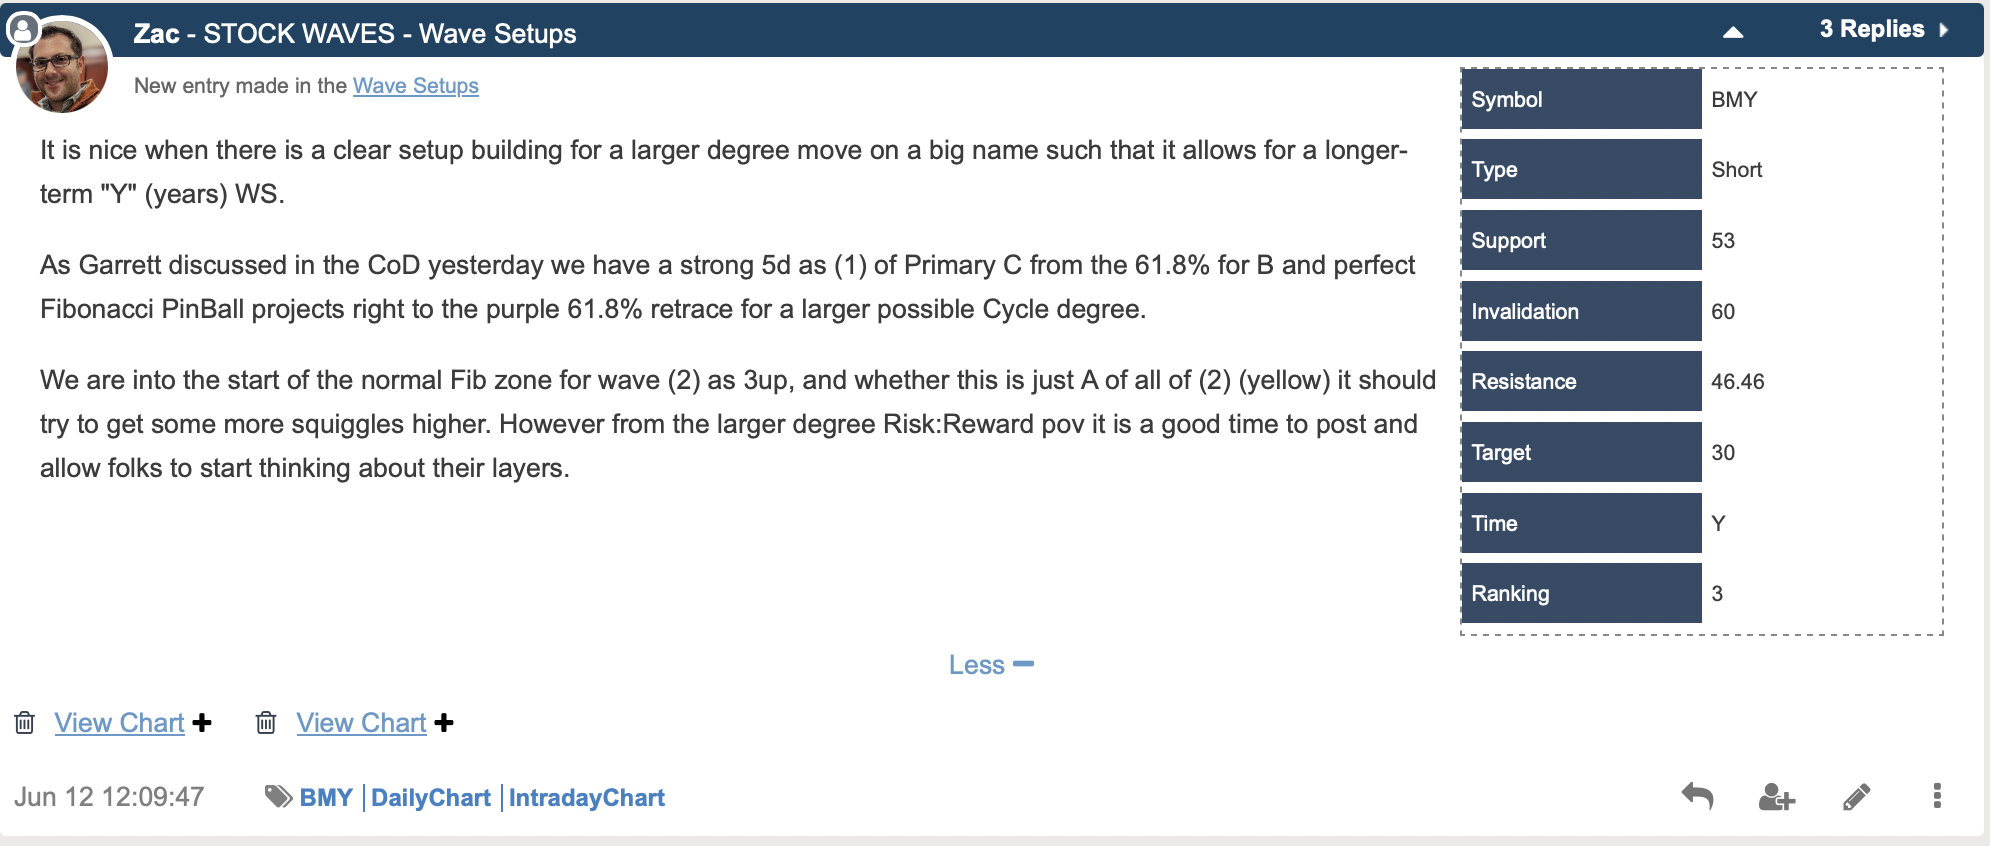
The basic summary here is that probabilities are pointing down over the next several weeks to months. We have our primary expectation and we can identify where this scenario needs refining or even where it might invalidate. That’s really one of the standout features for our members.
Does This Really Work? See The Results For Yourself
We will be the first to tell you the answer to that question: “Not always”. However, we have yet to find another analysis methodology that can provide context at any moment in time for the observed market/stock. Nor have we found another tool that can dynamically adapt in real-time to the markets as this does.
Over time with a large sample size of setups, you will come to appreciate the utility of this analysis method for your trading and investing. Of course not all setups are going to play out as illustrated. That is simply the nature of dynamic markets in action. This methodology will tell you when to shift your weight and when the scenario invalidates.
So, at times a setup can be wrong. The opinion of the analysts may need revision. It’s OK to be wrong - just don’t stay wrong. Does your current method tell you when to adjust your view when primary expectations don’t play out? We should be students and observers of the emotions ever present in the markets. But we don’t benefit from becoming participants in this sentiment.
We continually remind ourselves of this quote shared frequently by Avi Gilburt:
“Observers’ job, as they see it, is simply to identify which external events caused whatever price changes occur. When news seems to coincide sensibly with market movement, they presume a causal relationship. When news doesn’t fit, they attempt to devise a cause-and-effect structure to make it fit. When they cannot even devise a plausible way to twist the news into justifying market action, they chalk up the market moves to “psychology,” which means that, despite a plethora of news and numerous inventive ways to interpret it, their imaginations aren’t prodigious enough to concoct a credible causal story.
Most of the time it is easy for observers to believe in news causality. Financial markets fluctuate constantly, and news comes out constantly, and sometimes the two elements coincide well enough to reinforce commentators’ mental bias towards mechanical cause and effect. When news and the market fail to coincide, they shrug and disregard the inconsistency. Those operating under the mechanics paradigm in finance never seem to see or care that these glaring anomalies exist.” – Bob Prechter - The Socionomic Theory of Finance
There is much more education available in the articles shared with the readership as well us a plethora of resources at your disposal in our Help Section. Yes, there are nuances to the analysis. Once familiar with our methodology, our members discover a powerful ally on their side to provide guidance and risk management in their trading/investing.
