Breakout/Breakdown Levels To Watch As Market In Slow Grind Higher
 By
Ricky Wen
By
Ricky Wen
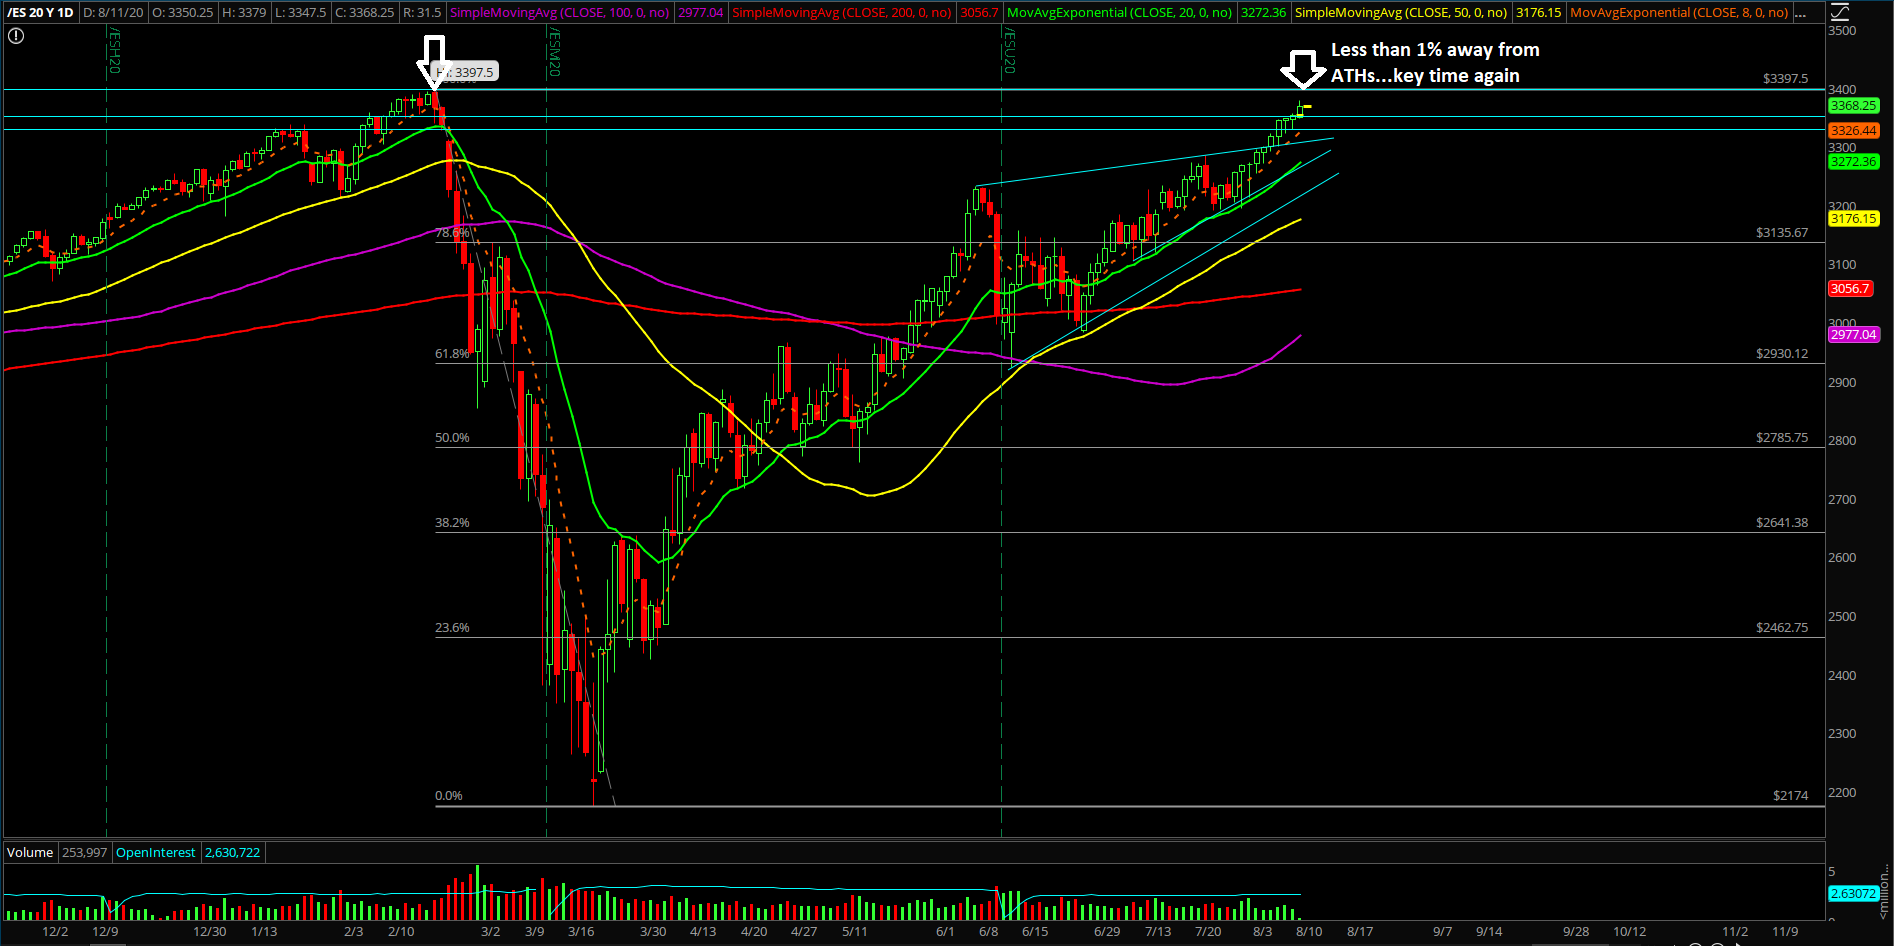
Monday’s session played out as a typical range/inside day as price action went from an intraday range high in the 3350s on the Emini S&P 500 (ES) to a low at around 3330 and then back to the 3350s high. Nothing out of the ordinary given that price action is just stabilizing in another basing setup in order to head towards the 3397.5 all-time highs.
The main takeaway is that ES price action is in a 9-day consecutive grind up towards new all-time highs, so market participants need to be careful as it’s been a one-sided battle. This is in combination with other indices trying to break out -- or in the midst of breaking out -- from their multi-month ranges. (RTY+YM mainly, NQ already new all time highs 3 months ago.) Keep utilizing the trending supports to your advantage and get out the way when/if they do not work anymore.
What’s next?
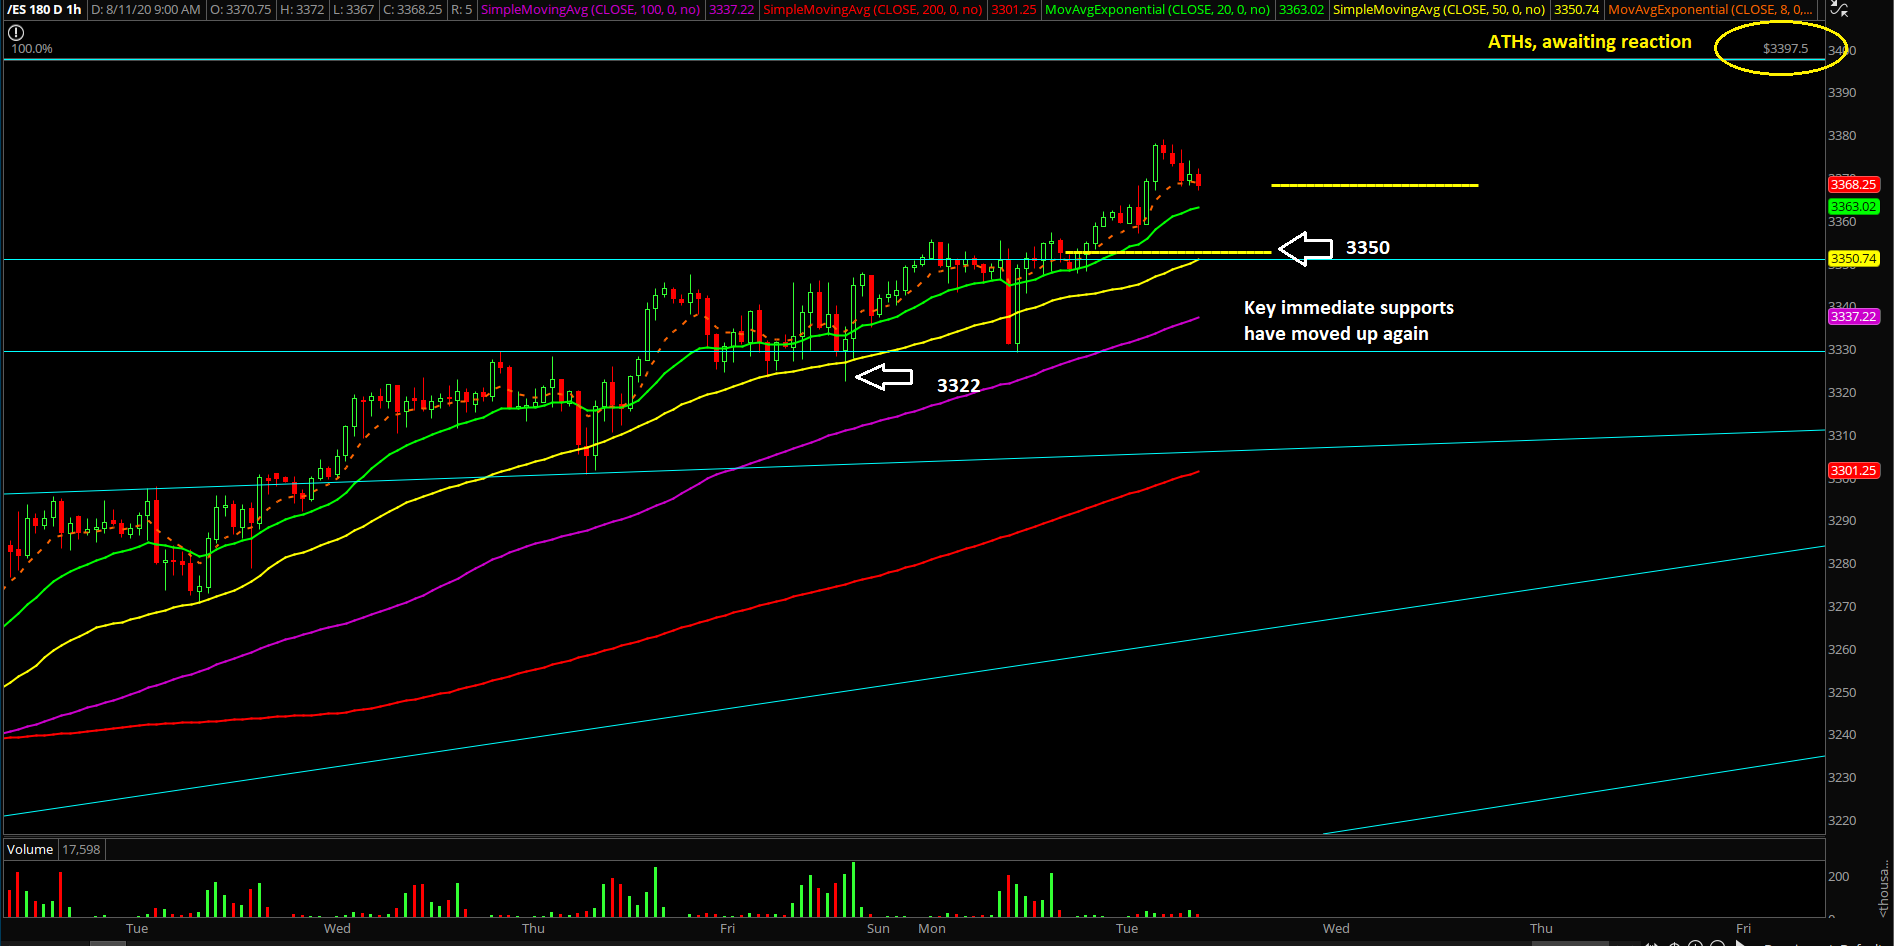
Monday closed at 3352.50 on the ES, as a doji-like candlestick on the daily chart indicating just a horizontal range consolidation within the ongoing context of the bull trend. Today is more of the same, just a range-bound, slow-grind environment, as current upside is limited to 3397.50 and downside is limited to 3322 until further notice or a dramatic shift in momentum.
A summary of our game plan:
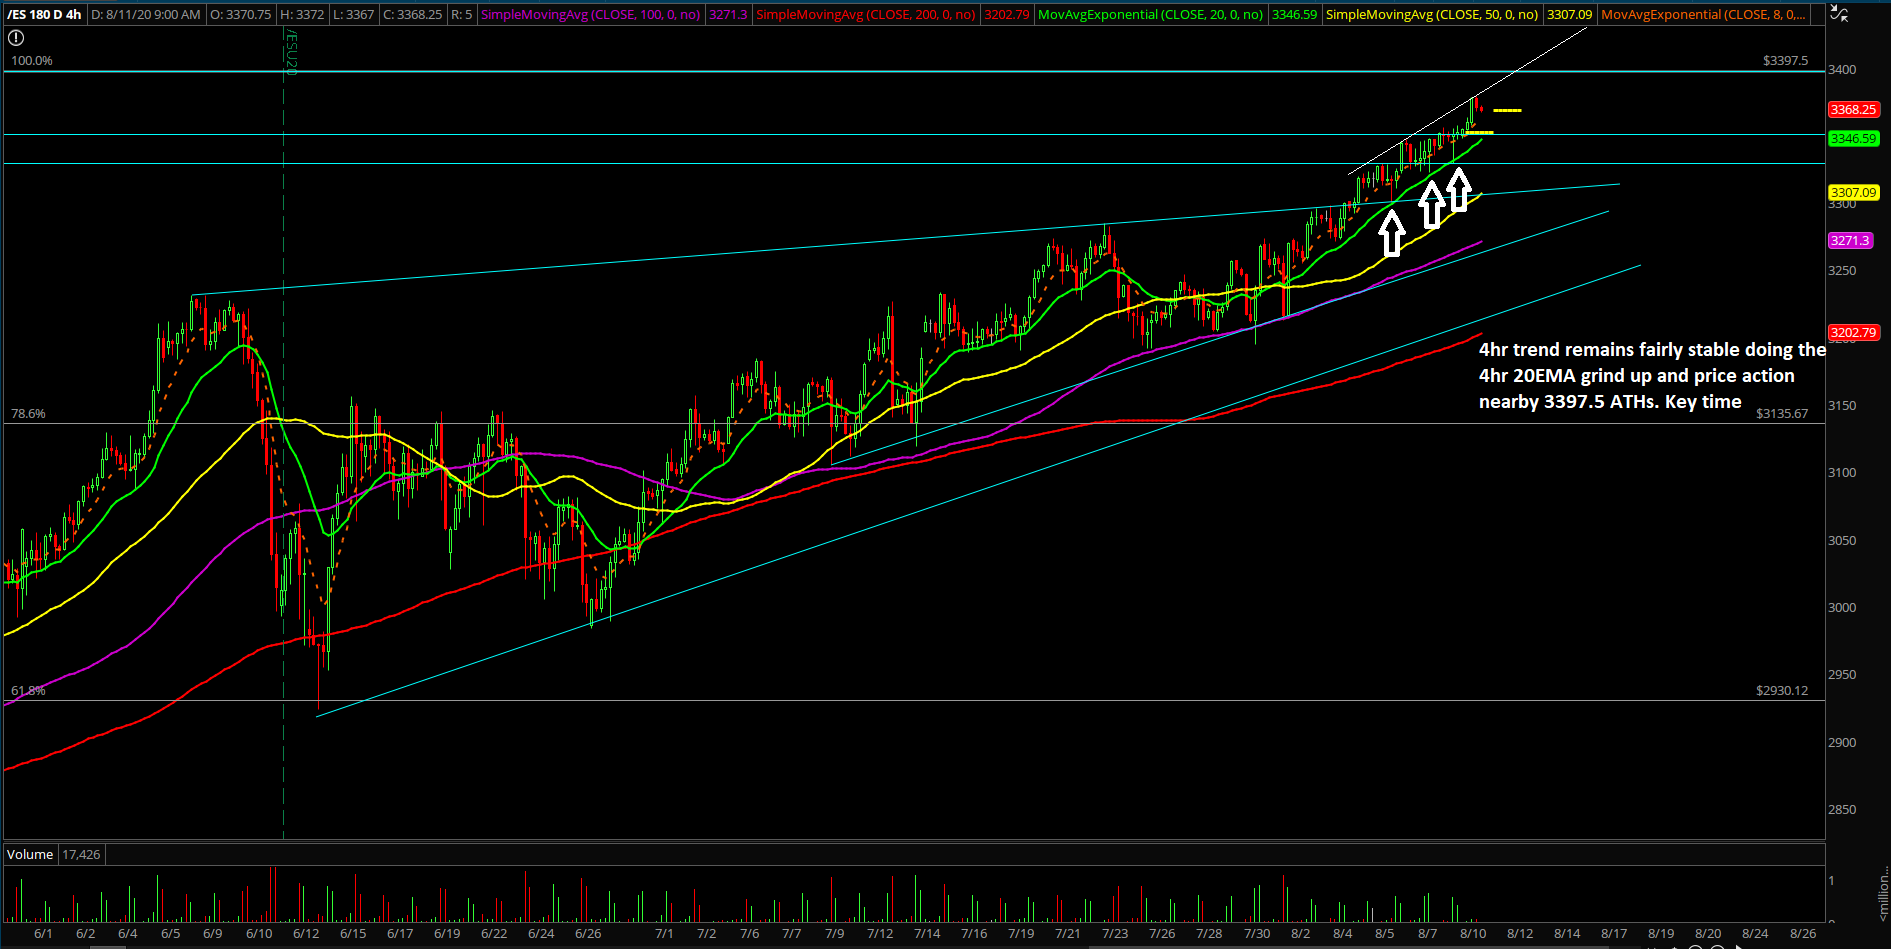
- Immediate trending supports have moved up to 3322 and 3350 where the former represents the Aug 7th low and the latter represents the prior key level that turned from resistance into support. Bigger picture wise, the important daily trending support has grinded up to 3270s and changing as price consolidates/hovers around highs.
- (*3347.75-3254.75 last week’s range, midpoint = 3301.25)
- Again, a sustained break above 3350 is needed to open up 3397.5 all-time highs and beyond for the next continuation target(s) because overnight did a decent first attempt with the 3355~ high as it fulfilled the 3350 target from last week. Yesterday and overnight doing a decent job of sustaining above 3350 so market participants must continue to watch the ongoing momentum.
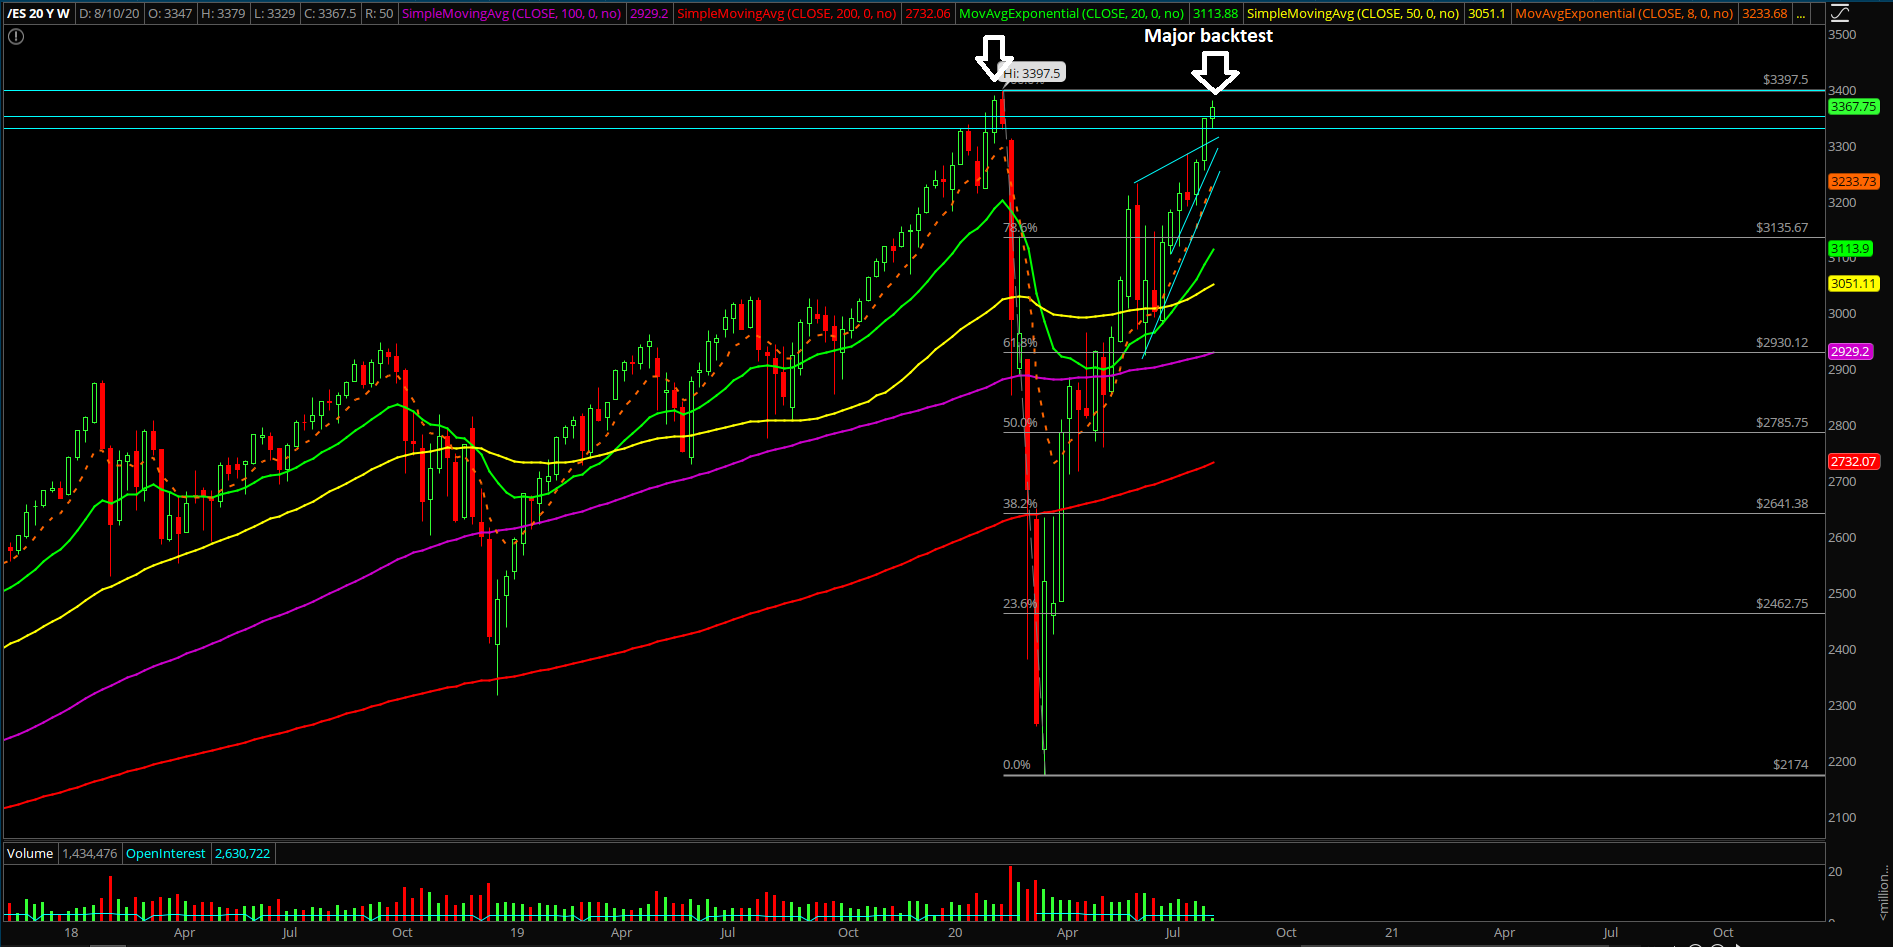
- If you recall, last week was an uptrend continuation week as bulls did what they wanted with the weekly closing print being able to close around the week’s high so this week is all about whether they can sustain the momentum on any pullbacks or do an immediate continuation.
- Friendly reminder, four out of four US indices are either hovering at the upper daily b-bands or above it since August 7th closing print, so being cautious of another consolidation/mean reversion must be noted or appropriate hedging vs lots of unrealized profits is not a bad idea.
- Our proprietary signals are still flashing warning signs to us on the sustainability of the current rise so we must be very careful here and utilize the trending supports to judge real-time momentum/odds in order to take quick profits here and there on our setups.
- In addition, we must keep an eye on the relative strength/weakness of big tech being a leader as this remains a critical juncture with price action keep hovering around the NQ 11050 mark area. This is in combination with RTY and YM at their respective resistance confluence zones.
- From Aug 3 report: Based on some of our proprietary signals and indicators, the on-trend bulls really need to cement a strong breakout this time towards 3300+ because it is getting to the point that everything is confined in a tight range and if they fail…the countertrend said could do a very fast and violent mean reversion. This is in combination of keltner channels, b-bands…etc getting fairly tight. This is a very critical region for the next few sessions as it could tell us a lot about the whole month of August’s roadmap/trend. *very fast and violent mean reversion = 12-15% that could expand as it progresses. No confirmation at this time yet.
- Essentially, an impulsive breakout needs to occur soon to disallow any type of big mean reversion attempts from the countertrend bears.
- Just need to be aware of first try rejection tendencies on major backtests like these vs ATHs as it’s fairly typical to get a big initial rejection/reaction. Price action is less than 1% away from 3397.5 ATHs so everybody should be on their tippy toes as we move forward.