Break Of GDX Support
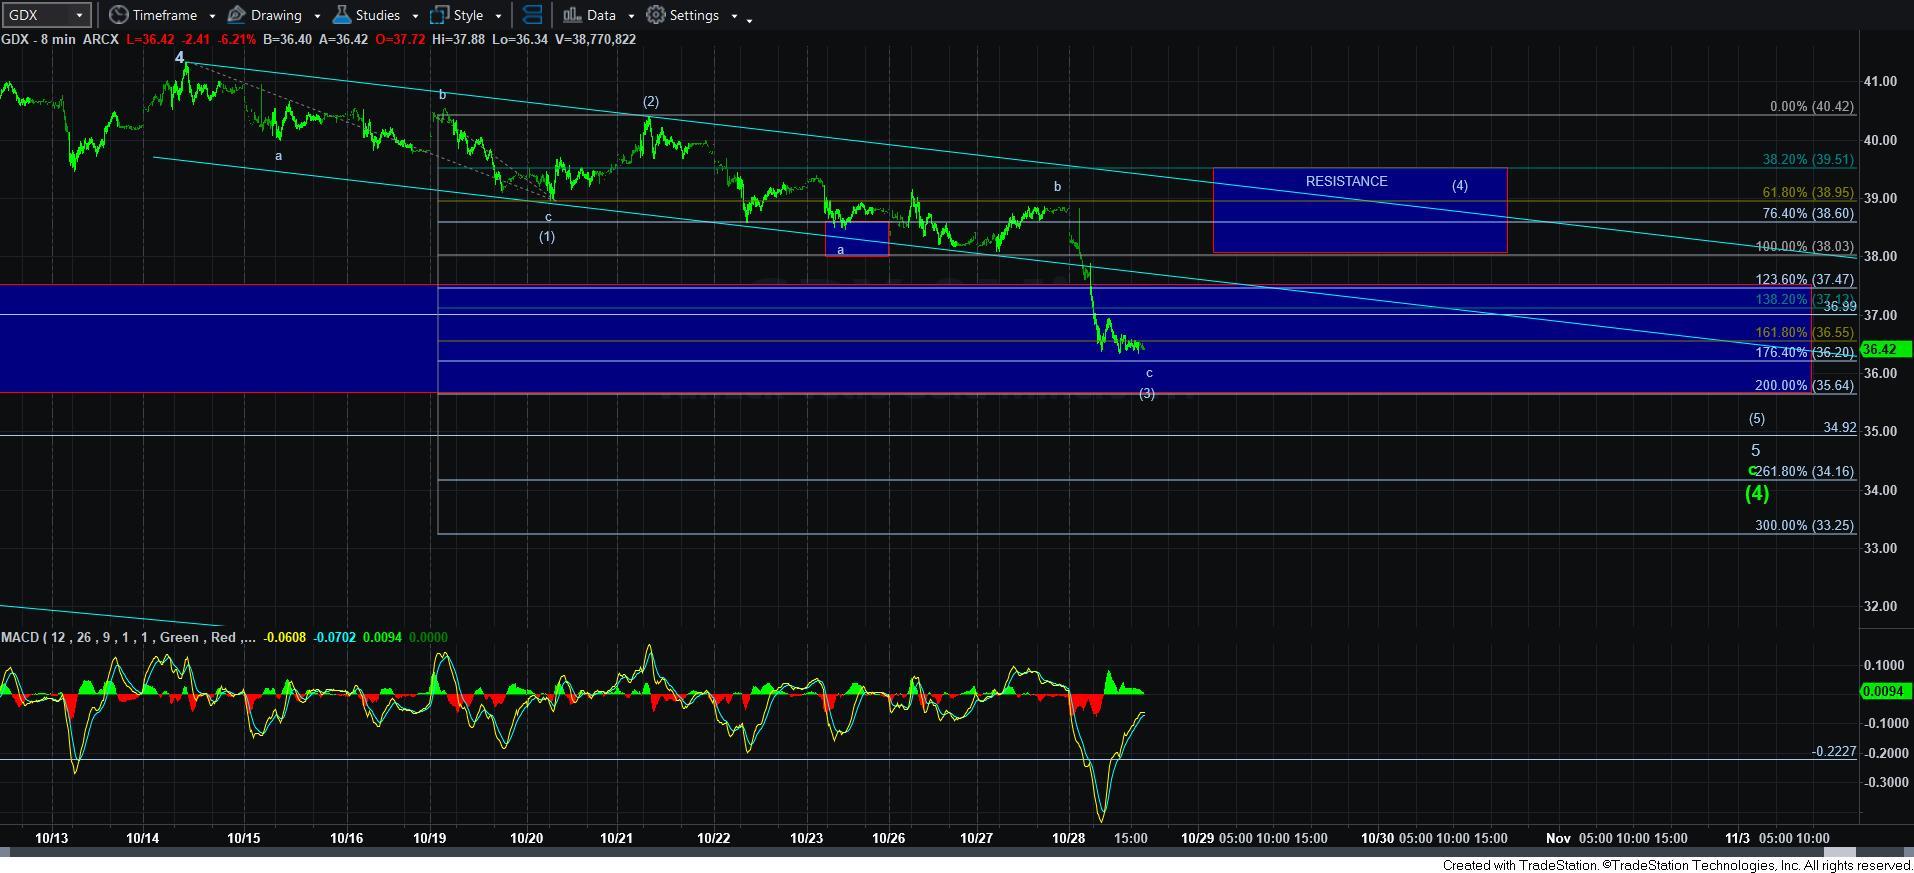
With the GDX simply unable to prove to us its bullish intention over the last two weeks despite a possible set up, our perspective of being skeptical was supported with the break down below the 38 level of support. And, as you know, a break of that level opened the door to the 35 region. That is still what I am seeking.
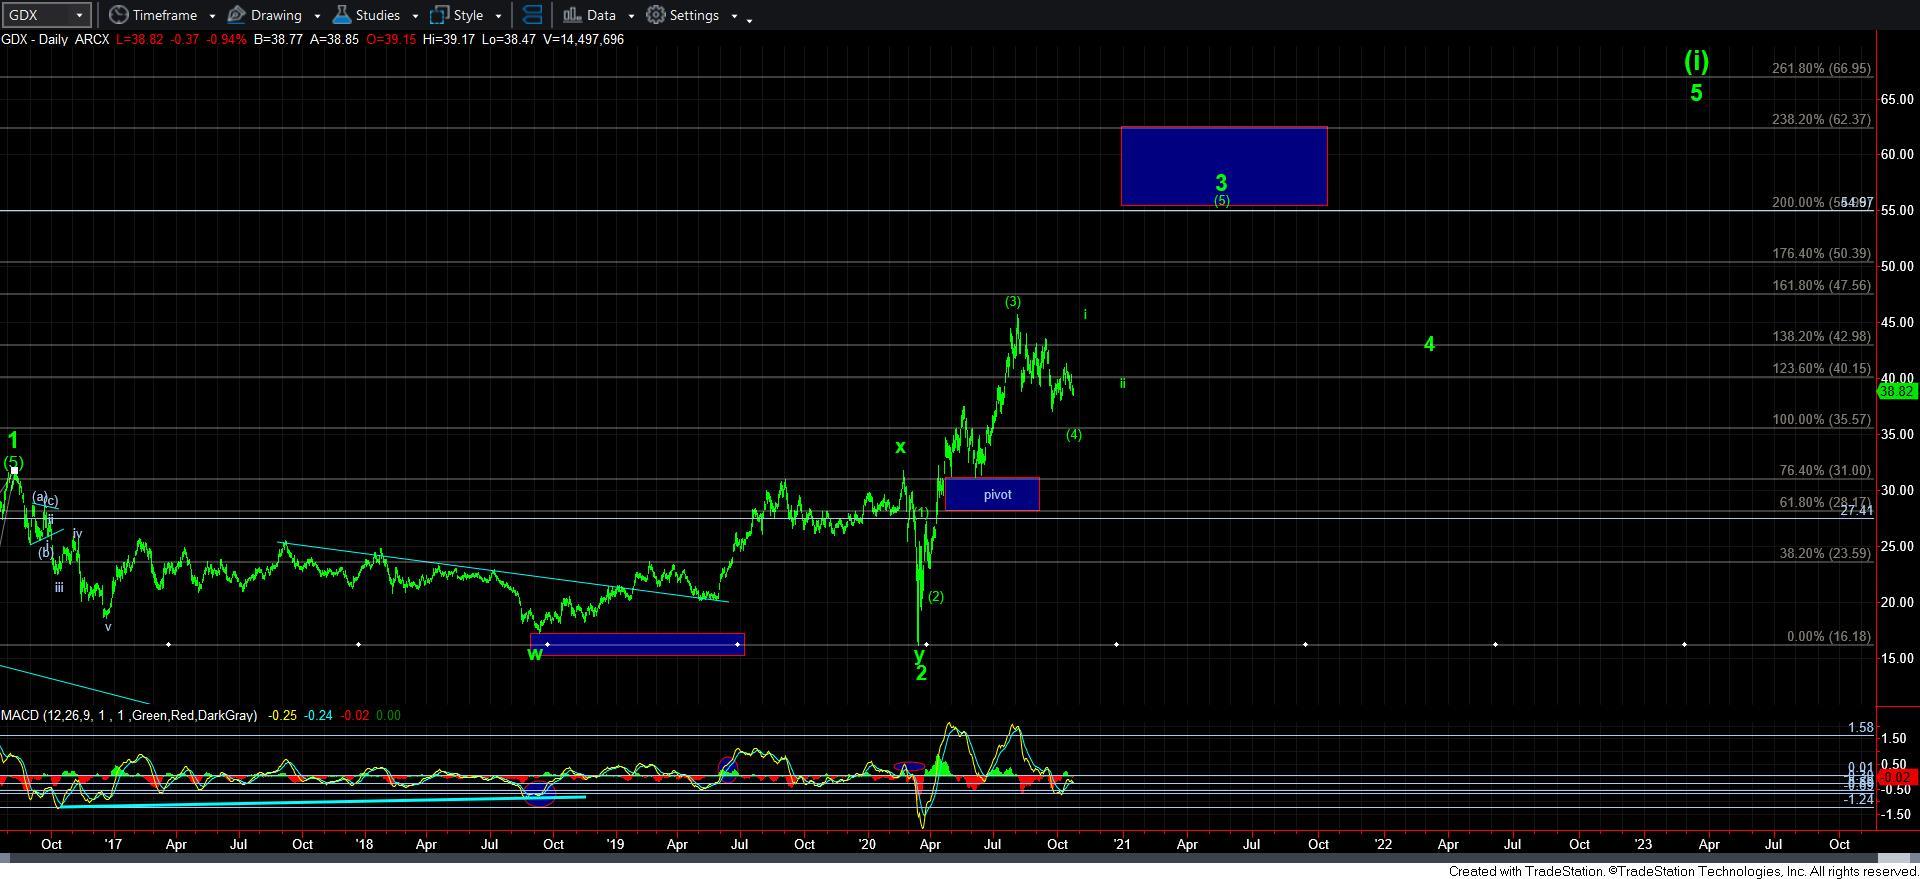
But, I have to note that the structure of this leg down is not exactly a standard Fibonacci Pinball structure, which makes me question whether we are seeing an ending diagonal down here. However, we view it, I have added a resistance zone on the 8-minute chart, and we will need an impulsive move over 39.50 to convince me that we have begun wave [5] of 3 to at least the 55 region.
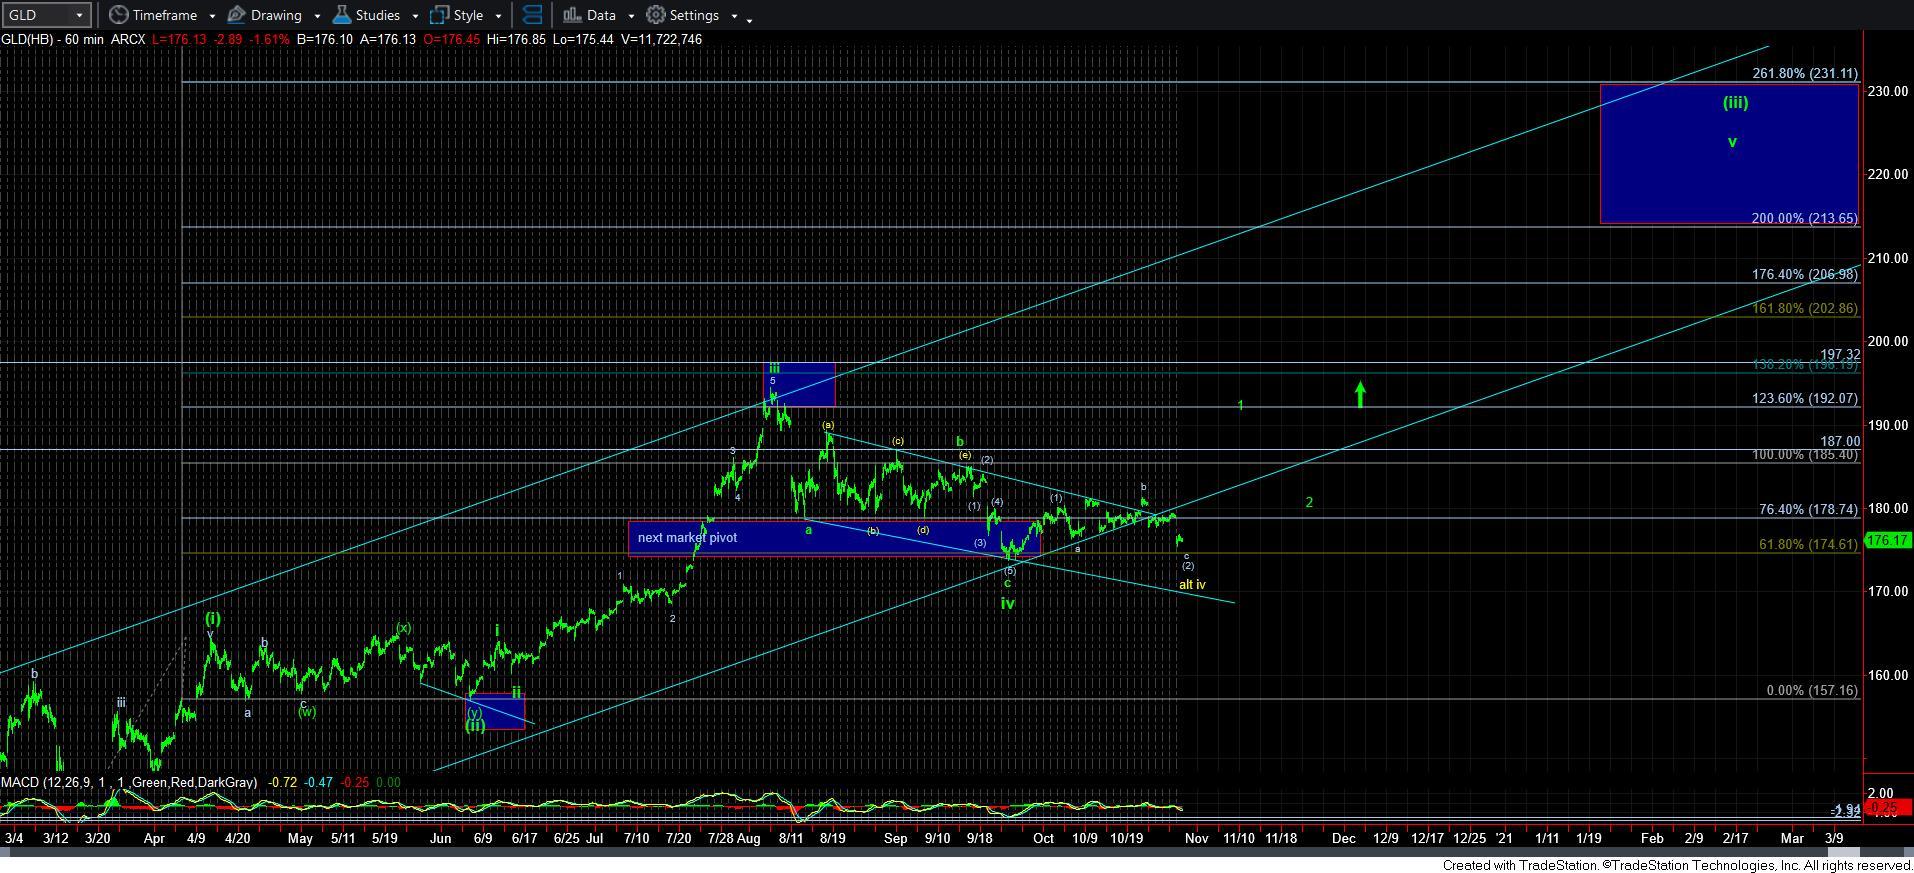
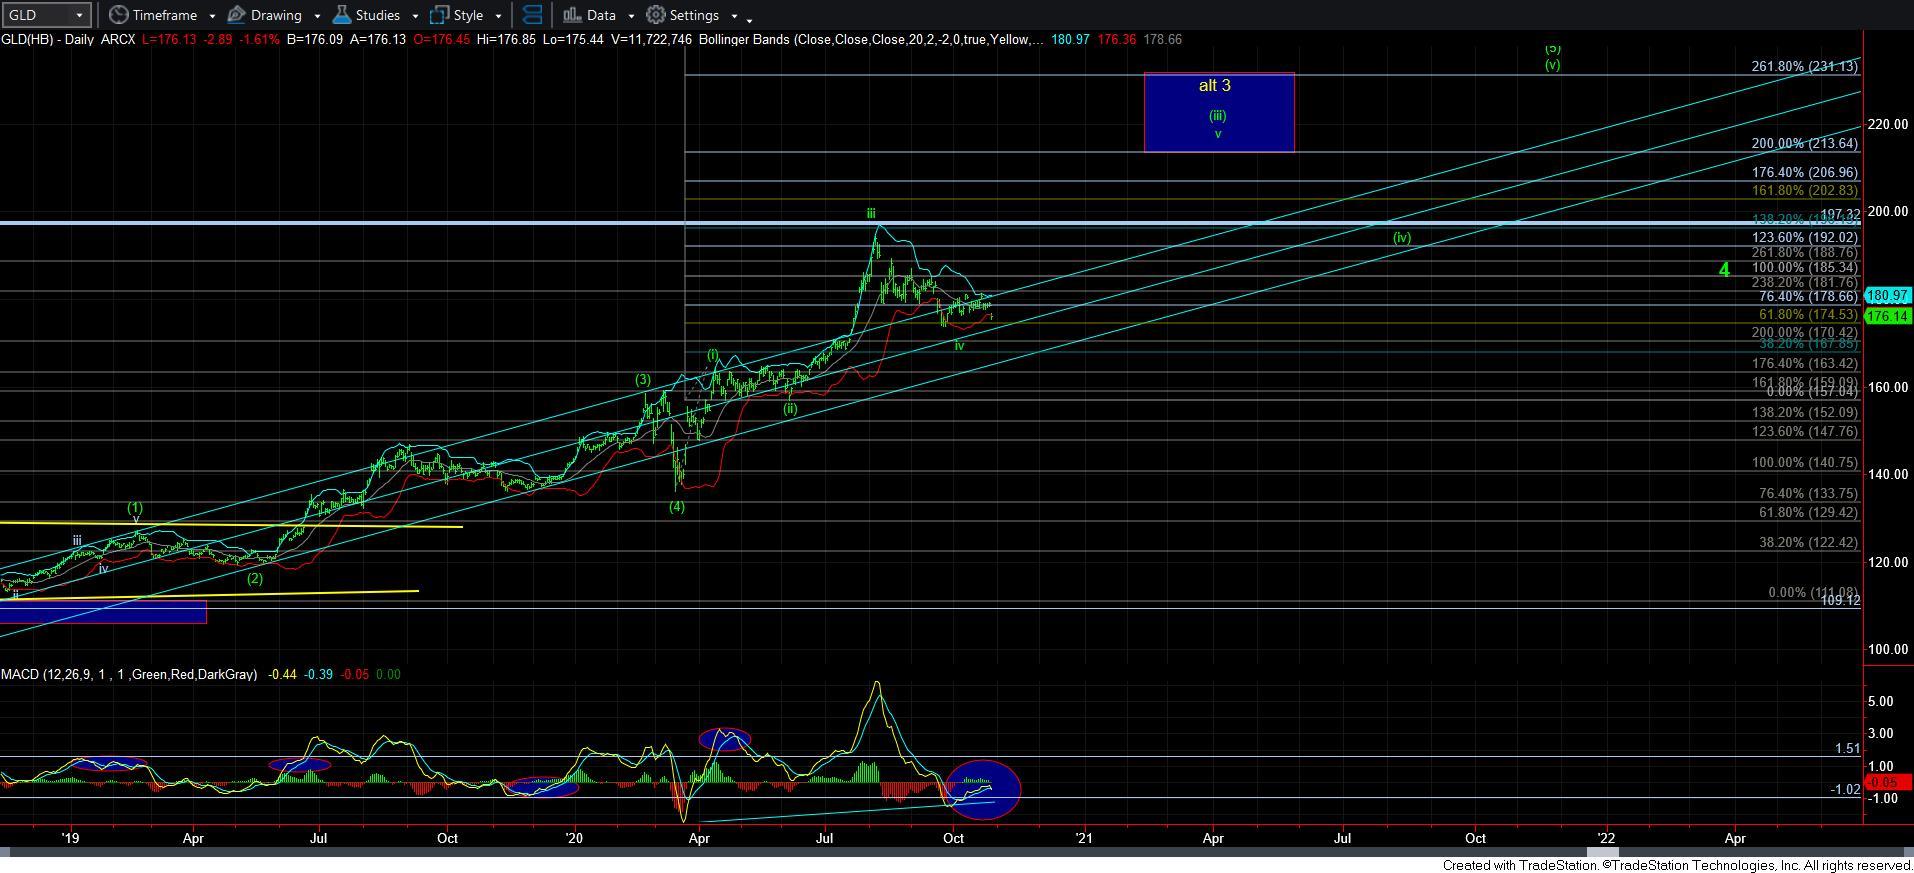
In the meantime, I know this may sound crazy, but both silver and GLD still would “look” best and count best as this being a c-wave in a 2nd wave pullback. Clearly, we will need to hold the prior lows for this to be maintained as the primary count, but I still have to view this as my primary count until we actually break down below the prior lows, which would suggest a deeper wave iv. But, ultimately, these counts really fit best for silver and GLD, again, for as long as we are able to hold over the prior lows.
In either case, I am still bullish as we look toward 2021, but would certainly be much more comfortable in that bullishness once we are able to exceed the resistances noted in our charts. Until then, I still think we have a bit more weakness to be seen with at least one more 4-5 in each of the charts.