Bottoming Levels to Watch In Nasdaq
 By
By
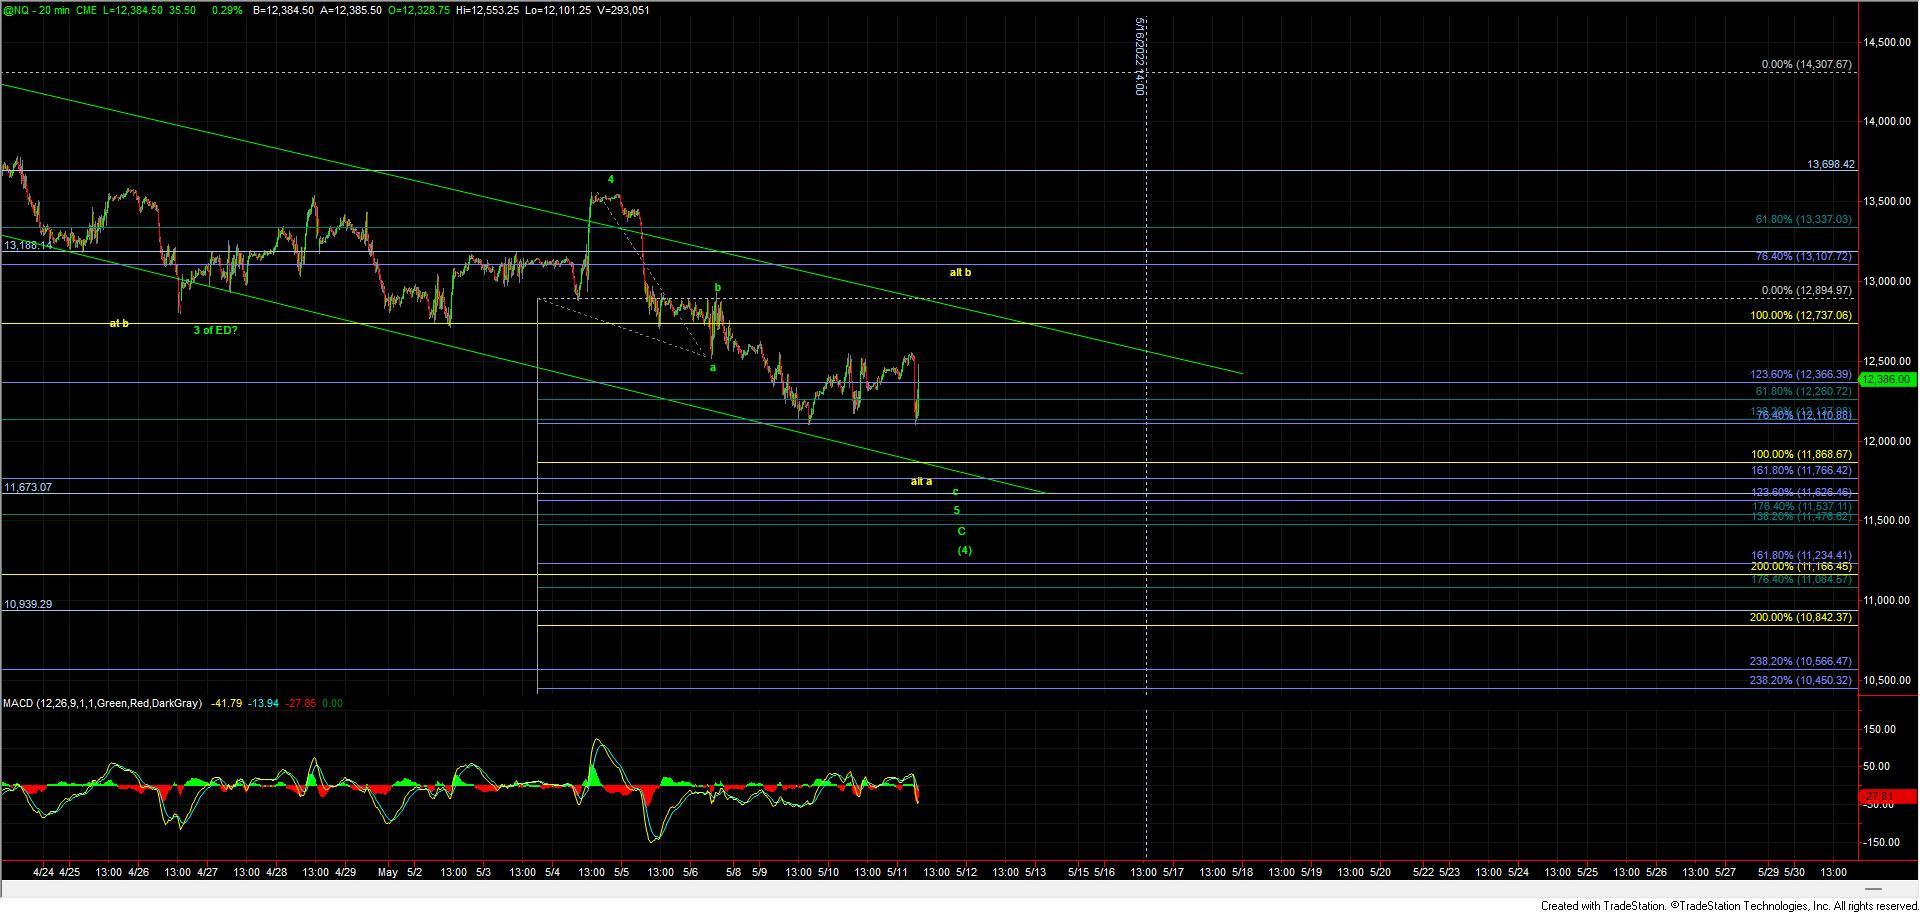
The Nasdaq 100 moved much deeper on the retrace and may be attempting a double bottom here or even another lower low which I could count as the bottom of the wave c of 5 of c fo (4). We would need to break over the 12894 level on the NQ chart followed by a break over the 13337 level.
If we are able to break over the 12894 level but not the 13337 level and then move lower, I would count the push up as part of the yellow wave b with this still needing another lower low before finding that ultimate bottom.
If we push directly lower without moving over the 12894 level first, then I would count this move as part of an extension of the green wave c and would watch the 11868 level as the next key support below as this is the 100ext of the green wave b.
Again, once this does bottom we should see a very strong reversal back higher as I am counting the entire move down off of the March highs as a larger diagonal for the wave (C) of (4).