Bottom In Place?
 By
By
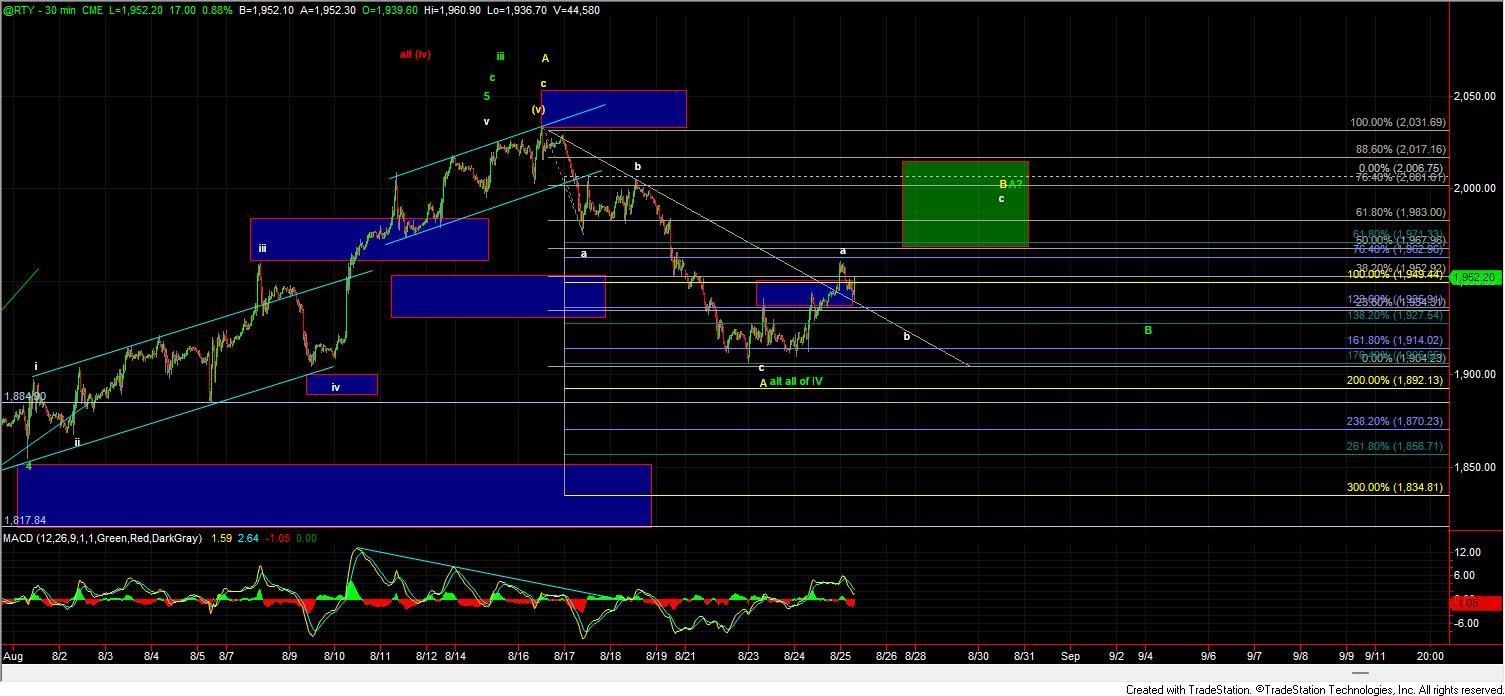
Just like yesterday the chart of the Emini Russell 2000 Index (RTY) is showing the best potential for a bottom being in place already. Today we have broken over the resistance level to signal that a bottom is in place as we moved over the 1949 level overnight and are now pushing towards the resistance zone for the potential wave B.
This part of the count is likely going to be quite sloppy and subject to a lot of twists and turns but what I am focused on here is whether we can hold under the 1967-2017 zone for the potential wave B as shown in yellow or whether we break out of that region to signal that the wave v up has begun. That being said even that path is likely going to be tough to track as we still could see another wave A and then B under the green path as shown on the charts.
So not until we get up into the resistance zone and then see the structure of the next leg down will we really have a better idea as to which path this is following. Until then this is likely to remain quite sloppy on the micro timeframes.