Bond Update – One More Point
I am going to reiterate all the points I made in last week’s bonus update, but I want to add one more point at the bottom:
It is not often that I provide a write up on bonds because it is not often that I see a good set up develop. The last set up I saw was back in November of 2018. If you remember that time period, the Fed was still well into its rate raising trend, and there was no signal whatsoever from the Fed that they would be changing direction. Well, there was a signal from the bond market.
At the time, I was saying that I would be a buyer of TLT in the 112 region, and I expected a sizeable rally from that region. The Elliott Wave structure was clearly bottoming out to me, and that is why I expected a sizeable rally. Yet, most considered me quite crazy for “fighting the Fed.” My perspective is that one should not fight the market.
At this point in time, there is potential setting up for what may be a multi-year rally in the TLT. And, it is also in complete contravention to the public expectations regarding the Fed. Again, we see absolutely no indications that the Fed is going to be lowering rates, as they have made it clear their intentions on tightening and raising rates this year. But, we may get a set up in the bond market which may force their hand.
You see, most people believe that the Fed directs the market rate of interest. That is absolutely false. The Fed follows the market, as does every central bank in the world. When they fight the market, they are completely helpless to change the direction. But, when they follow the market, it seems as they are in charge. And, I have attached some charts below that prove, based upon history, that the Fed indeed follows the bond market and does not lead.
Over the years I have outlined numerous examples as to when the Fed fought the market and lost. The most recent time being during the February and March of 2020 melt-down. The Fed acted four times to stem the tide, but the market continued to crash until it reached the 2200SPX support we highlighted. And, for those that may not know, even Alan Greenspan noted the same when he said:
“It's only when the markets are perceived to have exhausted themselves on the downside that they turn.”
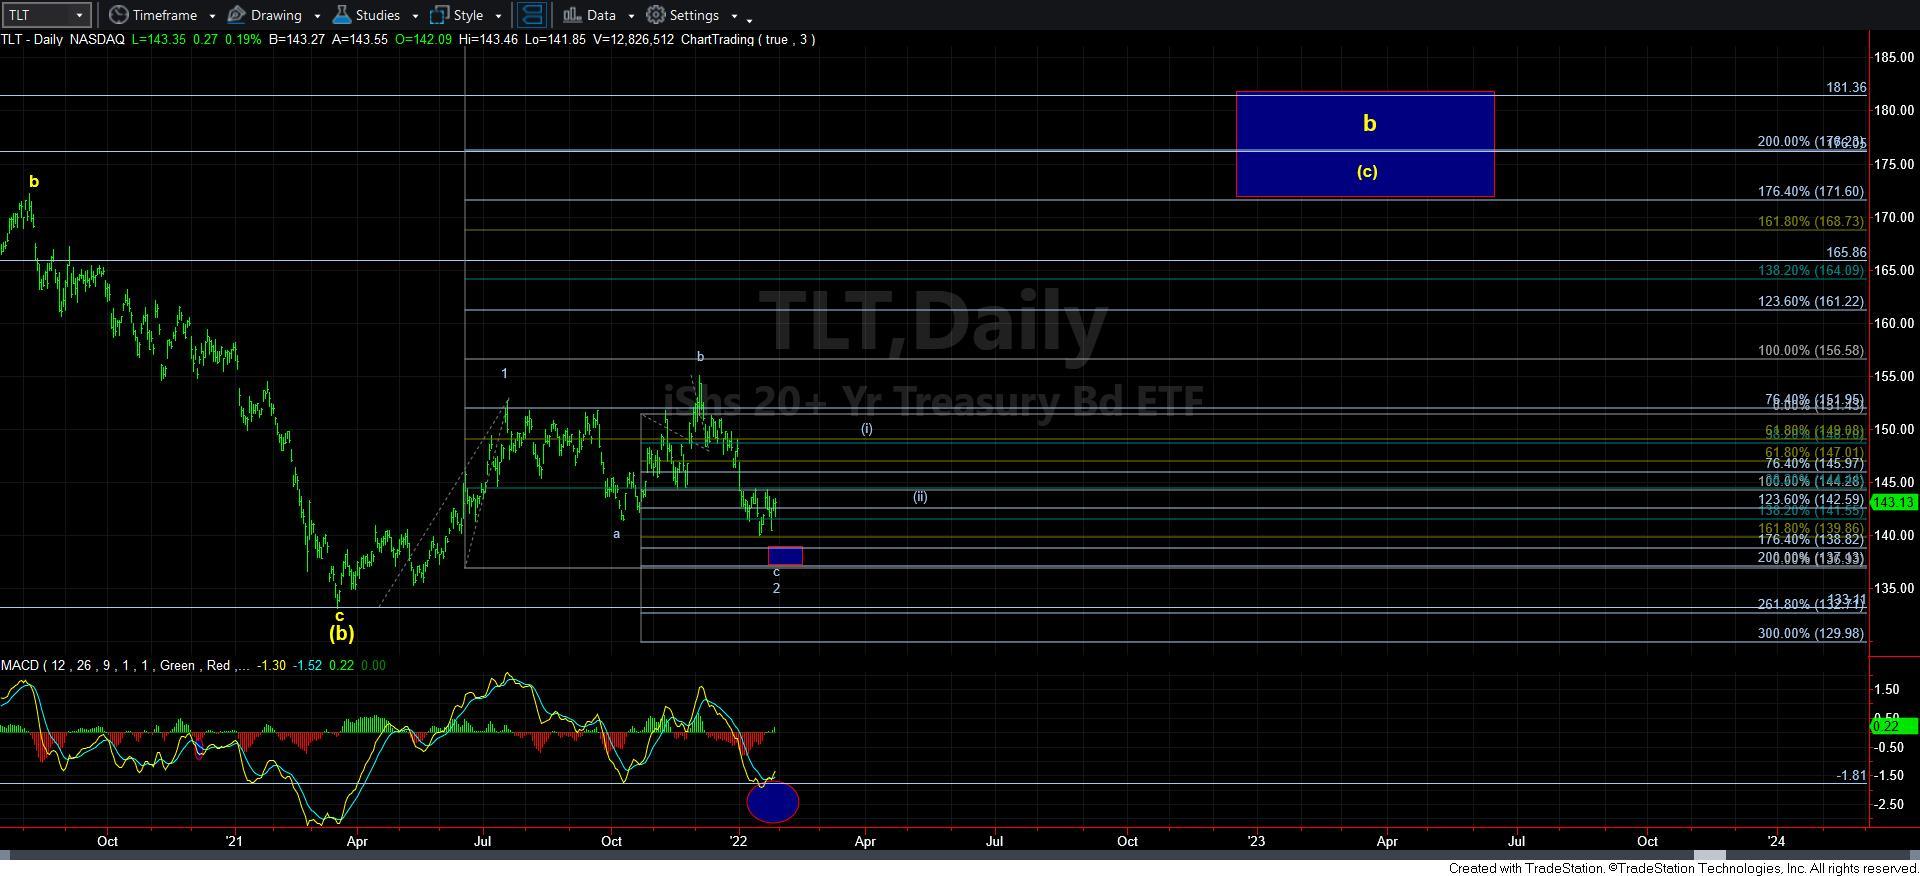
So, in turning to the TLT chart, it looks like we are trying to bottom out in a c-wave of an a-b-c pullback. And, once completed, we have the potential for a large rally set up that can take us back up towards the highs.
In the smaller degree, as long as the 144/45 region holds as resistance, I think this “bounce” off the low counts best as a 4th wave in the c-wave, suggesting that we can drop towards the 138 region before this c-wave completes. However, if we continue through the 145 region in impulsive fashion, then the a-b-c structure has completed (but best counted as a w-x-y), and I will be looking for the [i][ii] setup to develop in the coming months to provide us with a bigger setup pointing towards a long term rally in the TLT.
Moving in to a bit more of a micro discussion, I have been asked why I do not see us as having completed the c-wave already. So, let me explain. The strong drop in the middle of the structure is clearly the 3rd wave of the c-wave. The 3rd wave usually targets the 1.618 extension of the first two waves. That is basically where we bottomed this past week before we began this current “bounce” off the lows, and as long as we hold below resistance, I am viewing this bounce as a 4th wave. And, since the 2.00 extension is usually the target for a full 5-wave structure, that is the 138 region of which I noted above as my ideal target for this c-wave.
Of course, if the market moves through the traditional target for a 4th wave bounce in impulsive fashion (144/45), then I would adopt the w-x-y count, and view wave 2 as potentially completed at the last lows.
I want to make one last point. This current set up is not yet as good as the one I identified in November 2018. There are still issues with it. And, that is why I want to see the [i][ii] develop before I would classify this as a much higher probability for a major rally to be seen in the bond market.
At this time, I want to highlight the fact that the daily MACD on the TLT chart has turned up. To me, that means that we should expect a rally in the very near term. While my preference still remains that we see a lower low as long as we remain below the 145 region before that rally begins, I want to warn you that this chart is primed for a rally.