Blue October Mood Indicator
 By
By
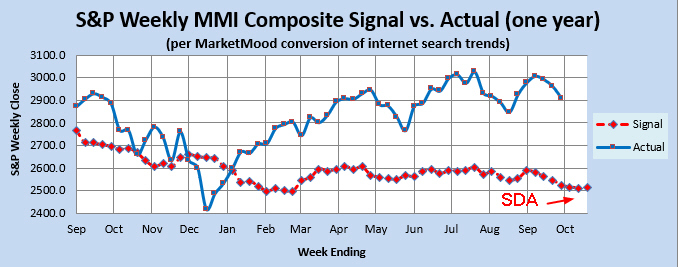
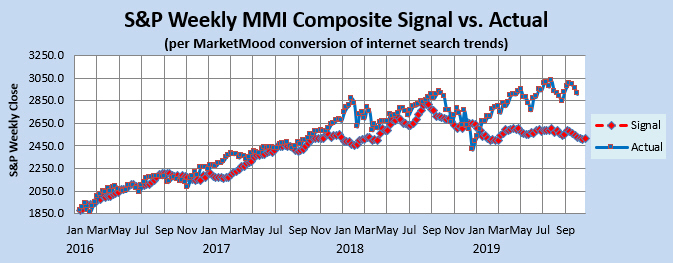
The weekly MMI charts (below) are showing the signature of a sharp drop alert (SDA) over the next three weeks (overbought +flatline). This does not imply a three week downtrend. It means that conditions are favorable for sudden, steep market drop(s) at any time over the next three weeks.
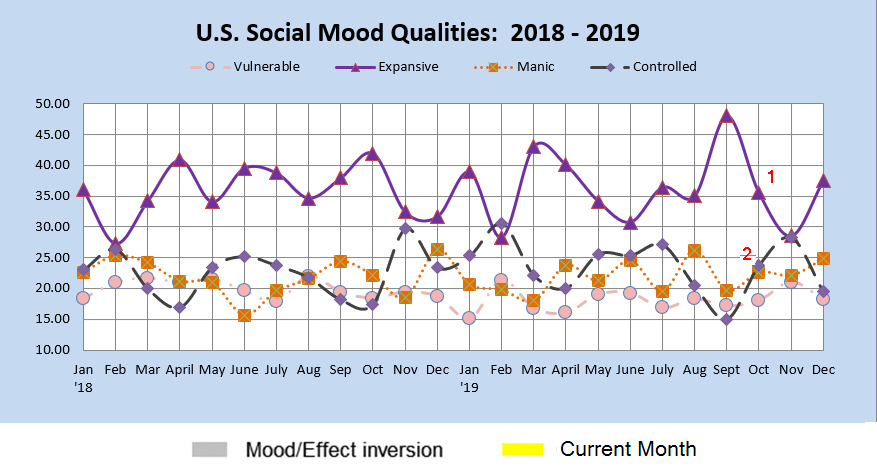
In reviewing the weekly mood patterns, I was not able to make out anything clear. However, looking at the monthly social mood chart (below), there are a couple of significant indications for October. 1) October is part of a correction within a larger bull market (high Expansive is typical within a bull market), and 2) There is significant focus on government and/or geopolitical issues along with other crises or disasters (per Manic/Controlled close together with Controlled higher). This month is set to be quite intense in many respects. Hold on to your hats!