
Bitcoin Wants to Slay the Sacred Cows
 By
Ryan Wilday
By
Ryan Wilday
In 2021, after an extension in that year’s price structure, I started discussing the likelihood that Bitcoin would put in a major top in the $125K region. The top at $126K and change may seem like I have tapped into a crystal ball. However, to be fair, Elliott Wave analysis gives Bitcoin room for a run to $195K, and as it stands, as long as it holds $54K. However, for now, the ideal, nominal target appears met and holding.
The second point that I made, although probably less emphatically, is that the next bearish cycle in Bitcoin would break all the norms. That is because, if my primary account remains viable, the current bear would be the primary fourth wave, the largest degree correction since Bitcoin dropped form $30 to $3 in 2011, and likely the largest in time duration.
All of the bearish cycles since the primary wave-2 in 2011 were lower degree using Elliott Wave analysis vernacular. All the measures of those cycles were formed in that context, so they had no bearing on a higher degree correction. For an understanding of degrees, please reference Prechter and Frost’s ‘The Elliott Wave Principle’. I would love to explain the concept of degrees but it would send this article down a pedantic tangent.
From a pure Elliott Wave perspective, support for the wave-4 that we seem to be in is at $490. While I don’t expect Bitcoin to drop that far in the coming years, note that the wildness of potential is not because Elliott Wave theory is outlandish as an analysis technique. These numbers are the product of the wild volatility of Bitcoin. Elliott Wave involves defining future potentials via how the asset in question moves through Fibonacci structures.
If you took the wildest tech stock, you might find similarly wild potential for future wave fours. Yet, Bitcoin outstrips the volatility of most tech stocks.
To temper my views, I have reviewed charts that involve the network effects that pundits suggest should be considered in Bitcoin’s chart. The most telling example is Google. If I apply the Fibonacci level that I determined Google hit in its primary fourth, to Bitcoin, this primary fourth would only reach $8300. Since I have been called crazy by suggesting $10K would be easy for Bitcoin to reach in five years, $8300 should bring the same ridicule.
Therefore, even when I temper my expectation using the structure of other charts, with suspect comparisons, the potential for this bear market is deep. Some will suggest that my folly is adherence to the Elliott Wave theory and overfitting to that perspective. For me to agreem I’d have to throw out my own history of pinpointing major turns in the crypto market since 2017, which I do not credit to my own skill, but rather the use of the theory.
This is a long preamble to set the stage for the main point of this article. I have expected this bear market to test expectations set in Bitcoin’s past bear markets. Any market observer studies history to determine the future. The Bitcoin trading community is no different. My argument is that this bear market will test the history of Bitcoin so far. Further, today, price action is ready to test those expectations. So this article is timely. Bitcoin investors are somewhat egregious in this way. They have an asset that is only 17 years old, and yet expect it to adhere to ‘historic norms’ when history is a misnomer altogether. Bitcoin is still young amongst tradable assets.
As we dive in, I want to review what I will call the sacred cows of Bitcoin behavior. These are the norms and models that the most devoted Bitcoin investors hang on to. As the name, which I did not invent, suggests, they do with religious fervor. My perspective is that many, if not all of these will break:
The Four-Year cycle
Bitcoin has regularly put in a cyclical high at a mean of ~525 days after a halving. And, iut bottoms at a mean of ~520 days before a halving. The theory is that investors get ready for the supply shock caused by the growing demand in Bitcoin while the rate of creation of Bitcoin drops by half.
Putting aside my perspective that this bear market is much larger than previous, I have always believed that the 4 year cycle would break. Firstly, when the first halving occurred, the creation or inflation of Bitcoin supply dropped by ~13%. At the next halving, it will drop by ~0.43%. That hardly changes supply. In fact, there are roughly 1M more Bitcoins to mine before production ends. That is only roughly 5% more.
Secondly, this four-year cycle has been a free lunch, which one could trade at predetermined dates. Markets do away with free lunches.
And finally, this is a strategy based on three events. No quant trader in their right mind considers that reliable.
That said, the 4-year cycle topped right where it should have in 2025. And, if it puts in a low in September, then goes to all-time highs, the four-year cycle will live on. If September is a relative high and Bitcoin goes lower, I would call it broken, and if it doesn’t move to an all-time high. This scenarios ia leading potential to my eyes.
Stock to Flow Model
The stock flow model, developed, as far as I know, by a Twitter/X user named Plan B, suggests where Bitcoin’s price should be based on supply and demand. I already consider it broken, but others may disagree. Currently, it assigns a price of nearly $400K. While it has frequently moved over the suggested value, it has spent much of the last bull-bear cycle well under its suggested value except for a brief period in 2024. If it is not deemed dead by adherents, I have to suggest that it is a useless model.
The Power Law Model
The power law model for Bitcoin suggests that it follows a power law distribution, where the early, highly volatile price growth tapers into a low volatility climb. Certainly, Bitcoin has experienced declining volatility in the last few years. However, the top and bottom of its curves now constrain Bitcoin at a tighter range than Elliott Waves suggests.
As of today, the Bitcoin price rests on the lower channel at ~$59K and briefly broke it intraday in the last two weeks. Given that Bitcoin seems headed lower, I assume it will break. But I do not know how far it must break before its adherents call it dead.
Only One Red Year
Probably the easiest sacred cow for the market to break would be that Bitcoin has never put in two red years in a row. Behaviors of new markets change as they evolve. One can find many assets that have only had one year of red at a time for many years until that behavior changes. Only Bitcoin investors who think that their favored asset is so unique from other publicly traded instruments can imagine this holding.
I Own a Cow
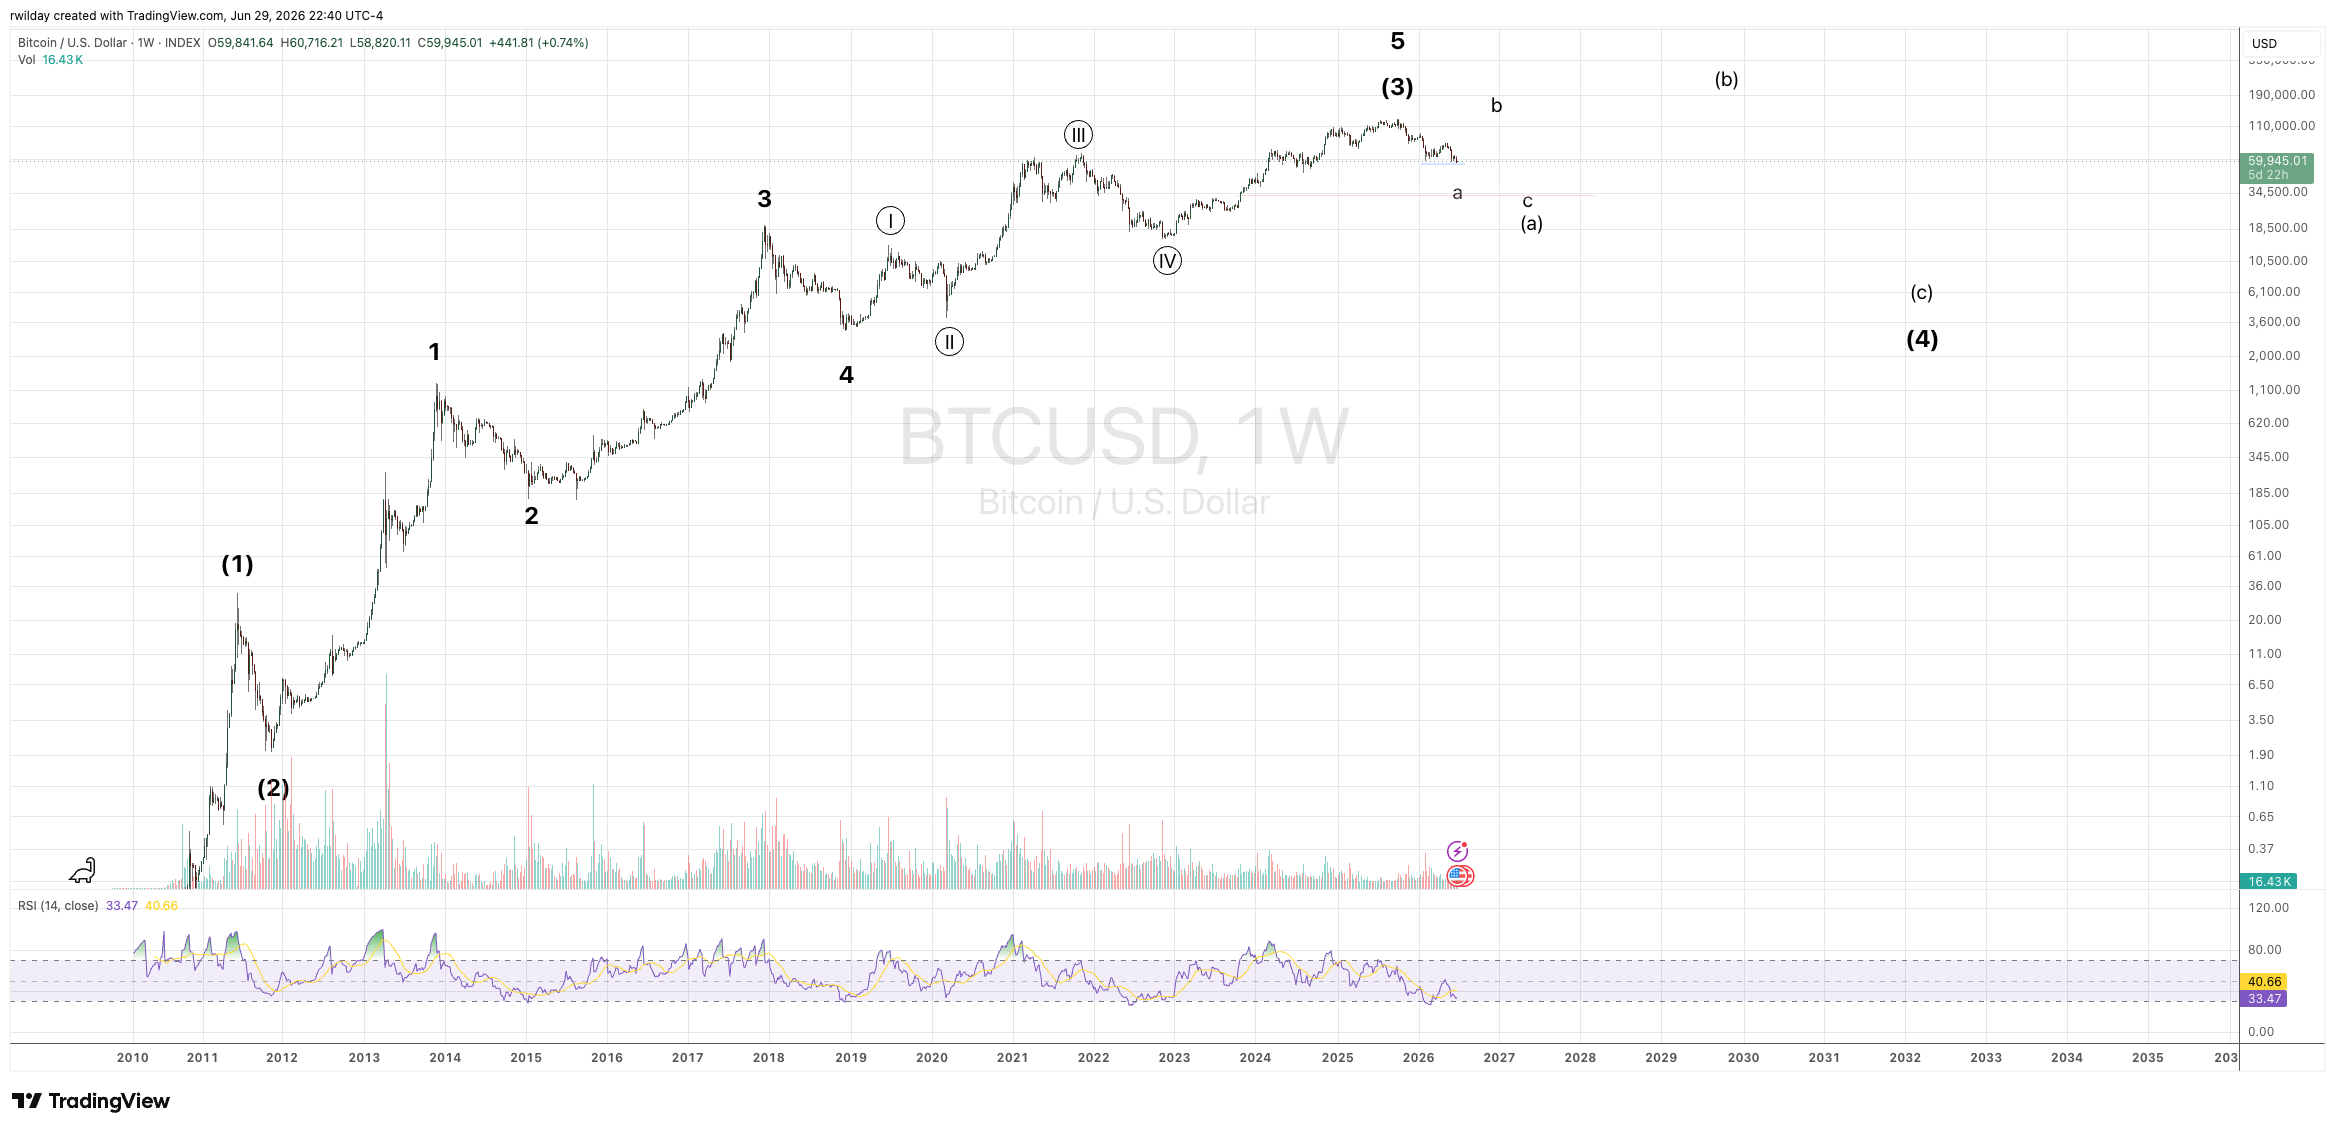
Lastly, I have a sacred cow. ‘Historically low readings in 1D and 1W, the Relative Strength Index (RSI) gives rallies that can be traded, even in a bear market. For sure, when trading such readings in a bear, one must have as low an entry as the market can give you, and trail a stop as it goes higher. But I have traded these scenarios profitably many times. That was less true with the February 2026 rally. But that appears to be due to a lack of patience in obtaining a low entry.
RSI readings below 30 on a weekly chart are rarer, occurring only 4 times, with the last in February. In all past events, it resulted in four year cycle low, sometimes after one more nominal low with divergence. This breaks if Bitcoin hits $55K and then fails to go to new all-time highs. It appears it will break.
This would not be strange in security trading history. Low RSIs on their own are typically not good points to trade in other instruments without other contextual indications. So far, RSI has been easy to trade in Bitcoin. As it matures, that should go away. Has it started to disappear? Possibly.
I always presumed Bitcoin would break this norm some days. Right now, it appears that this will be the first weekly reading below 30 that will fail to create a new all-time high. That would break my sacred cow, and that of those who worship the 4-year cycle.
1 week chart with RSI:
Current price action
So, now let’s look at the current price structure and consider how these historical expectations of Bitcoin will break. Note that I am discounting S2F because it appears to have broken.
Zoomed out to the weekly chart, you’ll see I am looking for large wave four. Wave fours tend to produce large sideways corrections that tend to chop through ranges for an extended duration when compared to their previous third wave.
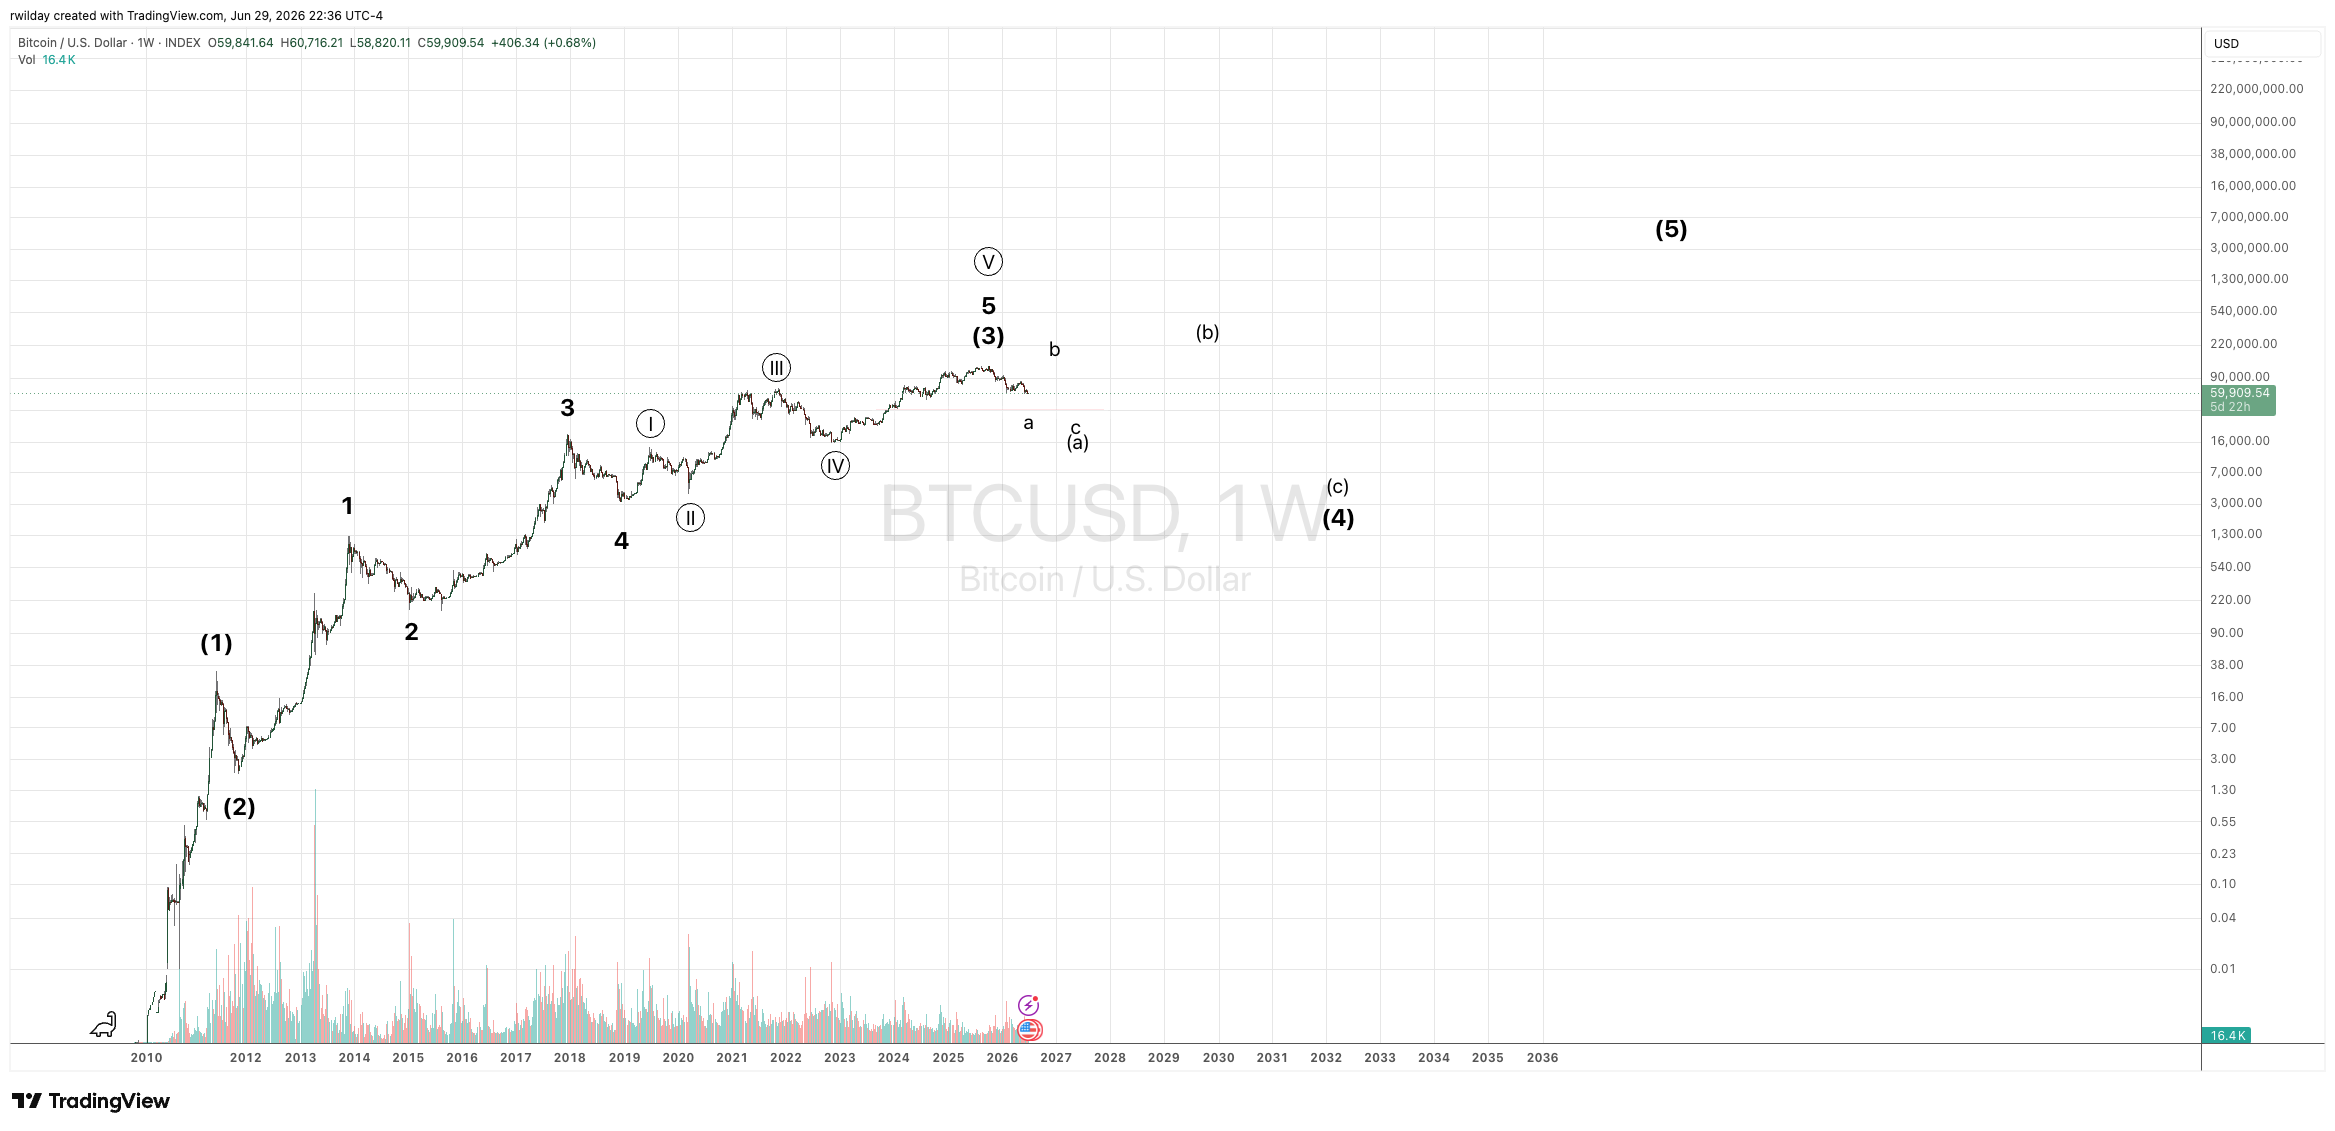
As stated, deep support for a primary fourth of the degree I am showing is $490. A drop to $1800 would represent a drop to the more average fib level for such a correction in other assets. A drop to $10K would be over 90% for Bitcoin, which is compatible to its primary wave two. Lastly, $3K supported the last fourth of the lower degree. Often, the fourth of the next higher degree doesn’t breach the lower. Therefore, I will be surprised if 3K breaks.
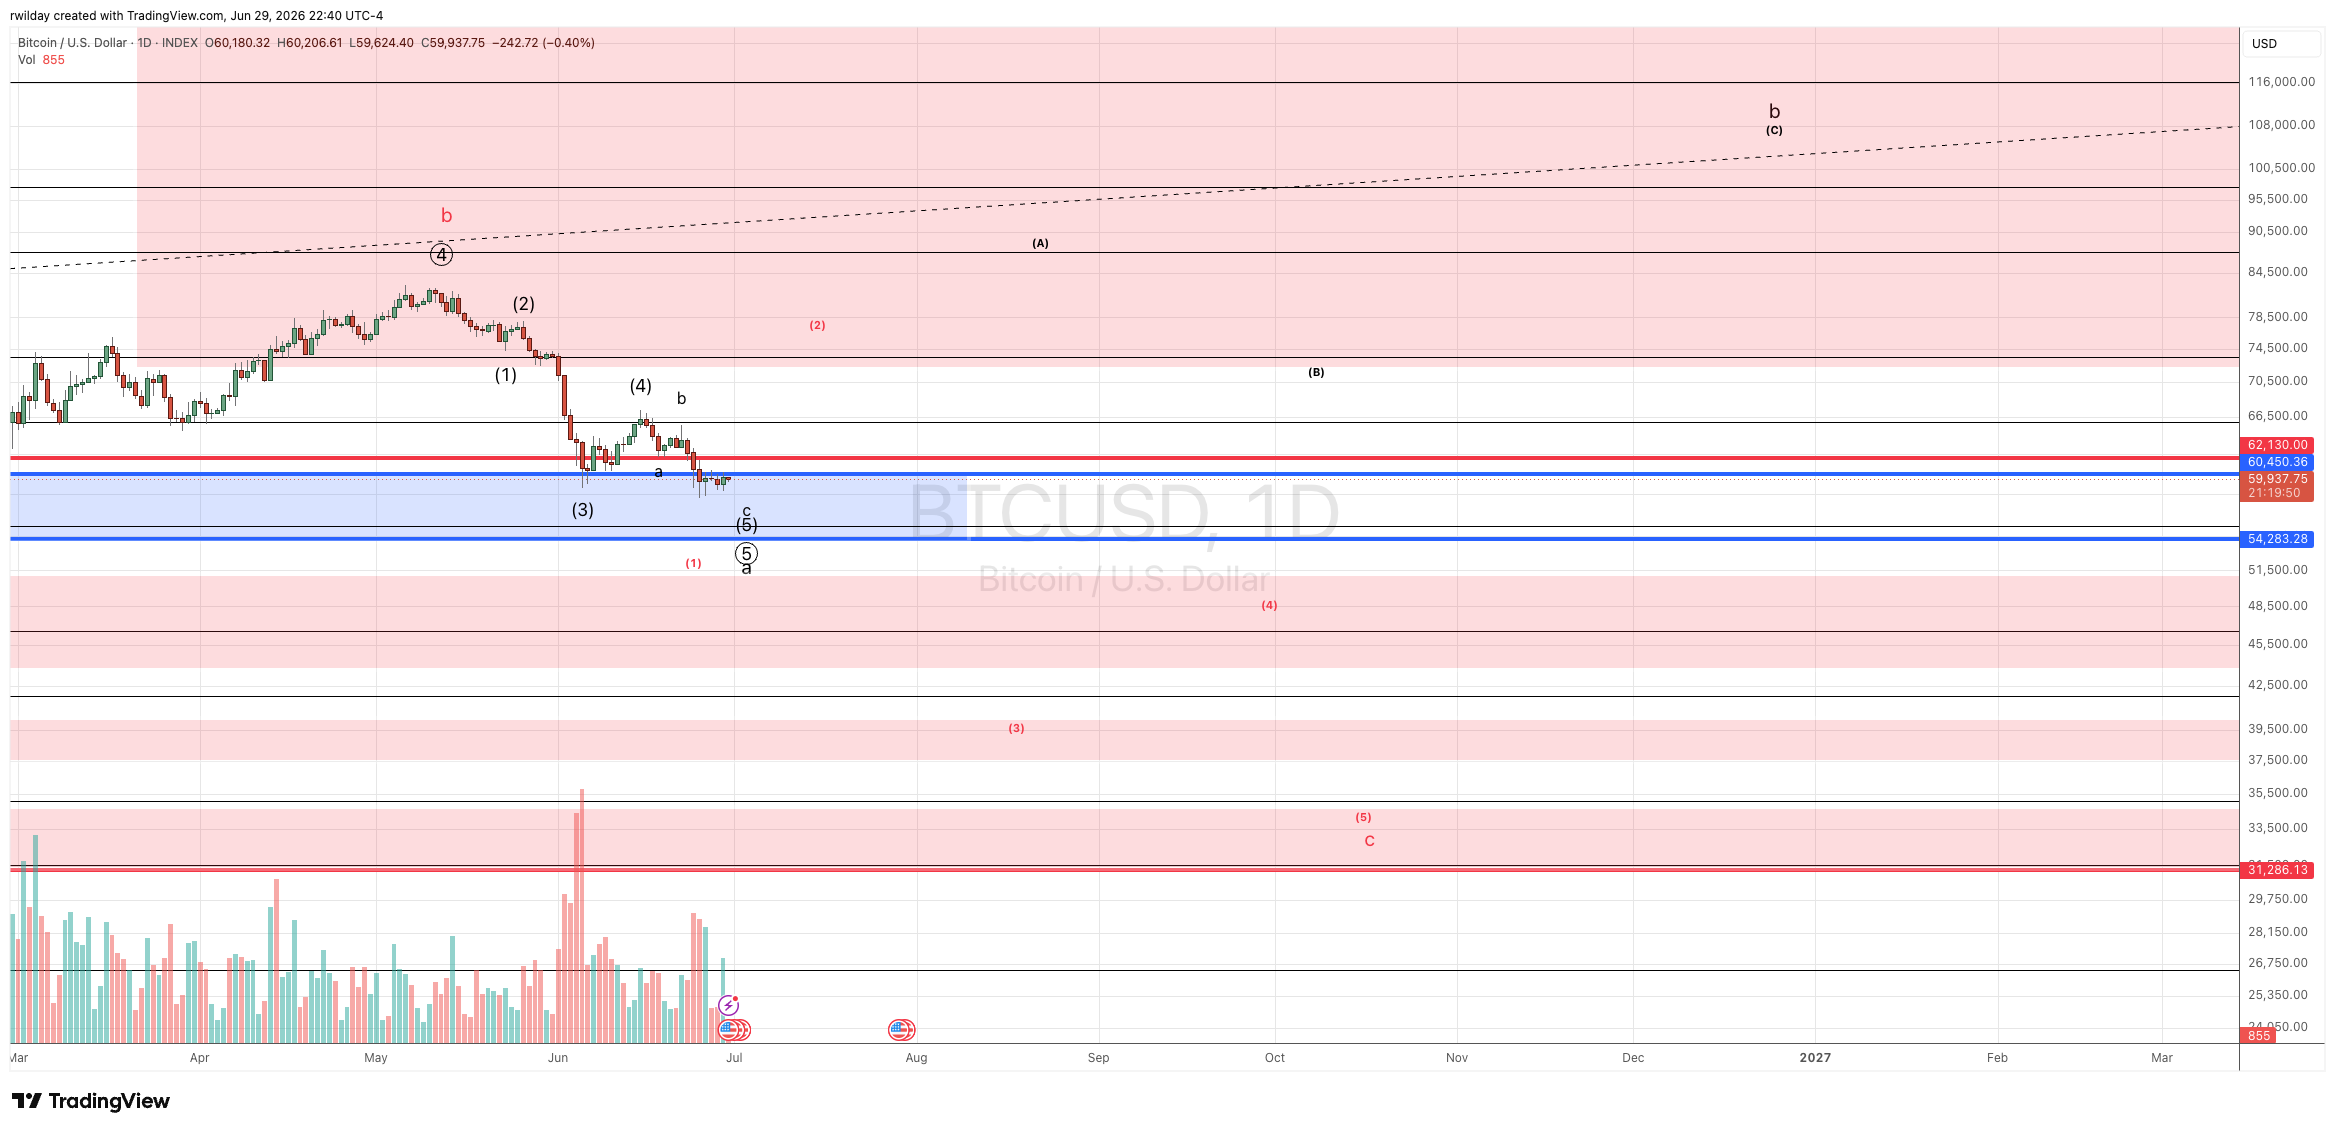
Note that I am not expecting Bitcoin to reach much lower than $30K in 2026. It may happen, but given Bitcoin’s previous behavior, I would expect that a large B wave forms before its final C wave to stave off prices below $10K in the coming year or two.
Now that I have covered the long-term view, note that it has also finished five waves off its all-time high, which, via Elliott Wave theory, if that interpretation is accurate, means that this leg to $54K or so is only the first leg of this bear market. That appears to be the case even though it has reached the minimum level hit in previous corrections. Mathematically, this five-wave structure alone portends this bear has much more to go in years and price.
Given the structure, and that weekly RSI reached sub-30 levels in February, previous behaviors of Bitcoin price and RSI are already on the verge of breaking. A move from the $50Ks to new all-time highs is low probability.
Lastly, I am left with the 4-year cycle behavior still standing. Whether it continues to stand depends. If I am correct in calling the move from $125K to $60K five waves, Bitcoin should rally back to between $80K to $100K from these levels. Given that we are nearly in July, the September cycle low is more likely to produce a swing high, breaking the four-year low before it drops into the $30K. I can see the potential for a direct slide into the more direct red count down to $30K from today’s levels. That would save the 4-year cycle temporarily, in that the September cycle low could give us a low at $30K. However, Bitcoin would be unlikely to present an all-time high from that level if I am correct about this bear market being the primary fourth wave. If it does, it is likely a high B wave.
Conclusion
In conclusion, the Bitcoin investor market has a set of very hard beliefs that I liken to sacred cows. The religious connotations are appropriate because many Bitcoin investors speak of Bitcoin as something mythical, as if it behaves differently from other assets. I will only agree to the fact that Bitcoin is uniquely volatile amongst other liquid assets of its market cap. However, the fact that Elliott wave has allowed me and the other analysts on Elliott Wave Trader to pinpoint its major turns means that it actually moves in similar structures as other assets. I only agree that it likes to double the tempo of movement. Elliott Wave is not bound by time but only by price.
Back in 2021, I started talking about the current bear market as different from all the previous. However, it was only a sense based on my experience with Elliott Wave. Now, as of writing, I am starting to see the specific ways that it will be different when compared to the religious views of Bitcoin created by previous cycles.
And lastly, I submit that these changes in its previous behavior will be earth-shattering to old market participants. When sentiment is so religious in nature, such changes may cause a great lack of ‘faith’ in Bitcoin. Eventually, that will be meaningless. Elliott Wave tells us that Bitcoin should one day reach millions in US Dollars. However, it also told us many times that when analysts called for such wild prices, in years past, they were wrong with respect to timing. Instead, a great washout of the current belief system held to by its adherents is just what Bitcoin needs to make that epic climb to nine-figure prices.
