Bitcoin: Hovering in the Stratosphere
 By
Jason Appel
By
Jason Appel
In last week's article we noted the forecasted potential "blastoff" from the previous articles had come about with Bitcoin's direct breakout to new all-time highs exceeding $123k. Considering price has now reached within 2% of the target from this move from the 2022 low, on the higher timeframe we can consider the target functionally achieved. While price has not officially hit $125k, I don't consider the business of forecasting a precision endeavor. This likely a moot point though as the lower timeframe action is quite suggestive of further upside to come. The past week's action has been very typical bull-market behavior: after a breakout, price is consolidating above the former all-time high as opposed to being rejected at new all-time highs and being sent down into previous consolidation regions.
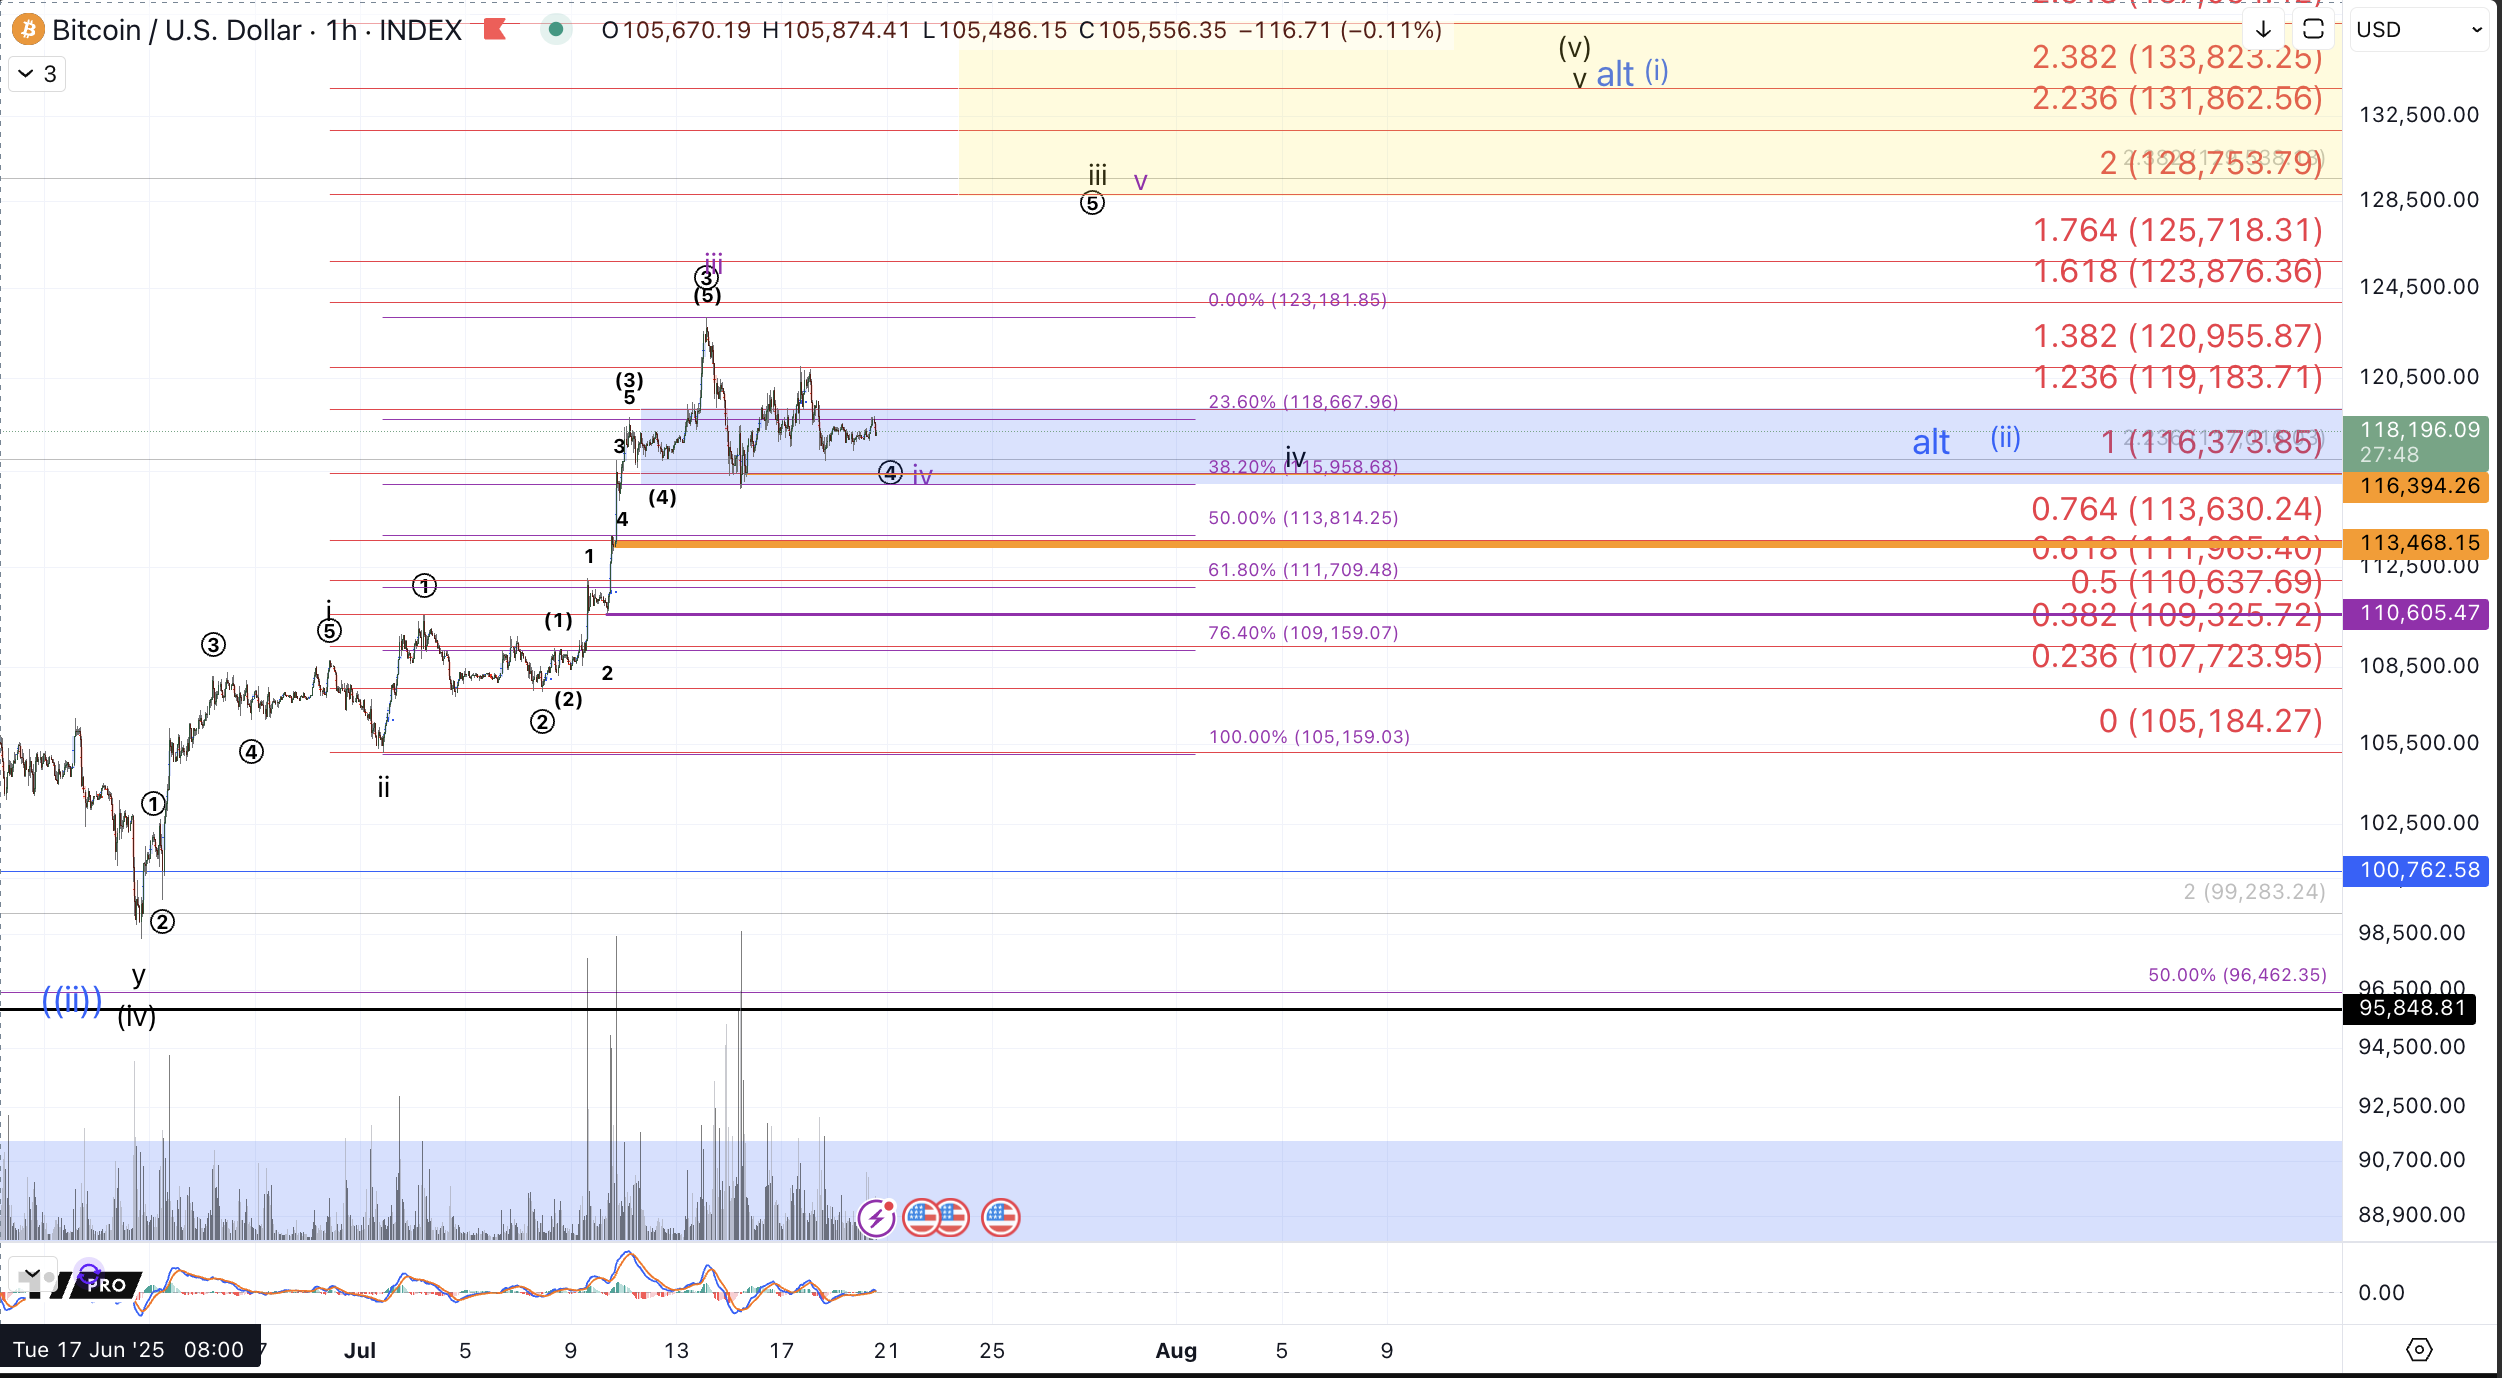
In our Elliott Wave framework, this "digestion" of a breakout, ie a consolidation in new all-time highs is very typical of a lower timeframe 4th wave within the context of a higher degree third wave. This can be seen on the 1hr chart in which this action (in the black count interpretation) is considered as a wave circle 4 within wave iii of this rally from the June 22nd low. This behavior entails another high to come to complete 5 waves within the wave iii and then another iv-v to potentially complete the rally from the aforementioned June low.
Also, the extent to which price has rallied in relation to the early parts of this ascent, allows for reasonable interpretation that one more high could complete all of 5 waves up: i-ii-iii-iv-v, as per the purple count rather than getting an additional 4th and 5th wave(s) as the black count portends. Either way, our attention should turn to support. So long as the necessary supports are holding the action is very suggestive of new highs to come in more direct fashion. Currently, Fibonacci support sits roughly between $116k-$119k and given the larger context, the onus is on sellers to prove their case. In other words, it would require a definitive break of support followed by a resounding and sustained break below $113.4k to deviate from the nearer term bullish expectations. For me to get bearish would further require a sustained break below $110k
Regarding the black vs. purple count on the lower timeframe; In either case, while we consider it necessary to minimally get a clear 5 wave move from the June low (which the purple count would satisfy) it would not on its own be sufficient to rule the rally as complete. As stated last week: the 1h chart for right now (described above) [which] portends price targeting the $128k-$137k region based on the i-ii from the 6/22 low.
That said, it's important to note the reasonable prospect of direct extensions higher beyond $137k. We have seen several instances in the past, (the end of 2017 comes to mind) in which price continues to subdivide and extend in a larger 5th wave. And so, assuming we get continued upside followthrough to the minimal target, $125k, we will trail up our Fibonacci support levels that price must maintain above to keep immediate pressure to the upside, which becomes especially important if price breaks directly above $137k.
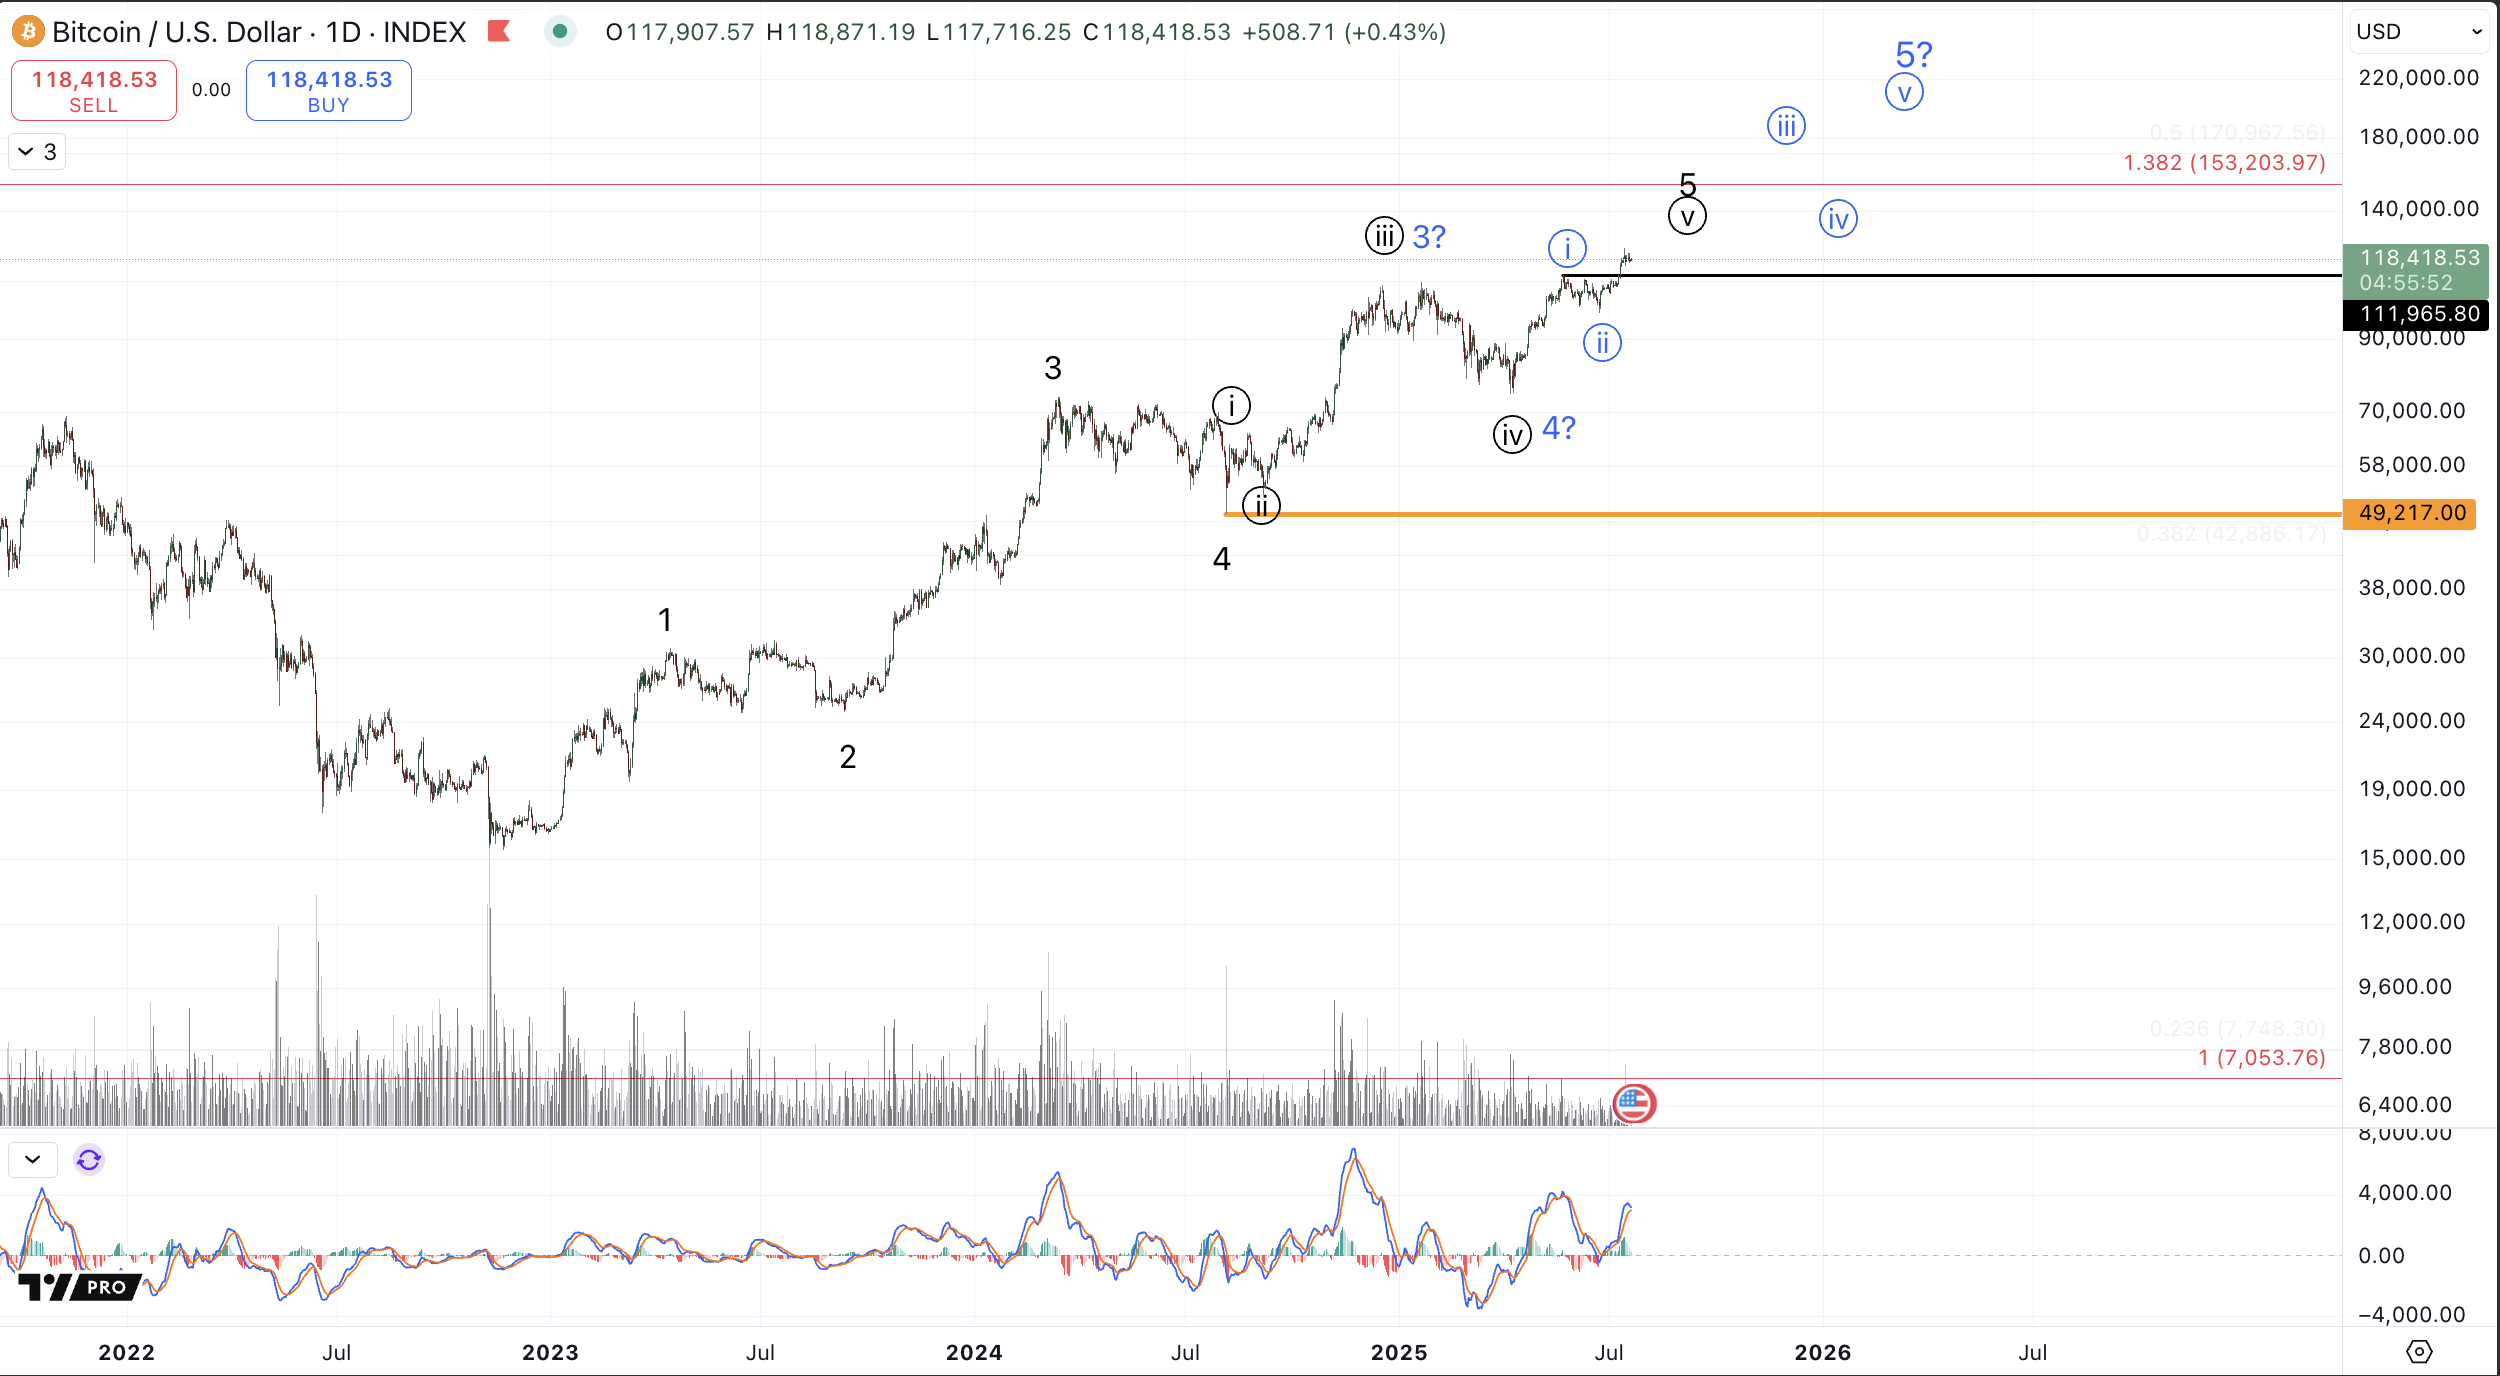
However, assuming this move from the June low completes in standard fashion (with a top in the $128k-$137k region) we still have the larger blue bullish potential which shows a reasonable path for price to continue up to $200k+. I'll reiterate the conclusion of last week's article which discusses the more bullish case and the accompanying risks:
As for the higher timeframe bullish potential that's been presented in blue. Even in the event that price does get continuation upwards over the following months to reach the $200k+ region within this cycle, I don't expect a direct breakout in that path without first providing a multi-day to multi-week wave (ii) pullback. That is to say, I'm only following the path on the 1h chart for right now (described above) which portends price targeting the $128k-$137k region based on the i-ii from the 6/22 low. Notice that this region has decent confluence with the larger degree .618-.764 extension on the Daily chart. In order to reasonably entertain an uber-bullish path to $200k+ on a direct basis, ie, without a clear wave (ii) pullback, I'll need a direct breakout above the larger degree 1.0 extension, $148k~ and then for price to use the pivot region, $126k.5-$134.3k as support for all subsequent pullbacks. So, my expectations are for this rally from the 6/22 low to terminate prior to exceeding $148k at which point we'll establish support for the bullish blue count to distinguish it from the black count that would entail a very large degree top in place as a complete rally from the 2022 low. Generally, my expectation for this currently rally is that price will top in a range that would place blue wave (ii) support for that count in the $110k-$120k region. The July low, about $105k would then distinguish between the blue and black counts.
I'll conclude with a warning to mindful of risk. The past few months have been outstanding for Bitcoin holders but we'd be wise to recognize that the current euphoria will not permanently last. As has been discussed before, while this cycle may have a decent amount of upside left, odds are strong that the majority of the move from November 2022 is in hindsight and very large positions would be wise to consider trimming some profits, trailing some stops, and reducing some risk as price pulls towards key targets.