Big Week Ahead For The US Dollar
 By
By
The last few weeks have been quite wild in the US Dollar as we have seen fairly sharp moves both up and down but in the end we have failed to see a significant breaking in either direction. Rather than breaking either up or down we have seen a fairly large sideways consolidation since the lows that were struck back in September. After moving higher last week this week we saw the DXY once again break down and now retest the lows that were struck back in the September putting us in a very key spot moving into this week.
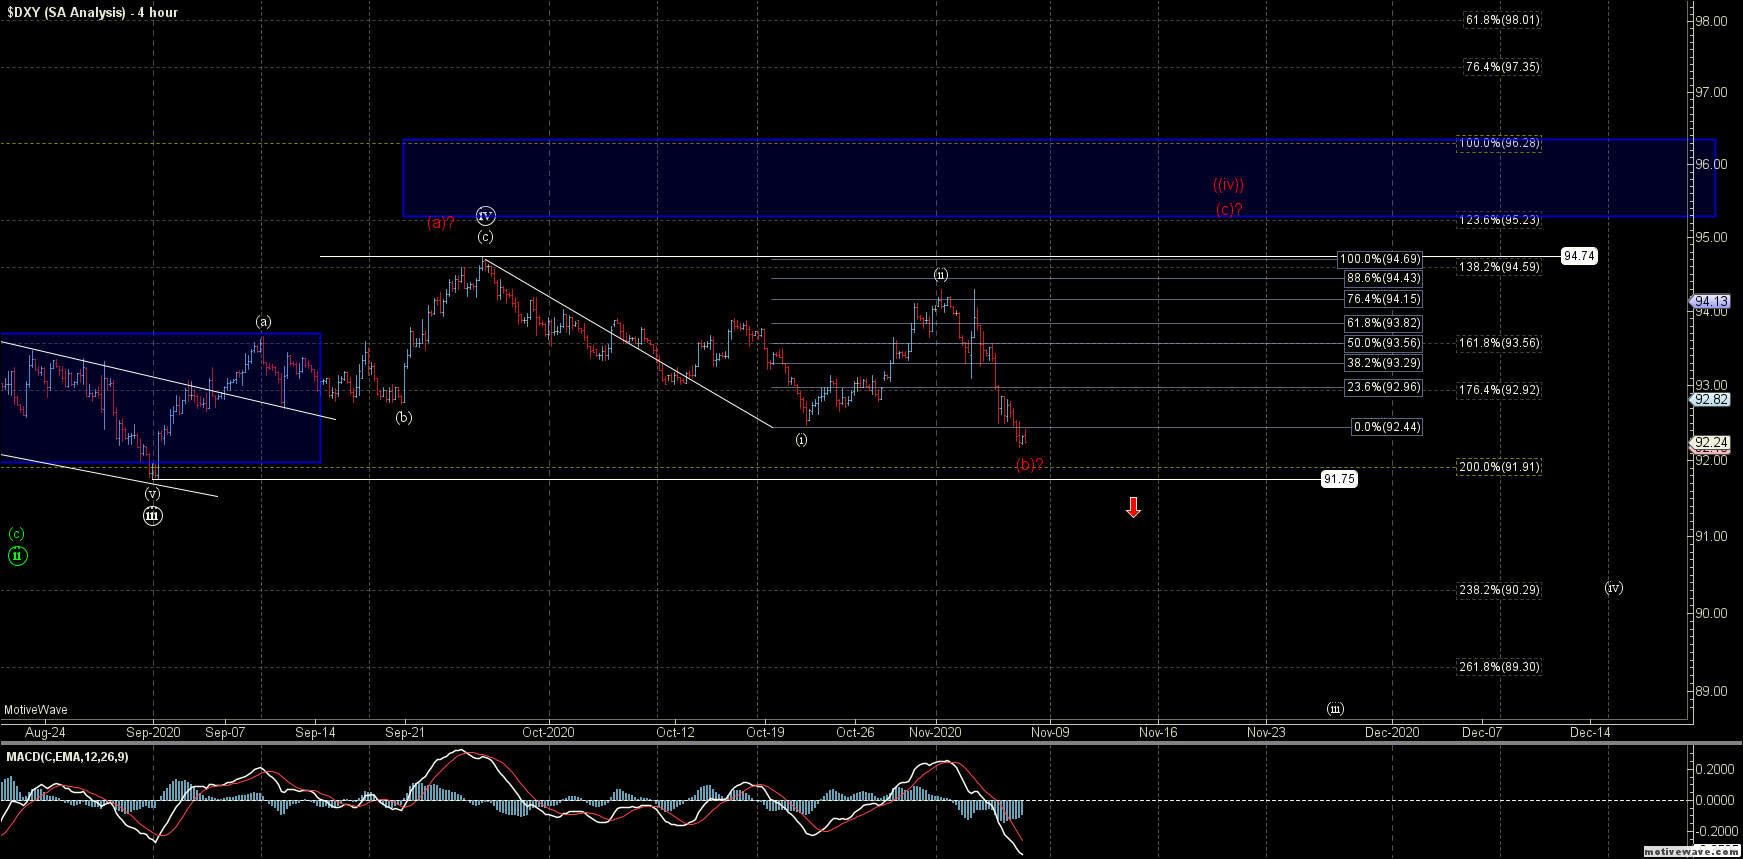
As I noted last week and as shown on the four-hour chart I can count the move down off of the 94.74 high as either the beginning of a fairly bearish (i)-(ii) to the downside as shown in white or simply an abc as part of a larger wave (b) shown in red. The red path would still allow for this to see another minor swing higher in a wave c of ((iv)) prior to topping in all of wave (iv) per the red path. This red path still would need another lower low prior to seeing a significant bottom however it may just take a bit more of a drawn-out path to get there before finding that bottom in all of wave ((v)). As we have now broken back under the 92.45 level it is making the red path less probable but we still need confirmation with a break under the 91.75 level to confirm that we are indeed breaking down in the white count. This would then set up targets into the 91.17-90.54 zone fore wave (iii) of ((v)) with ultimate targets for the wave (v) of ((v)) closer to the 90.29-88.81 zone.
In either of these to smaller degree paths as long as we hold under the 95.23-96.28 resistance zone for a wave ((iv)) we should still see another lower down towards the 90.29-88.81 zone before finding a more lasting bottom. This would hold true for both the red and the white paths. Ideally, that bottom would only be the bottom of a wave (A) of a larger corrective downside move, however, once we get there and find a bottom we can look towards the structure of the next move up to help determine the overall larger pattern
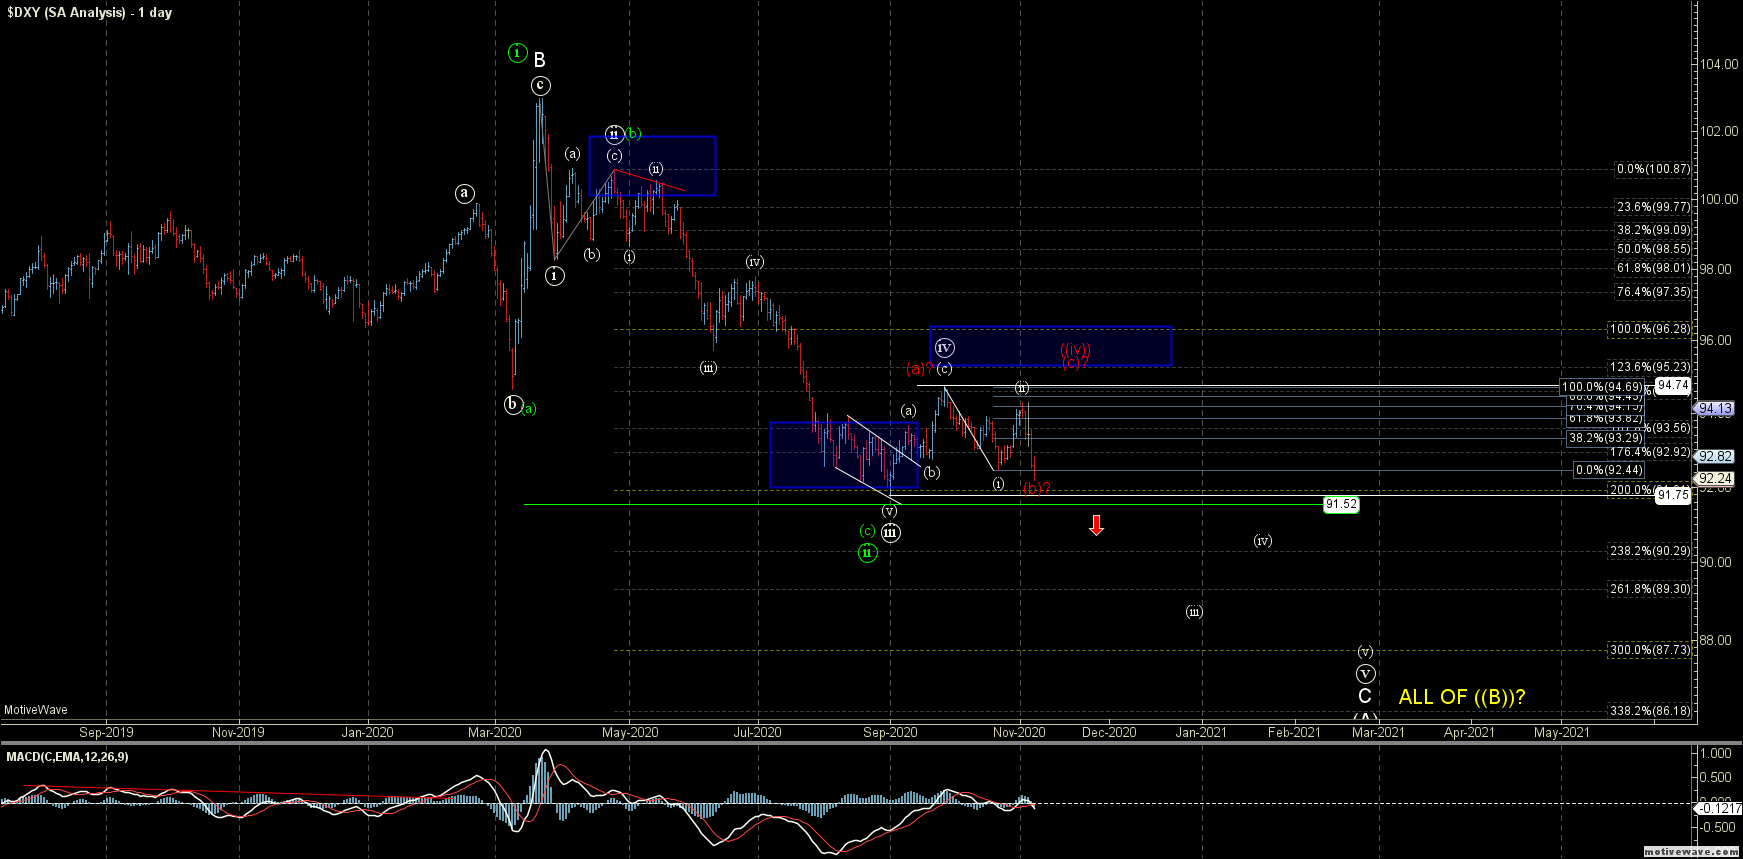
I am also still leaving the alternate green path on the chart, for now, however, This pattern is becoming less probable with the current price action but I will leave this path on the chart for now. As I noted previously this green path is far from an ideal scenario and not my preferred path but it is the most reasonable bullish alternate that I can come up with at the moment. So for that reason, I will leave this on the charts as the alternate path as long as we can hold over 91.52 level. Below that level and this green path would become much less likely and give us even further confirmation that we are indeed following the primary white path down towards those low 90s to high 80s.
So overall this has been following the pattern laid out quite well over the past several months and while the micro timeframes have not been terribly clear as we continue to trace out what is likely a fourth wave the larger degree pattern has been quite clear and reliable. For that reason and as long as that remains the case I see no reason to change the analysis and will continue to keep following this lower as we move forward in the days and week ahead.