Big Picture View of Bitcoin, Ether & GBTC
Here are intermediate-term views on Bitcoin, Ether and GBTC. For short-term guidance, please login to view our Nightly Report as well as intraday room posts.
Bitcoin Intermediate View
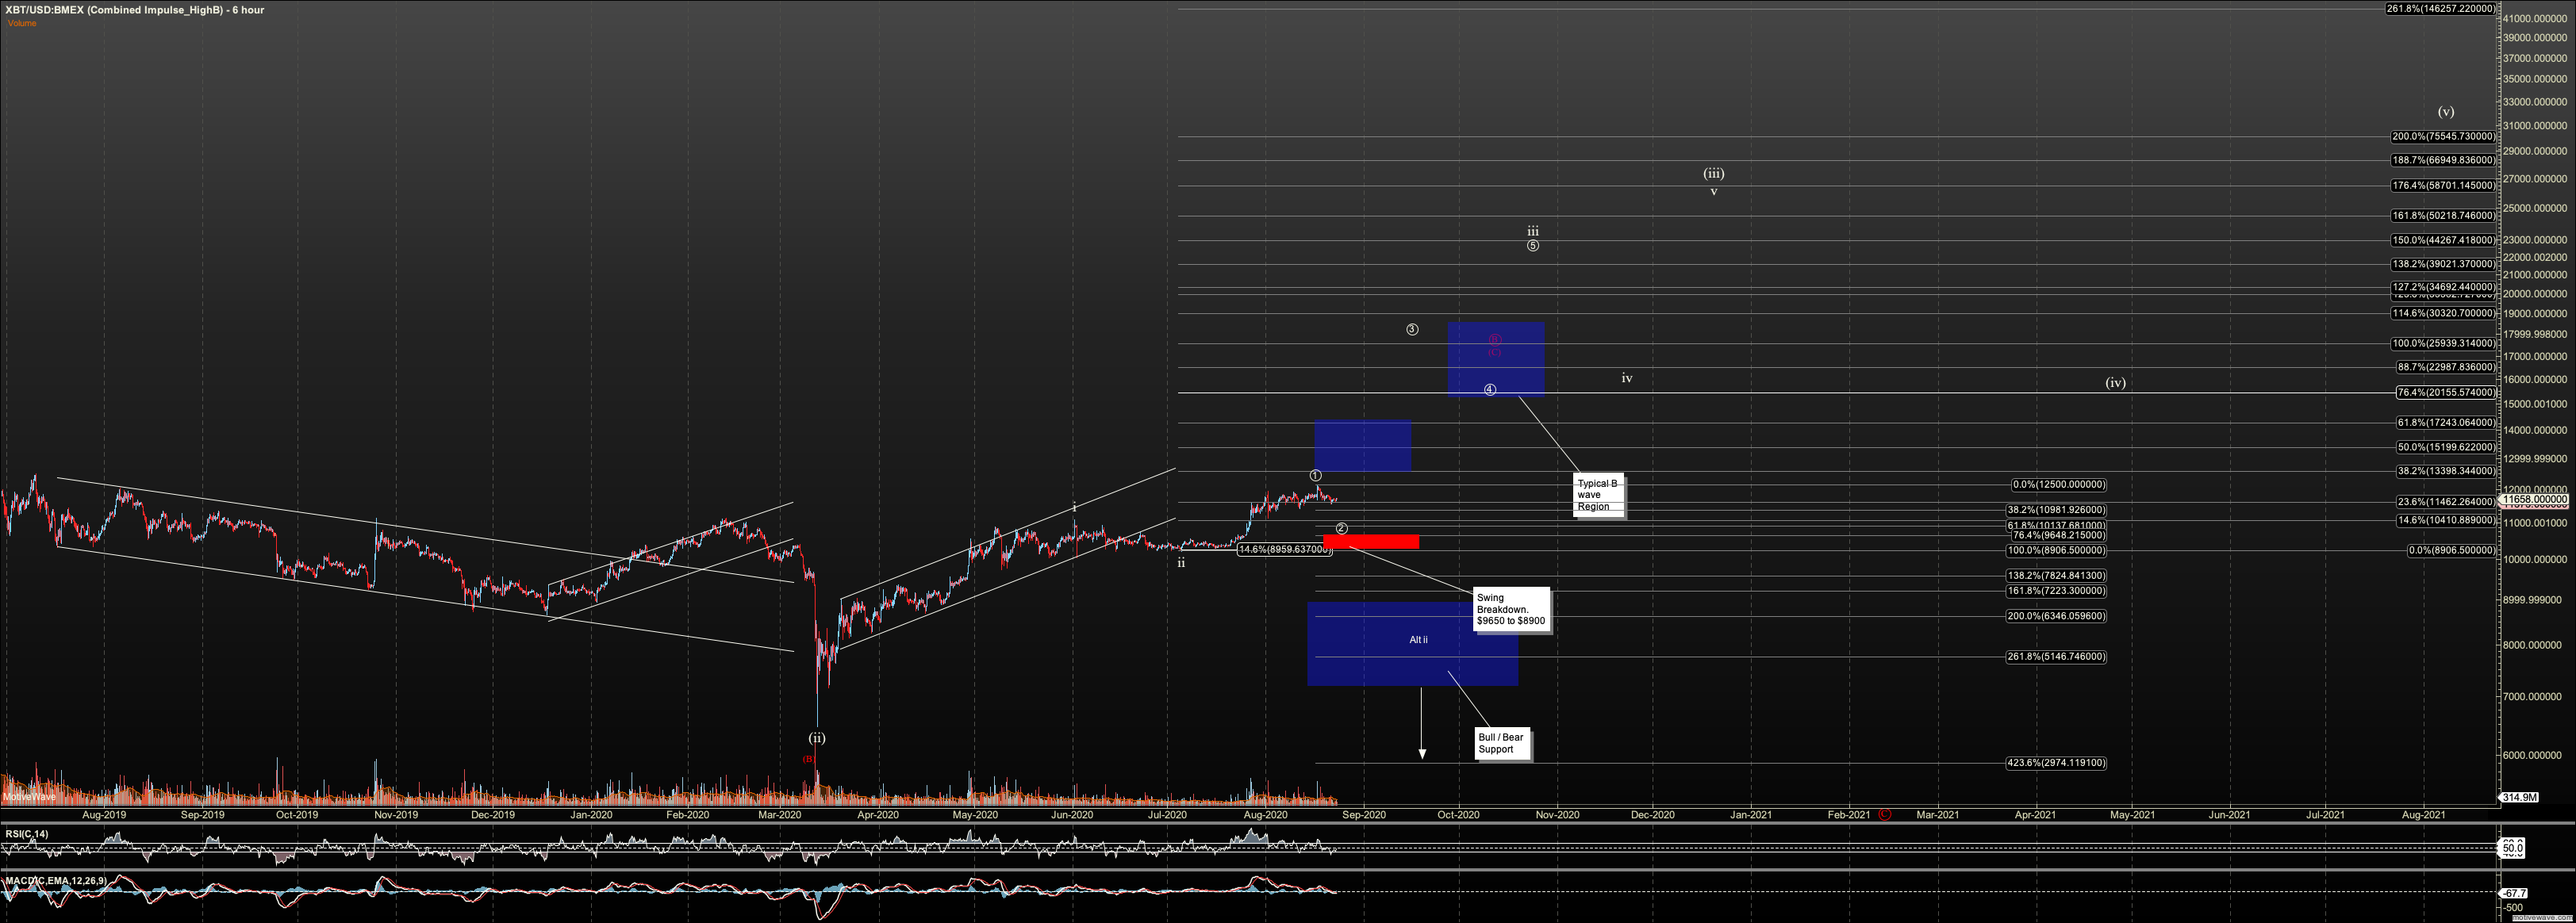
I continue to watch two scenarios in Bitcoin since the breakdown on March 12th, 2020. This includes the potential for an impulsive rally to $70K and beyond. And, this includes a B wave top in the 20K to 37K region, that brings Bitcoin to rest near $2K before the next major rally. If you’d like to review the reasoning behind holding two perspectives, the details are included in reports dated between March 12th, and August 18th. Note levels above may vary slightly from past reports due to recent review of structure and fibonacci levels.
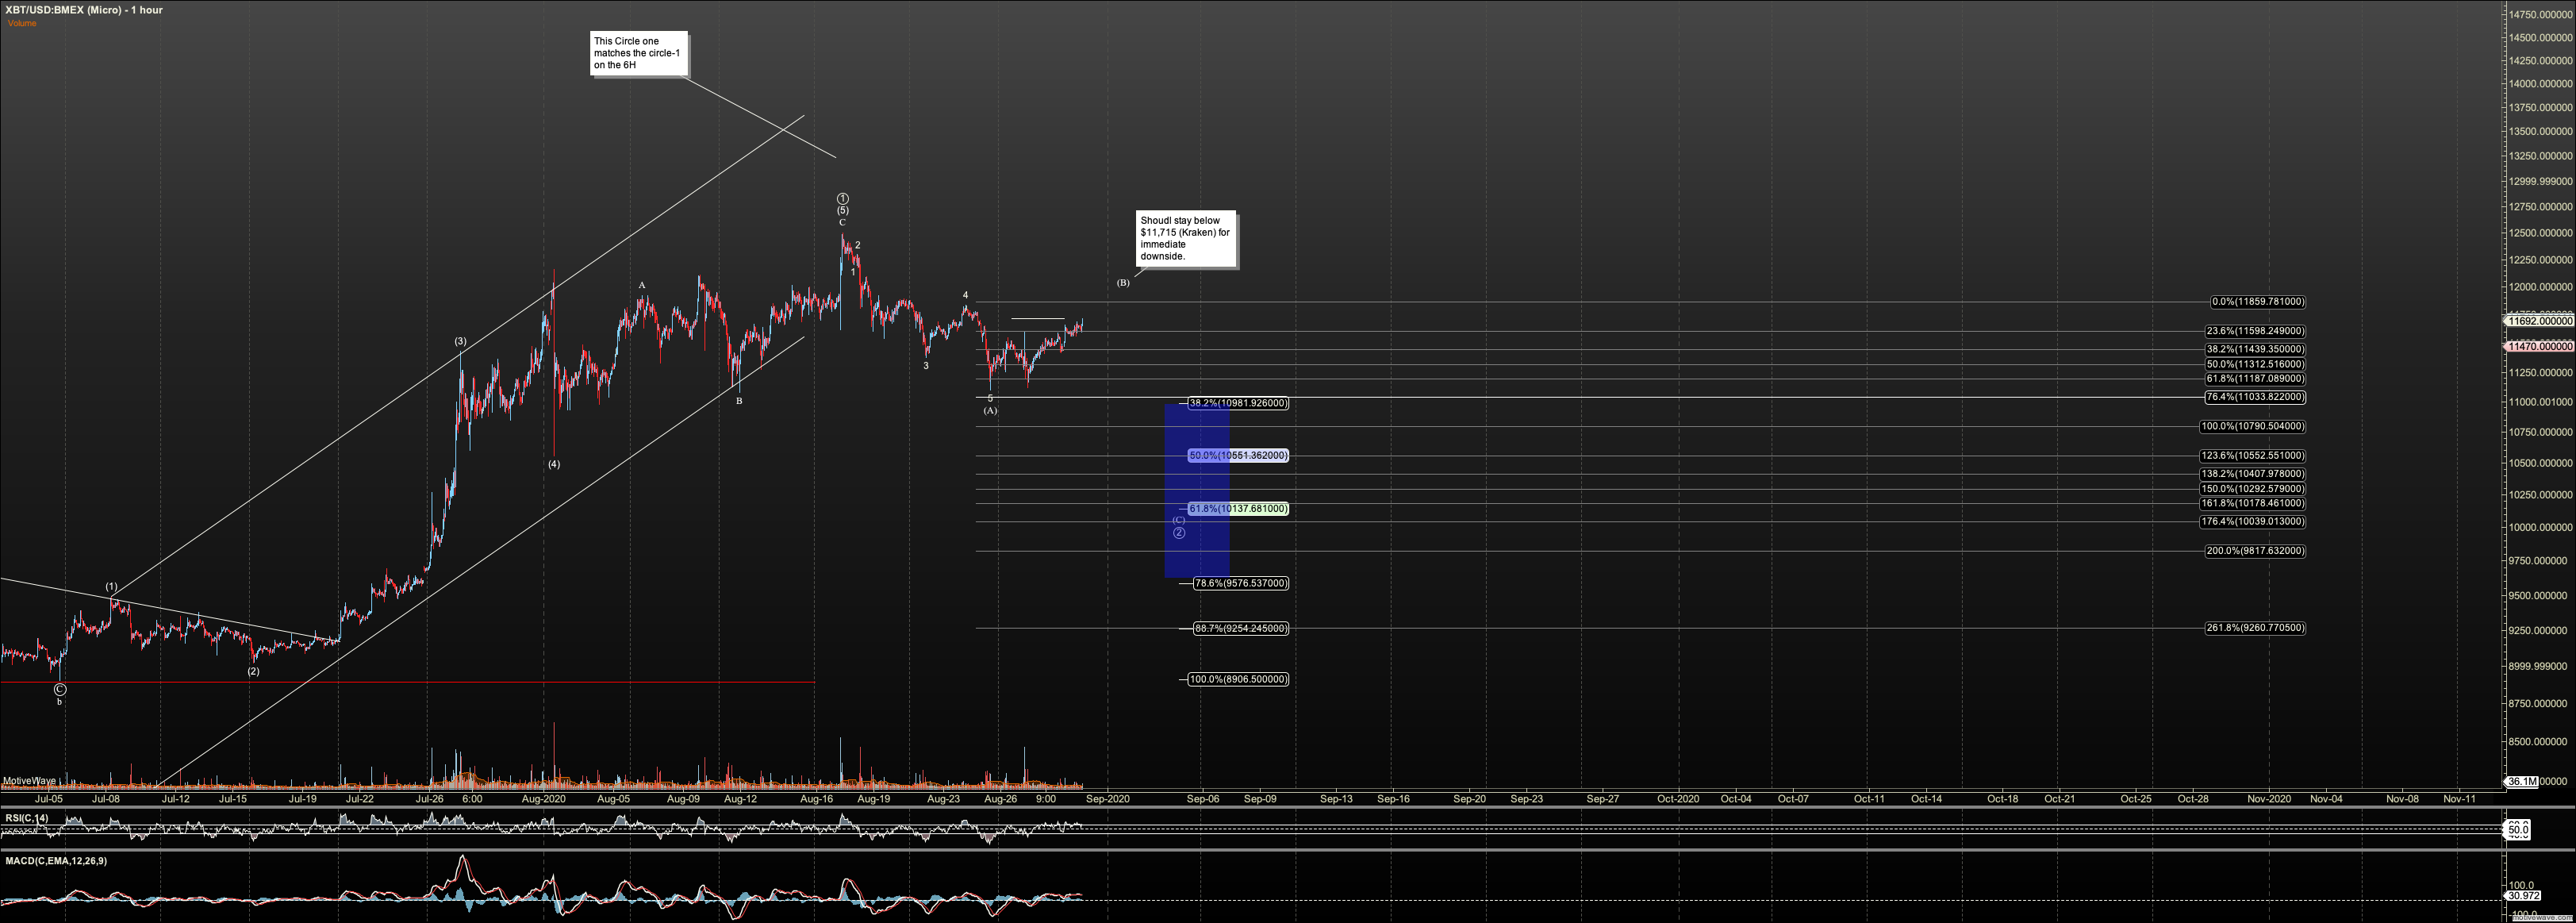
In both scenarios, I consider the the June 27th low at $8800 very important. In the bullish scenario this low is the wave 2 of our third wave that will take us toward $70K. In our bearish scenario it is either wave 2 of a C wave to $20K+ or B in a large Y wave to that same region. Therefore, breaking that level offers strong support for a B wave top. Note this region is marked by the bottom of the red rectangle on my 6H charts. Further, as of writing, breaking $9575 gives warning $8800 also breaks.
Above us, we need to watch two price levels for indication of whether we are in the B wave, or the impulsive structure. These levels are $28K and $37K. If we’re in a B wave we most likely hold below $28K, however a WXY for said B wave structure can rally to $37K. Regardless of behavior in these price regions, until we break support we should not assume a top. Support will be indicated by the 50% level between the June 27th low and current price at the time. Using this approach should both maximize return from our swing trade and avoid the B wave trap.
Ethereum Intermediate View
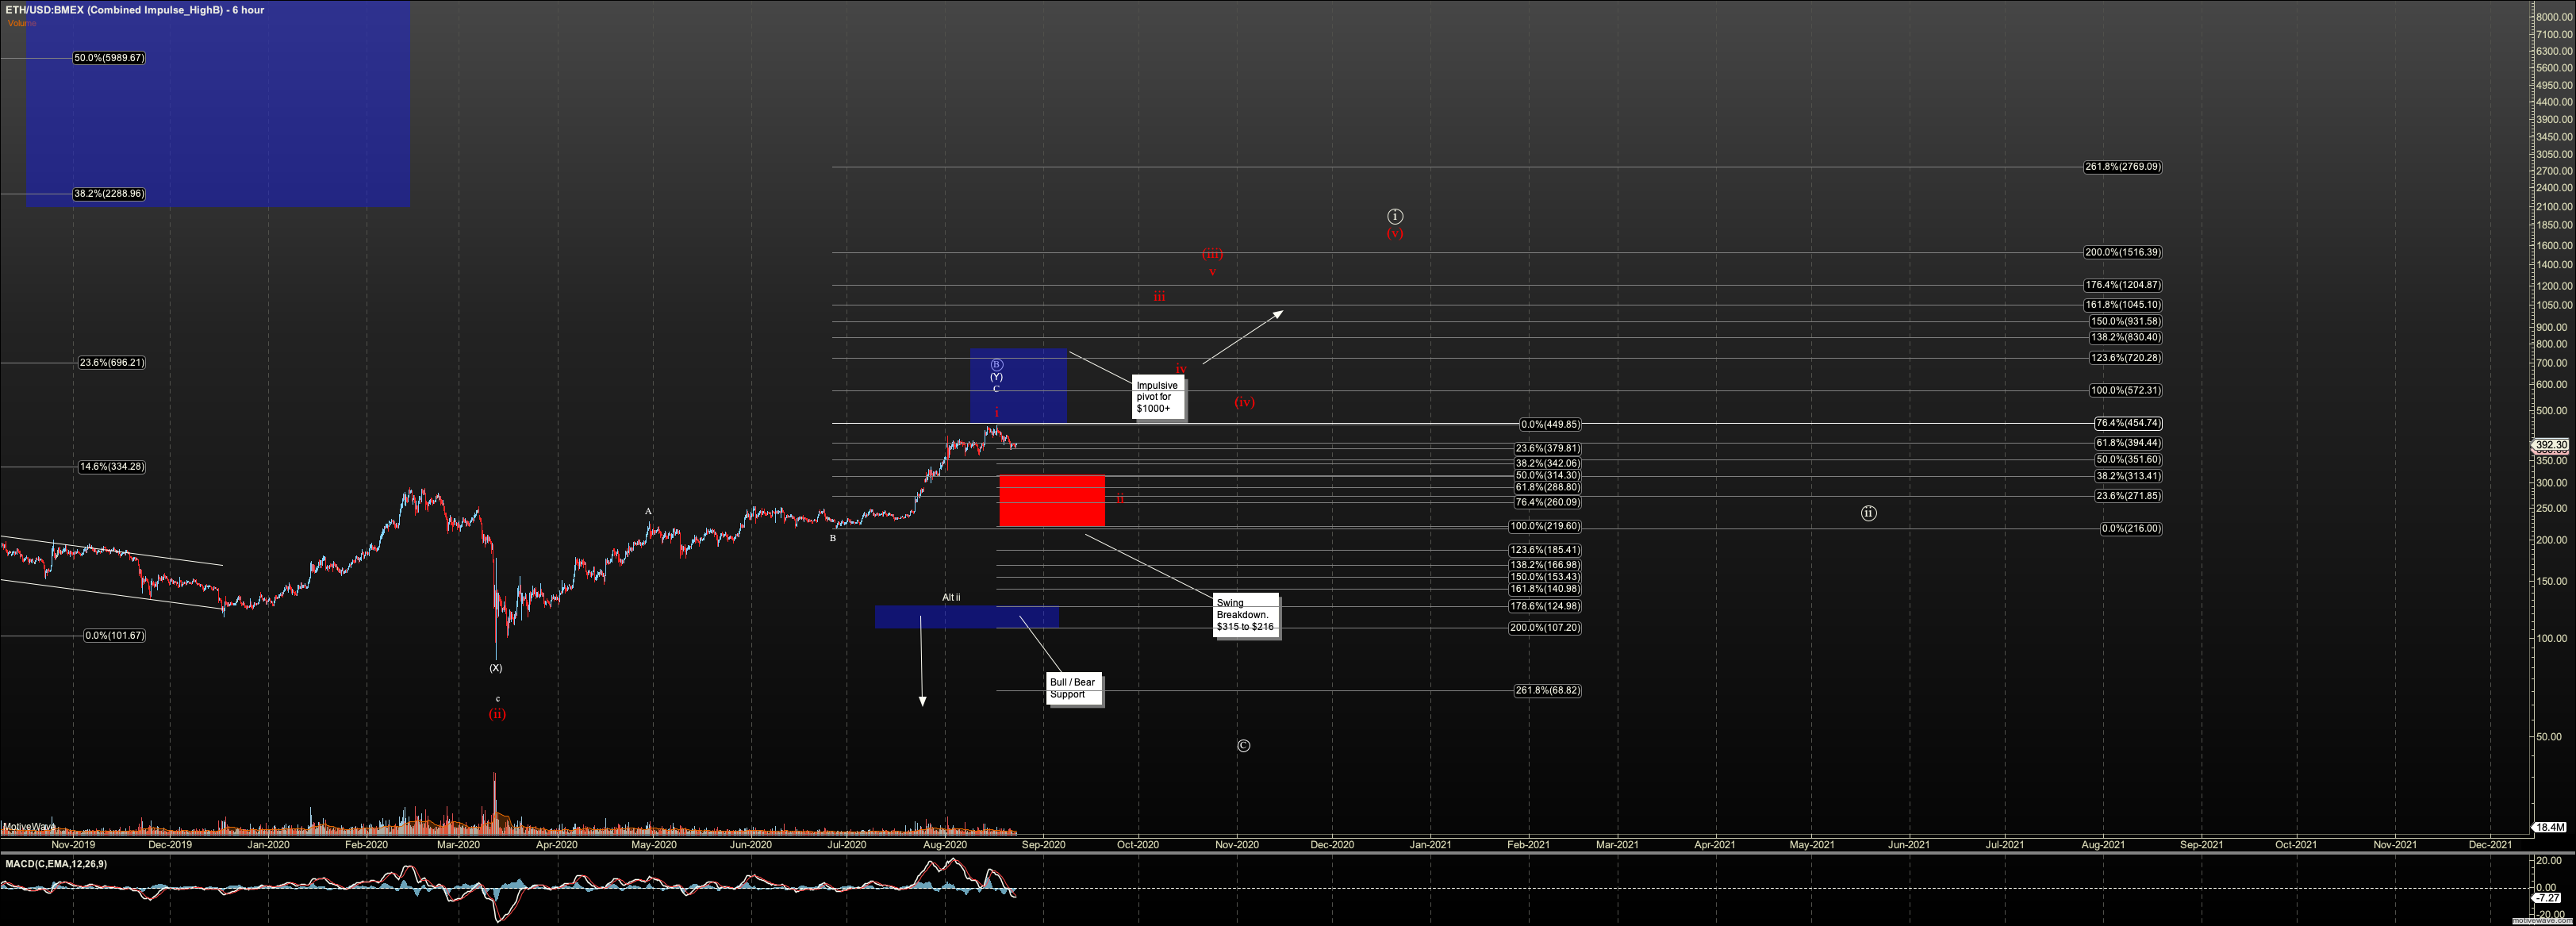
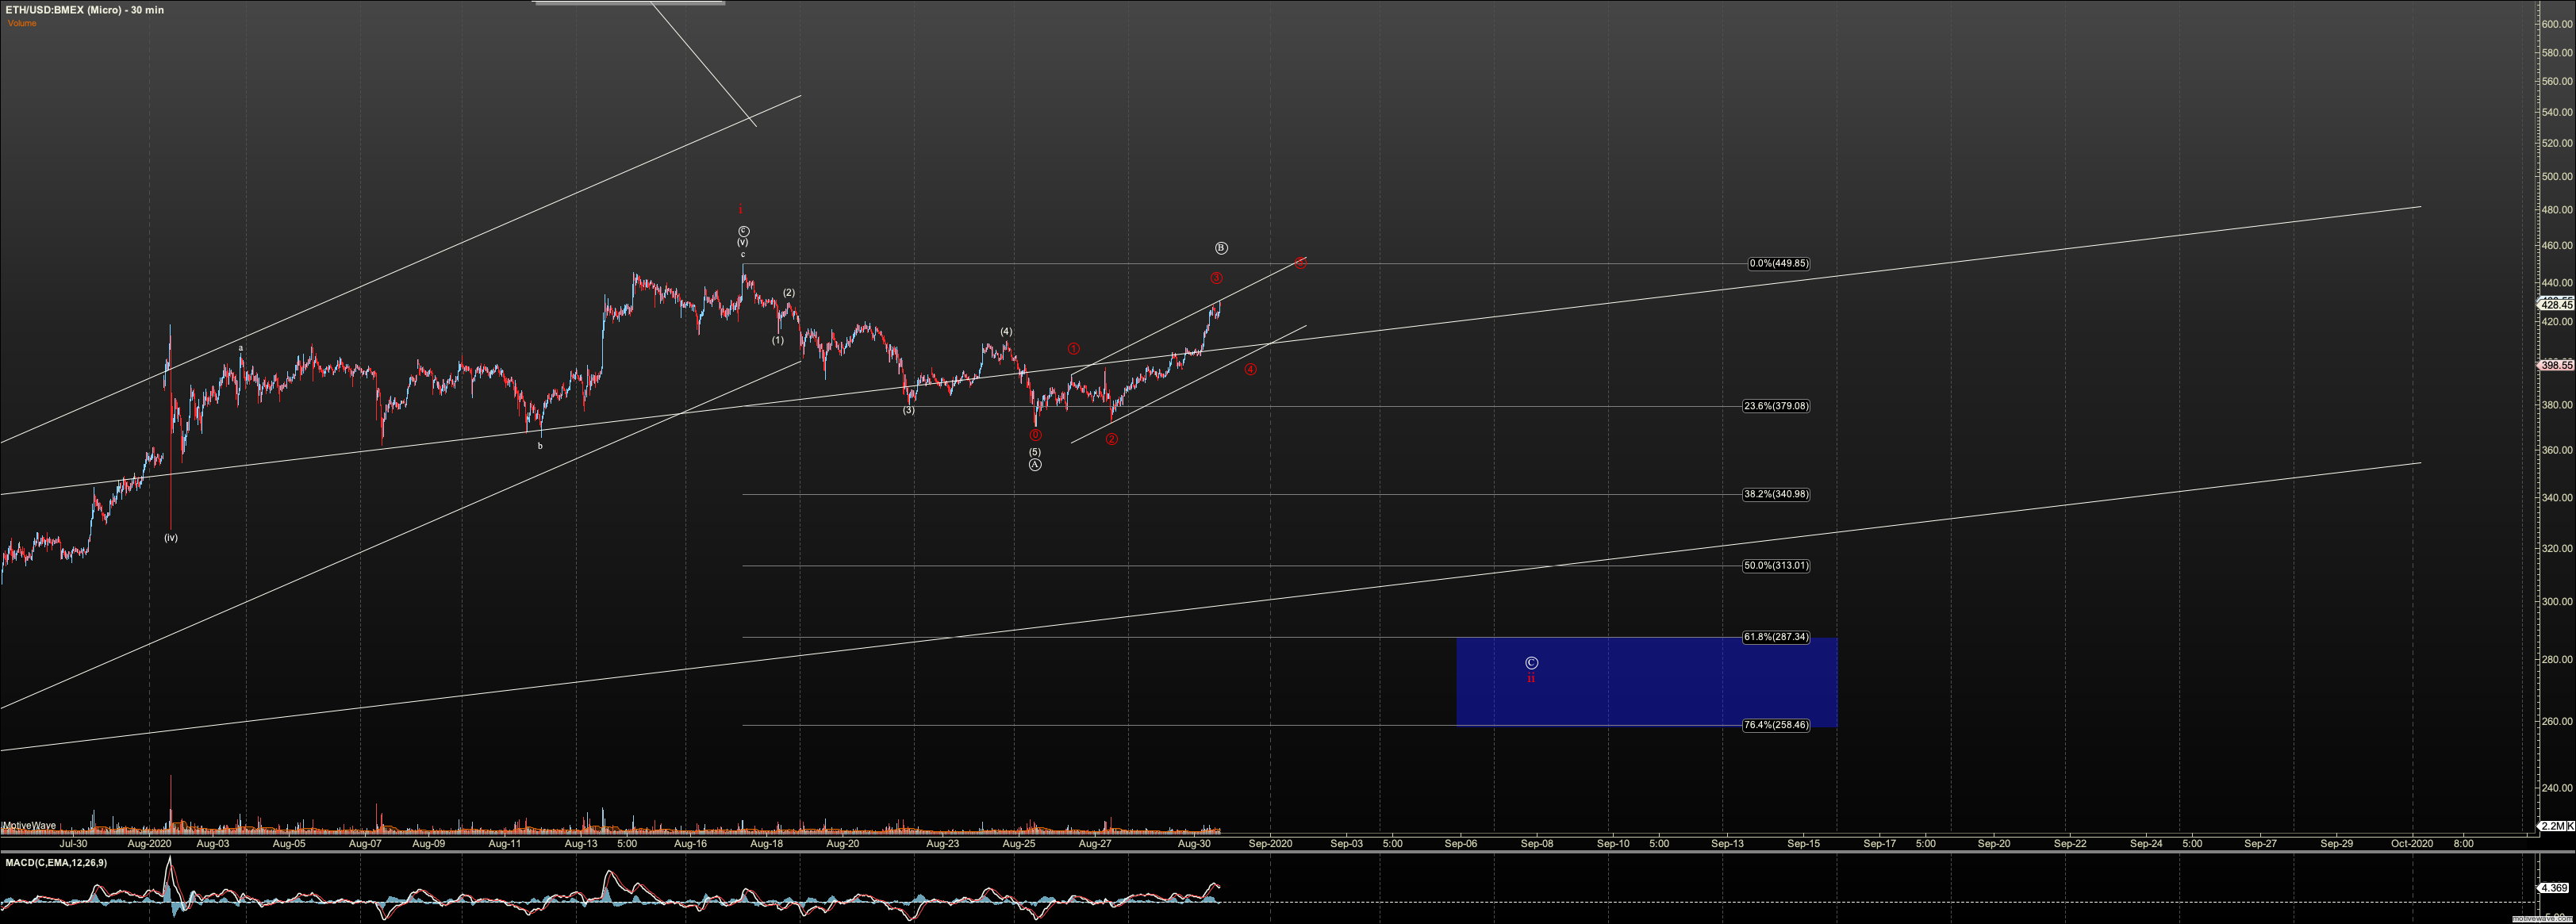
I continue to watch the impulsive scenario toward $1700+ in Ether, as well as a B wave top between current levels and $830. The expectation for the B wave in prior reports was that it would not surpass the $600 region. However, recent structure says we should give it more room, as high as $830 with a WXY structure.
The $218 low on June 27th must hold for Ether to continue higher. Since that low, Ether has rallied much stronger than Bitcoin. The extension was too far to view our recent high as the first of an impulsive third wave. Therefore Ether is giving us a strong warning that the B wave scenario is in play. Regardless, $218 must break to suggest a move down to $50 has begun. Below $285 would offer strong warning $218 also breaks.
Once we break over the August 24th high at $445 we can use a 50% stop between $218 and current price to ensure we are not trapped in the B wave top. And we can use that stop to stay on board the train to $1700 if that is the path it desires.
GBTC Intermediate View
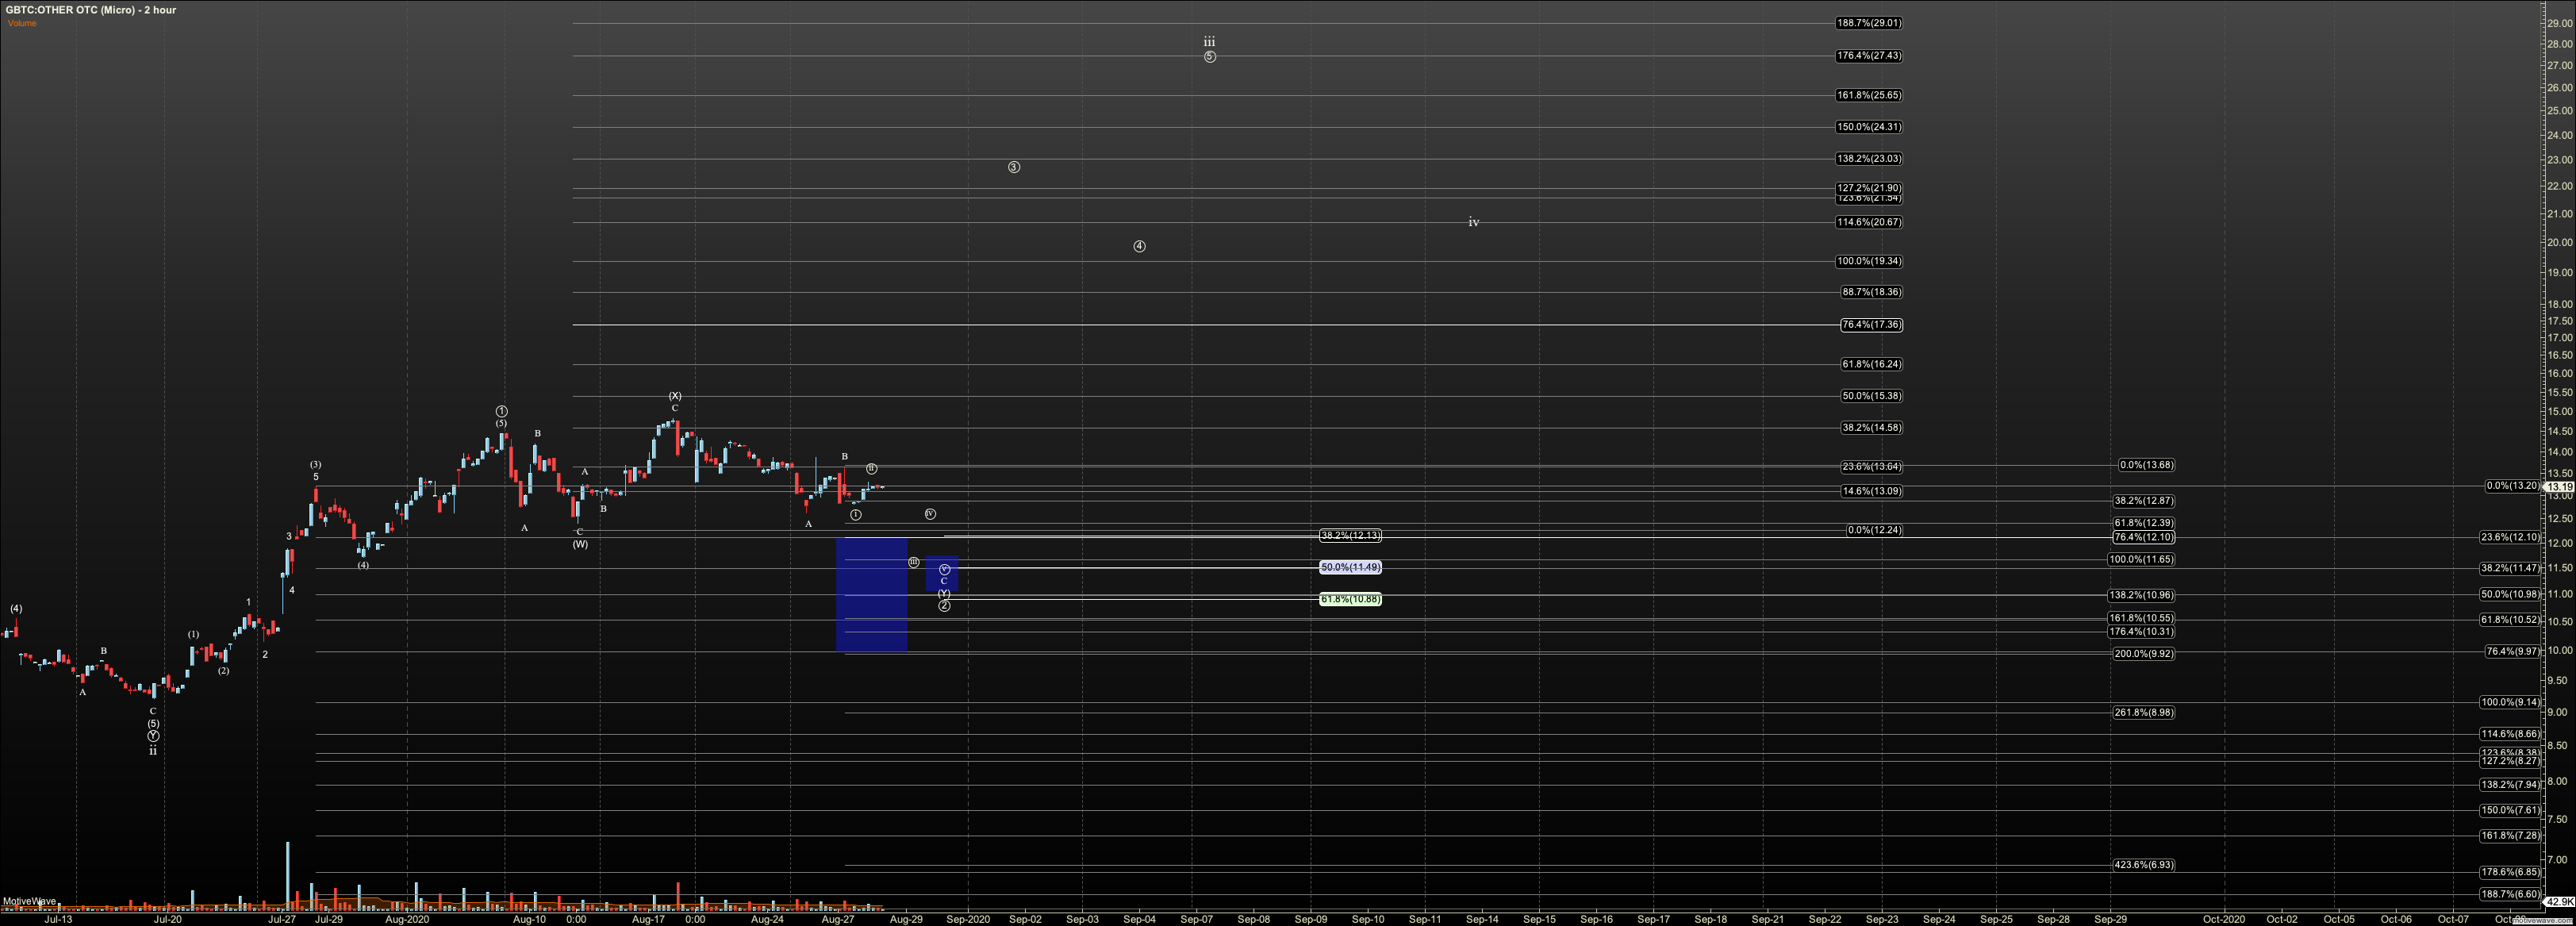
Per previous reports, if GBTC existed in isolate, the B wave scenario is not required. However, GBTC follows the 6H structure in Bitcoin well, so we must hold it possible. The difference between the charts is caused by more movement in Bitcoin outside of regular stock market hours.
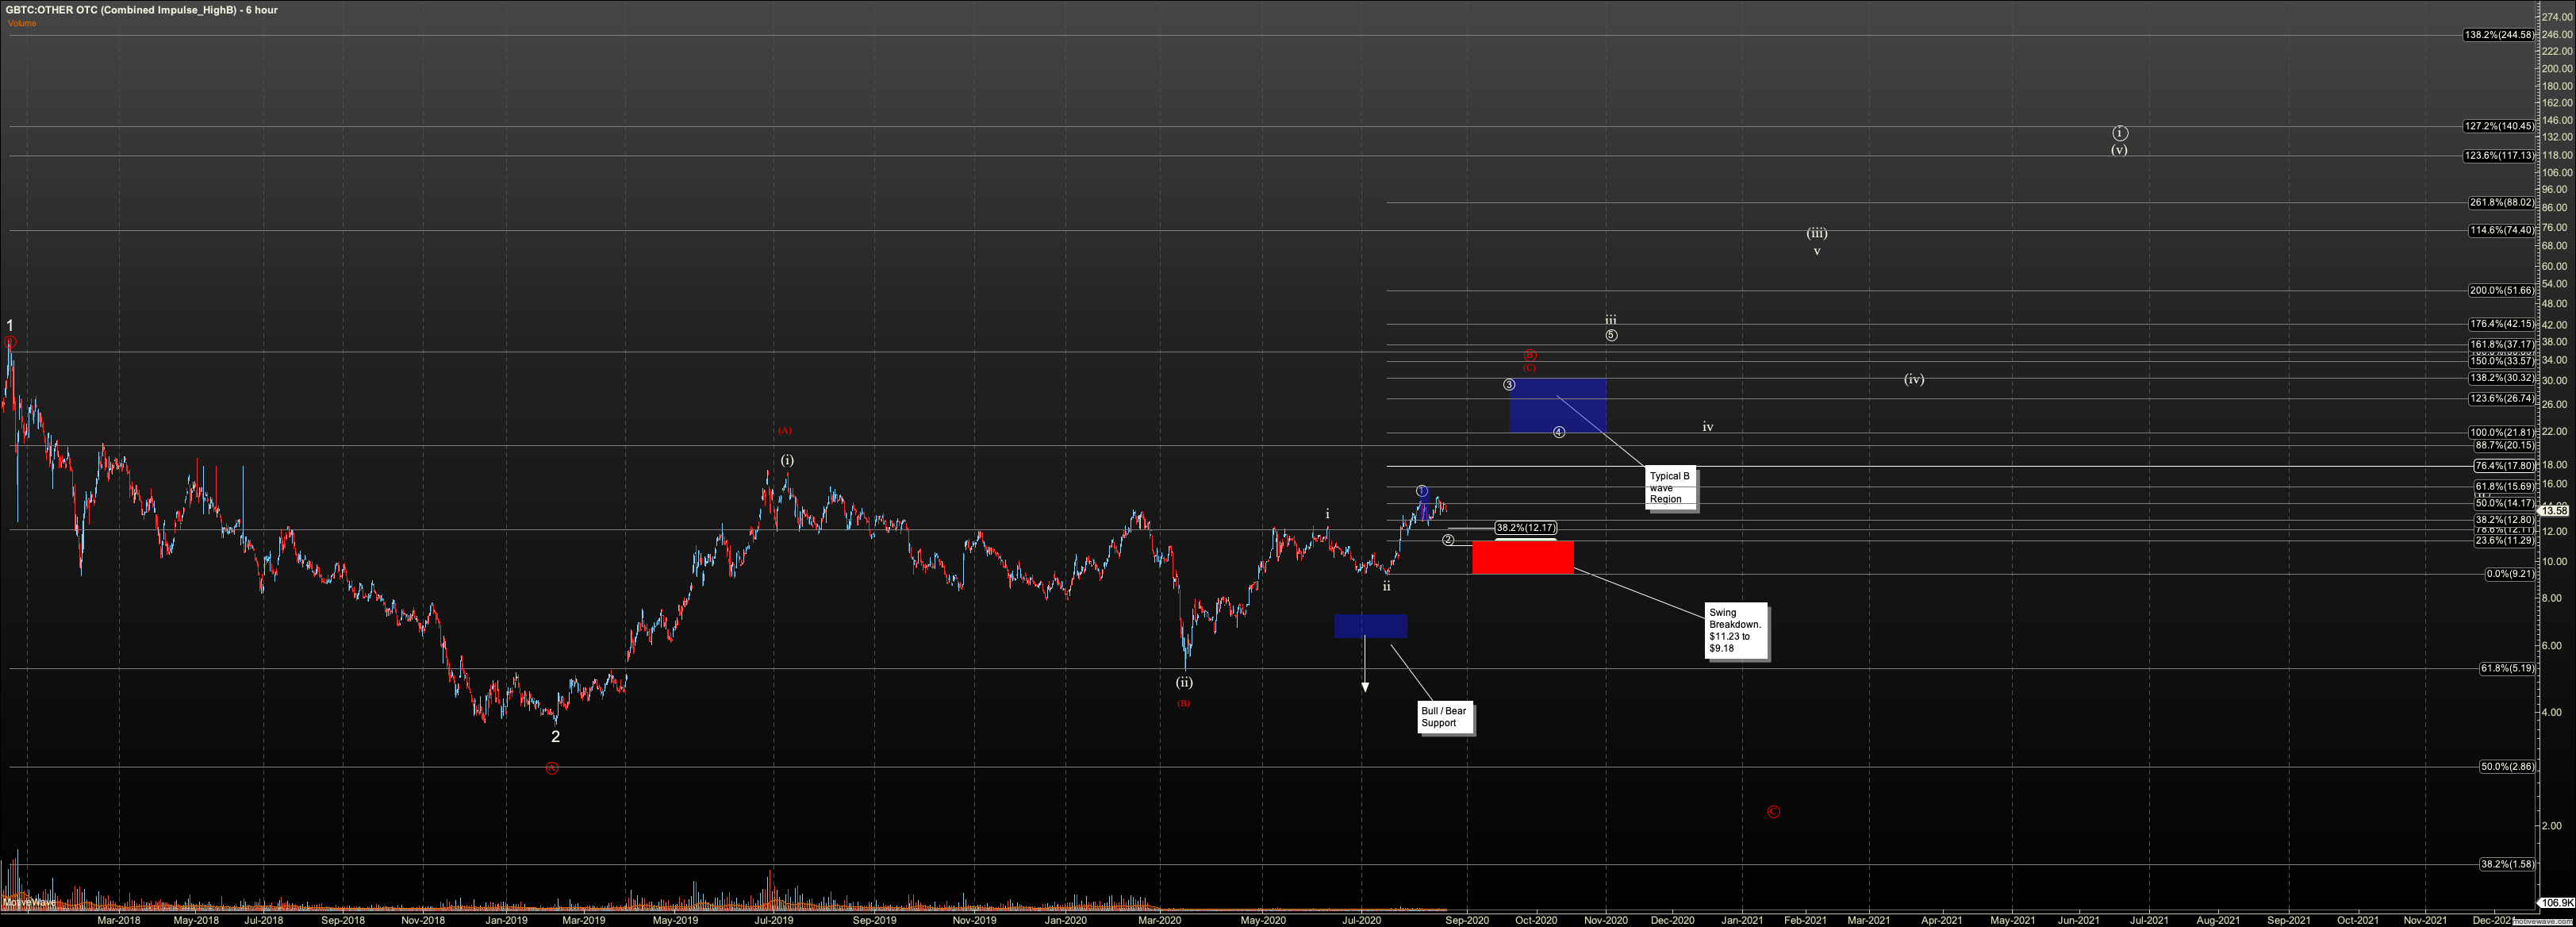
The B wave scenario points to an expectation for at least $20 before a drop to $2. The B wave may see as high as $30. Much over the latter suggests we are in an impulsive structure to over $100.
Currently, I hold that our July 20 low at $9.18 is wave 2 of our third wave on our road to $100 or wave 2 of a C wave to $20+ in the B wave scenario. GBTC structure does allow that low break, provided we hold $6. Breaking $6 should send us on our way to $2. However, if breaking below $9.18 is accompanied with a break of Bitcoin below $8800 we should be very cautious and ready for $2.
Currently, I am using the .764 retrace of our current price and the low on July 20th as our pivot to support our swing trades. Once we move over $17.80 we can tighten that to 50%, in order to maximize return in this swing trade, and avoid the B wave trap, should it play out.

