Big Picture Quick Look
 By
By
From July through November, the market found the 3400 SPX area a favorite rallying point to repeatedly break out and break down from completing the series with a breakout in November. Looking at the monthly MarketMood Indicator sentiment vs. stock market chart below, it's pretty clear that this would have been the likely scenario, and why we were able to call 3400 a "magnet" for price over the last few months.
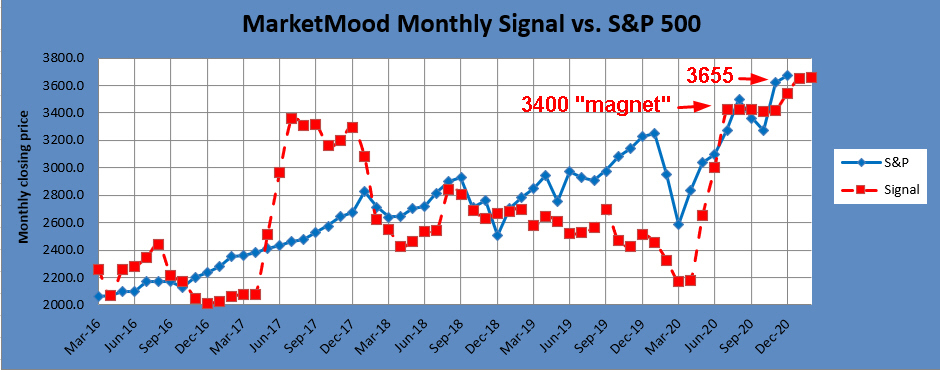
Looking at our chart we can see another one of these potential breakout / breakdown / magnet areas at 3655. While the market may find this a good region for a breakout and blast off to hitherto unknown regions of numbers, it would be difficult to do this just yet for several reasons. 1) The market "prefers" to do a breakout through these regions from below. Starting out 2021 above it would make this January-February timeframe a likely breakdown period. 2) The market overextended itself in November and is currently above where it "should" be per the chart. 3) Weekly data shows next week is more likely bearish than not.
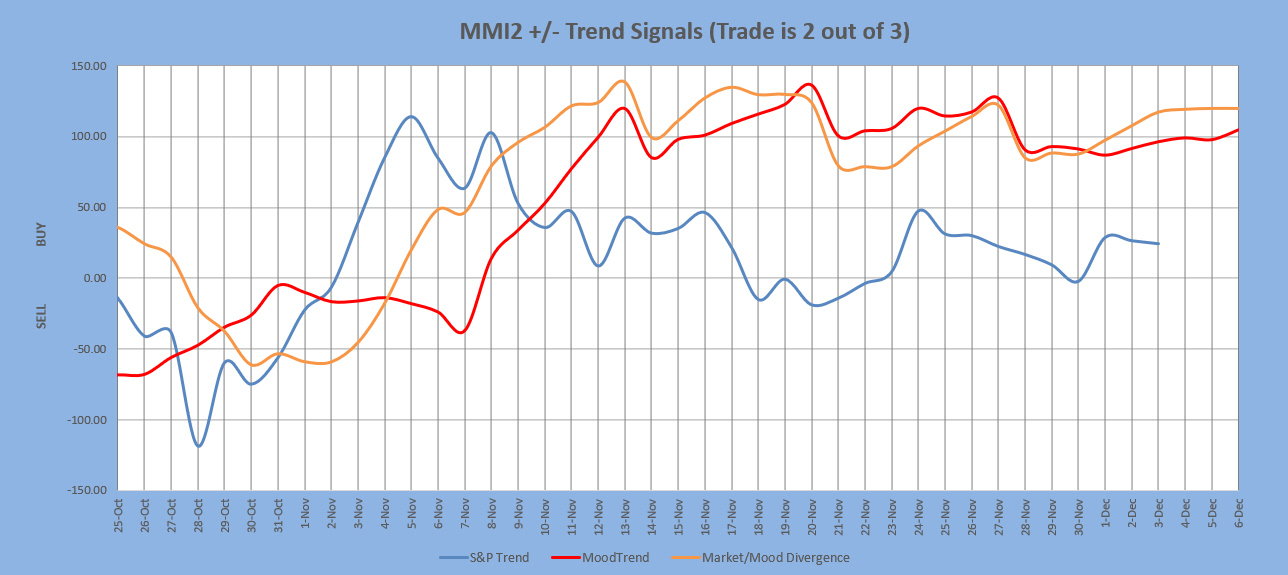
Finally, with daily data, the MM Trend Trader (below) continues to signal "buy" and show the trend as up. As long as daily sentiment is pulling up, it will be difficult to get a really good pullback. Perhaps by early next week this picture could change, but no sign of that yet.
So, there are good reasons for at least a nominal pullback prior to blast off, and the coming week would be a good opportunity for at least some of that. In the meantime, expect 3655 SPX to be a market touchstone at least through January. If above it as the new year begins, expect the market to want to break below it prior to taking off for new territory.
