Bifurcated Metals Complex Seeing VERY Bullish Pockets
With the continuation move in NEM, along with the break out in GOLD, I thought it would be appropriate to write another update for our membership.
Once NEM broke out last week, I noted that I simply could not retain a bearish bias any longer. While I still expected a pullback in a number of charts, an overall bearish bias was simply not warranted.
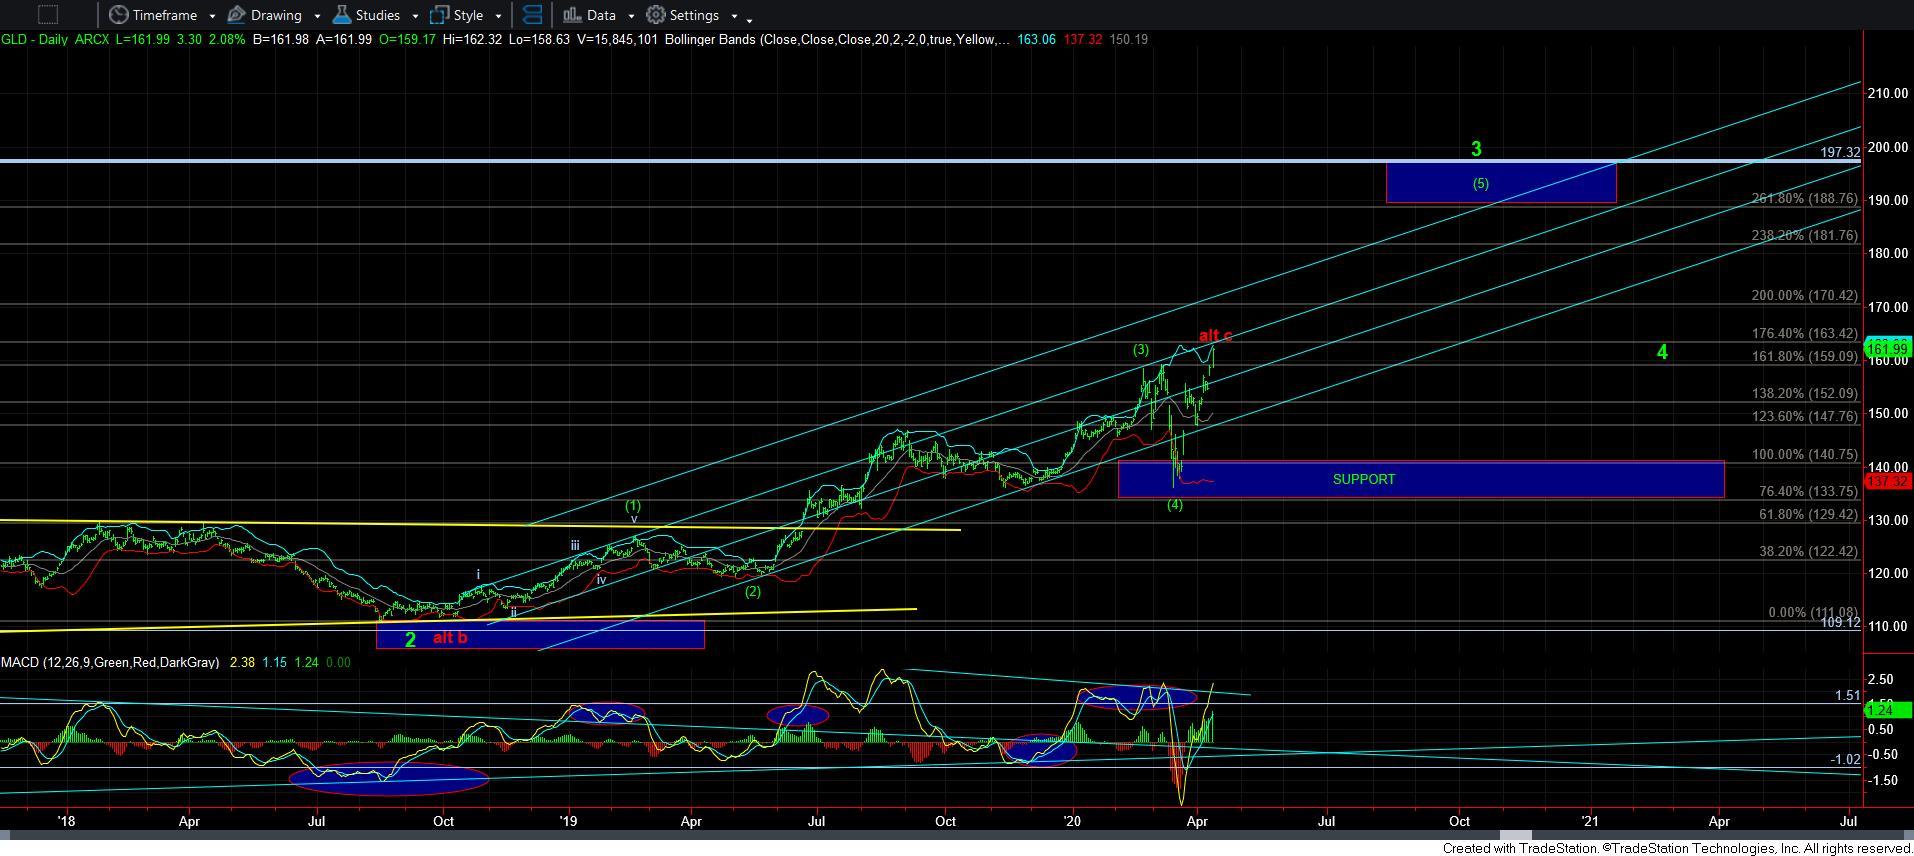
Now, due to the larger degree structure in GLD, I had to retain a VERY cautious stance until GLD was able to move back up through the 159 region for the reason cited in the past about the potential red count. It was for this specific reason that I noted I was buying protective puts until the market could prove otherwise.
Over the last several years, we have been quite successful in protecting our long positions when the market hit the resistance levels we cited. In fact, most of the time, I was making money on my hedges. And, since hedges are supposed to be used as insurance, it was nice making money on them. Yet, I have longed for the day that my hedges would go to zero. It is quite possible that day may have come.
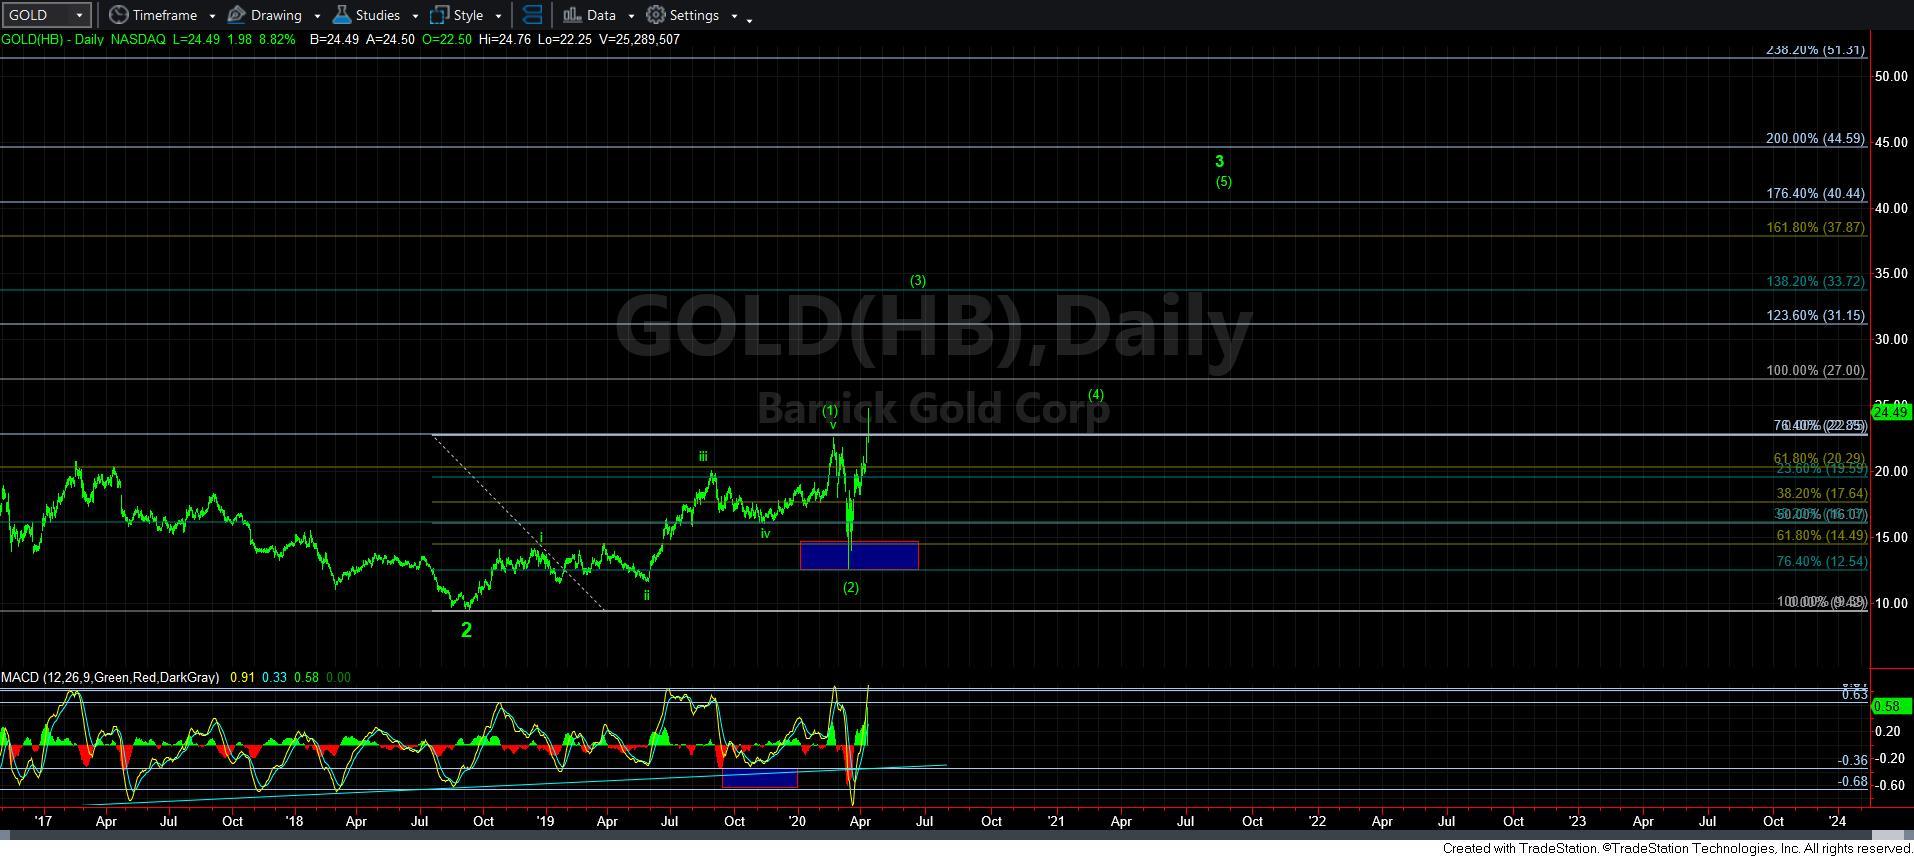
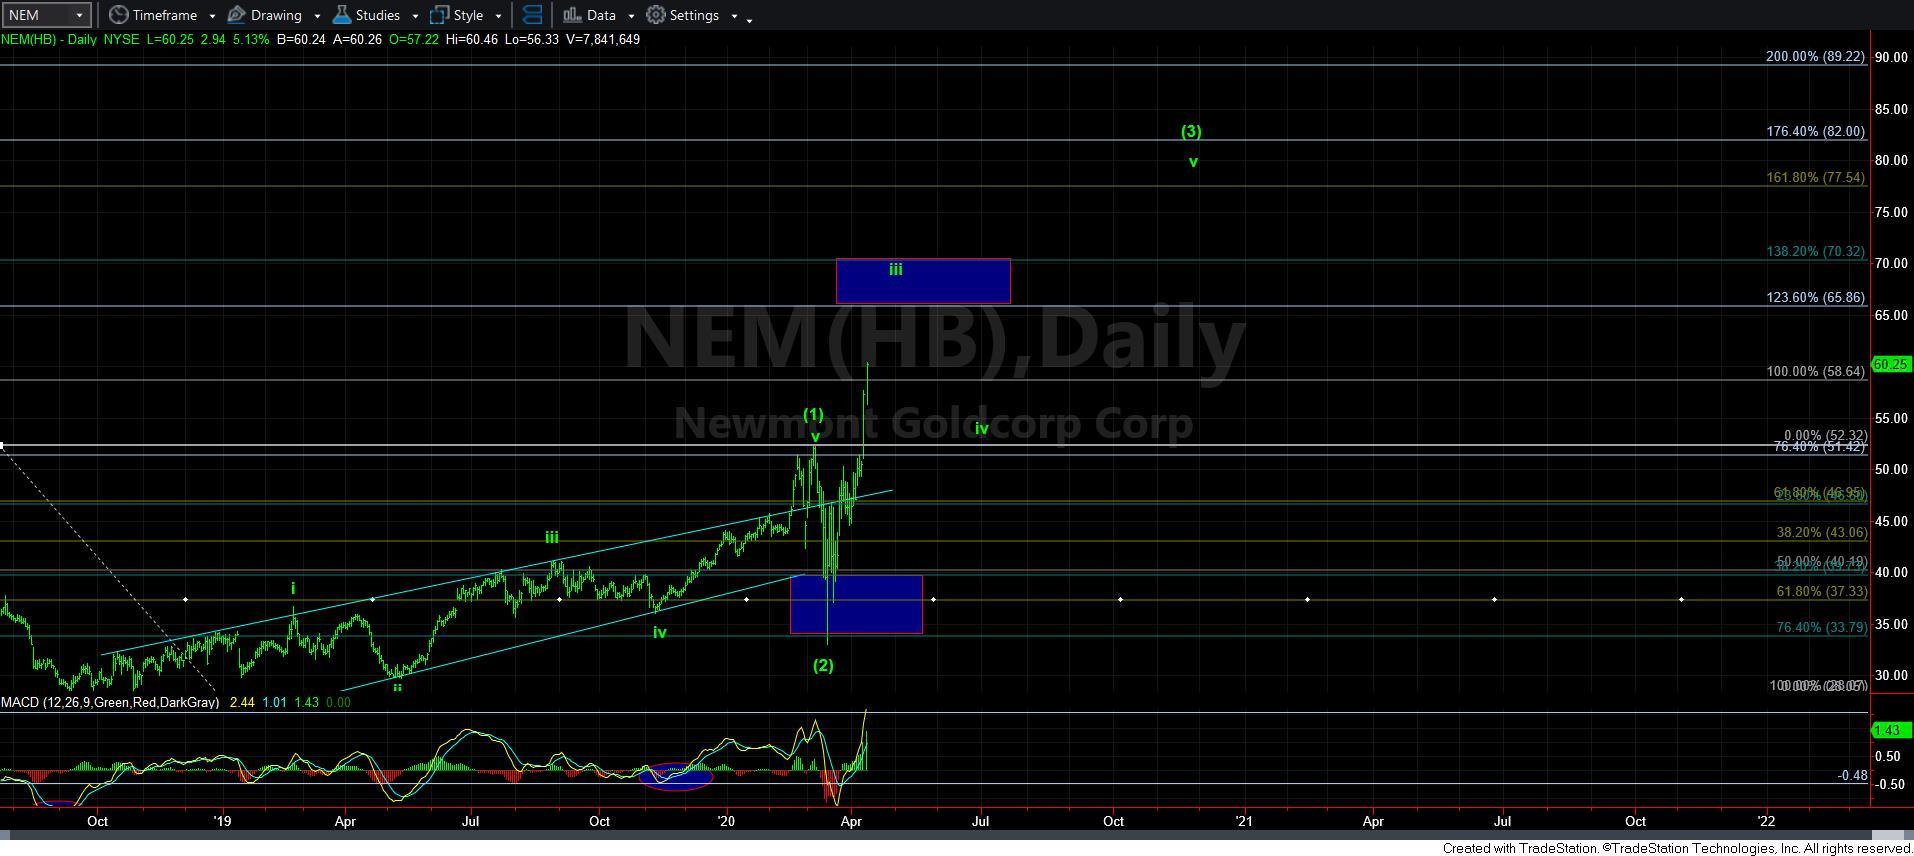
First, I want to post the NEM and GOLD charts. As you can see, the break out suggests that as long as we do not break back down through those levels, we have likely begun the heart of the 3rd wave in those charts. And, I have added the higher wave degree general targets, as you can see.
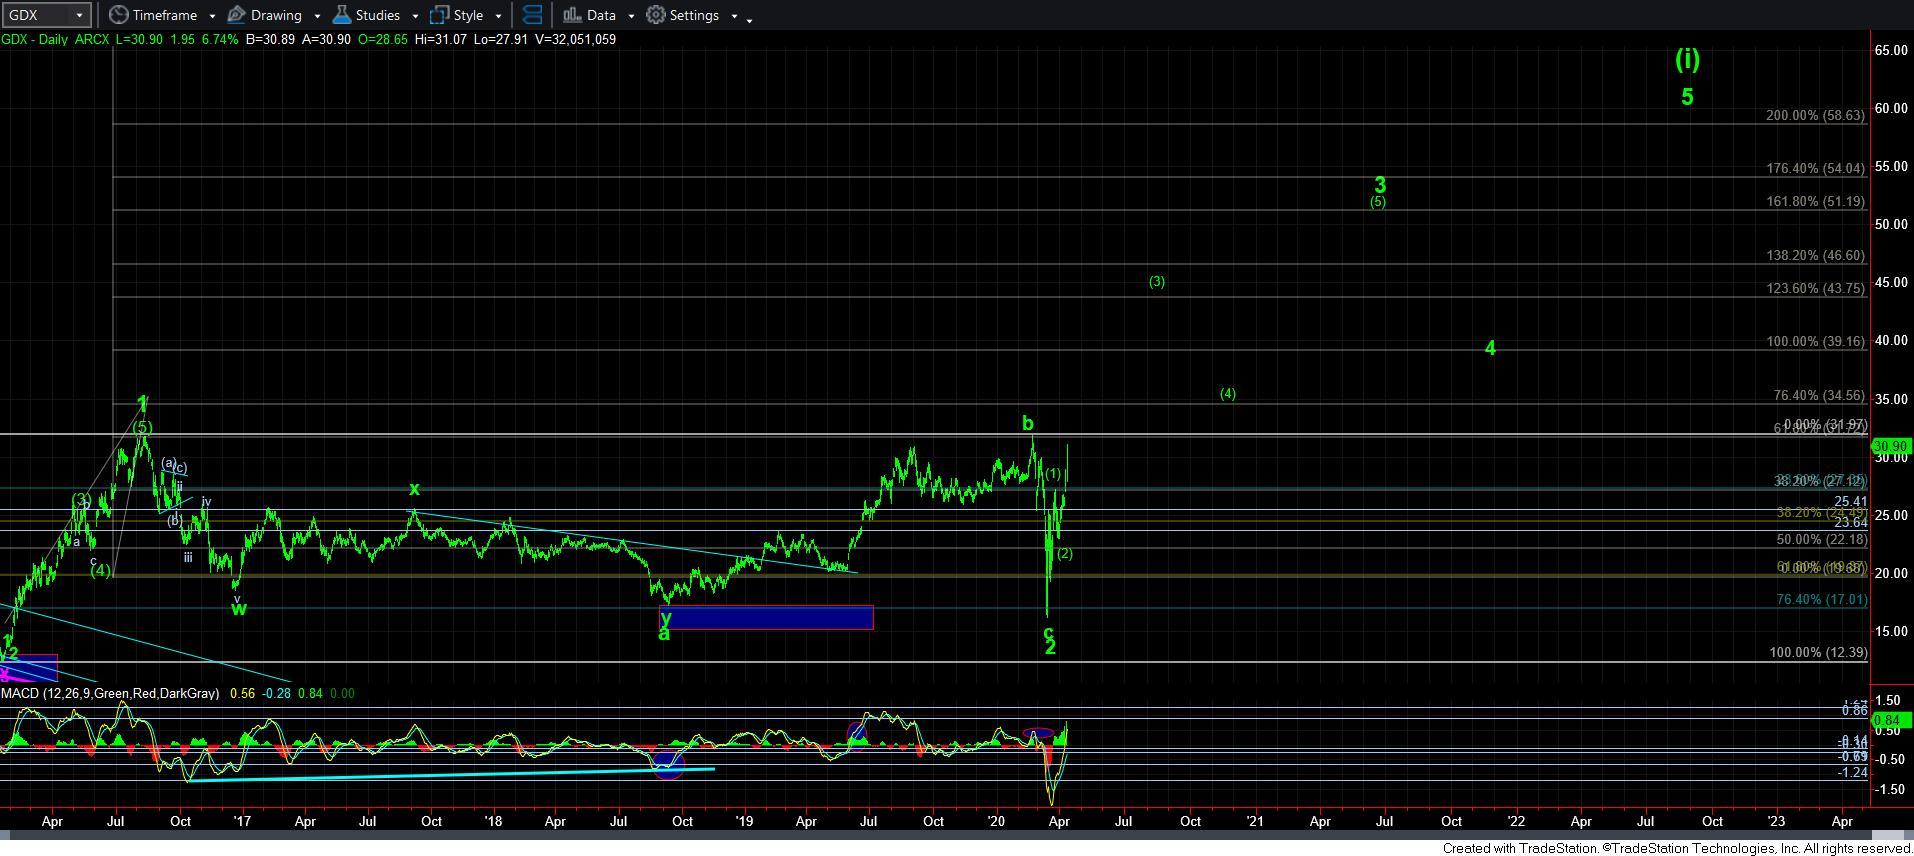
Second, GDX has still not performed any where near as well as the NEM or GOLD charts. It still has not broken out through its resistance of its wave [1] high. But, should it do so, I have added the longer term targets for that structure as well.
Now, I want you to understand that the targets on these charts are the “standard” Fibonacci Pinball targets we normally see in a 5-wave structure. But, we often see the metals complex provide much stronger extensions when they get moving into a heart of a 3rd wave. So, as long as we do not break back below the high of wave [1] after the break outs, you can reasonably expect these to be minimum targets for their various wave degrees cited.
As far as GDX is concerned, I really cannot say that I am hugely confident in the micro count as shown, but if we break out through the b-wave high, I think this becomes highly probable.
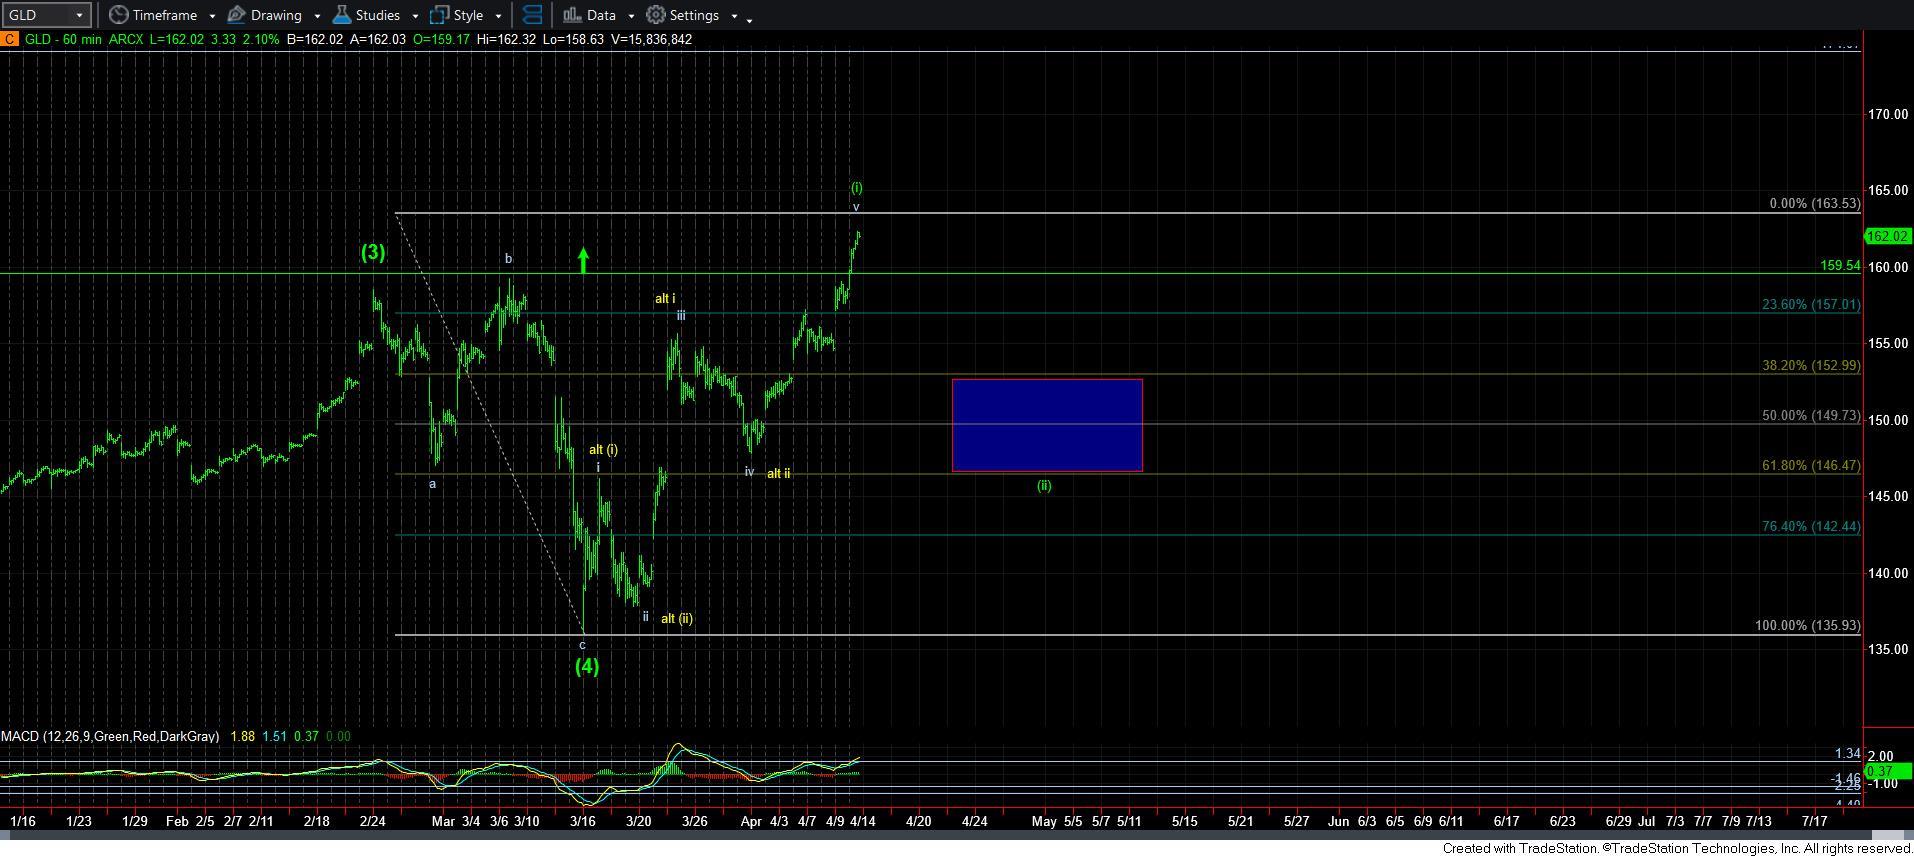
When it comes to the metals, we really have different worlds playing out right now. Ideally, I would still like to see a corrective pullback in GLD. However, if we see continued strength through 163.50, then I have to assume we had a [i][ii]i-ii structure off the lows as shown in yellow on the 60-minute chart, which would suggest we are heading up to the 190+ target region sooner rather than later.
As for my hedges, if we are able to see a corrective retrace, I will likely sell at least half of them during that retrace.
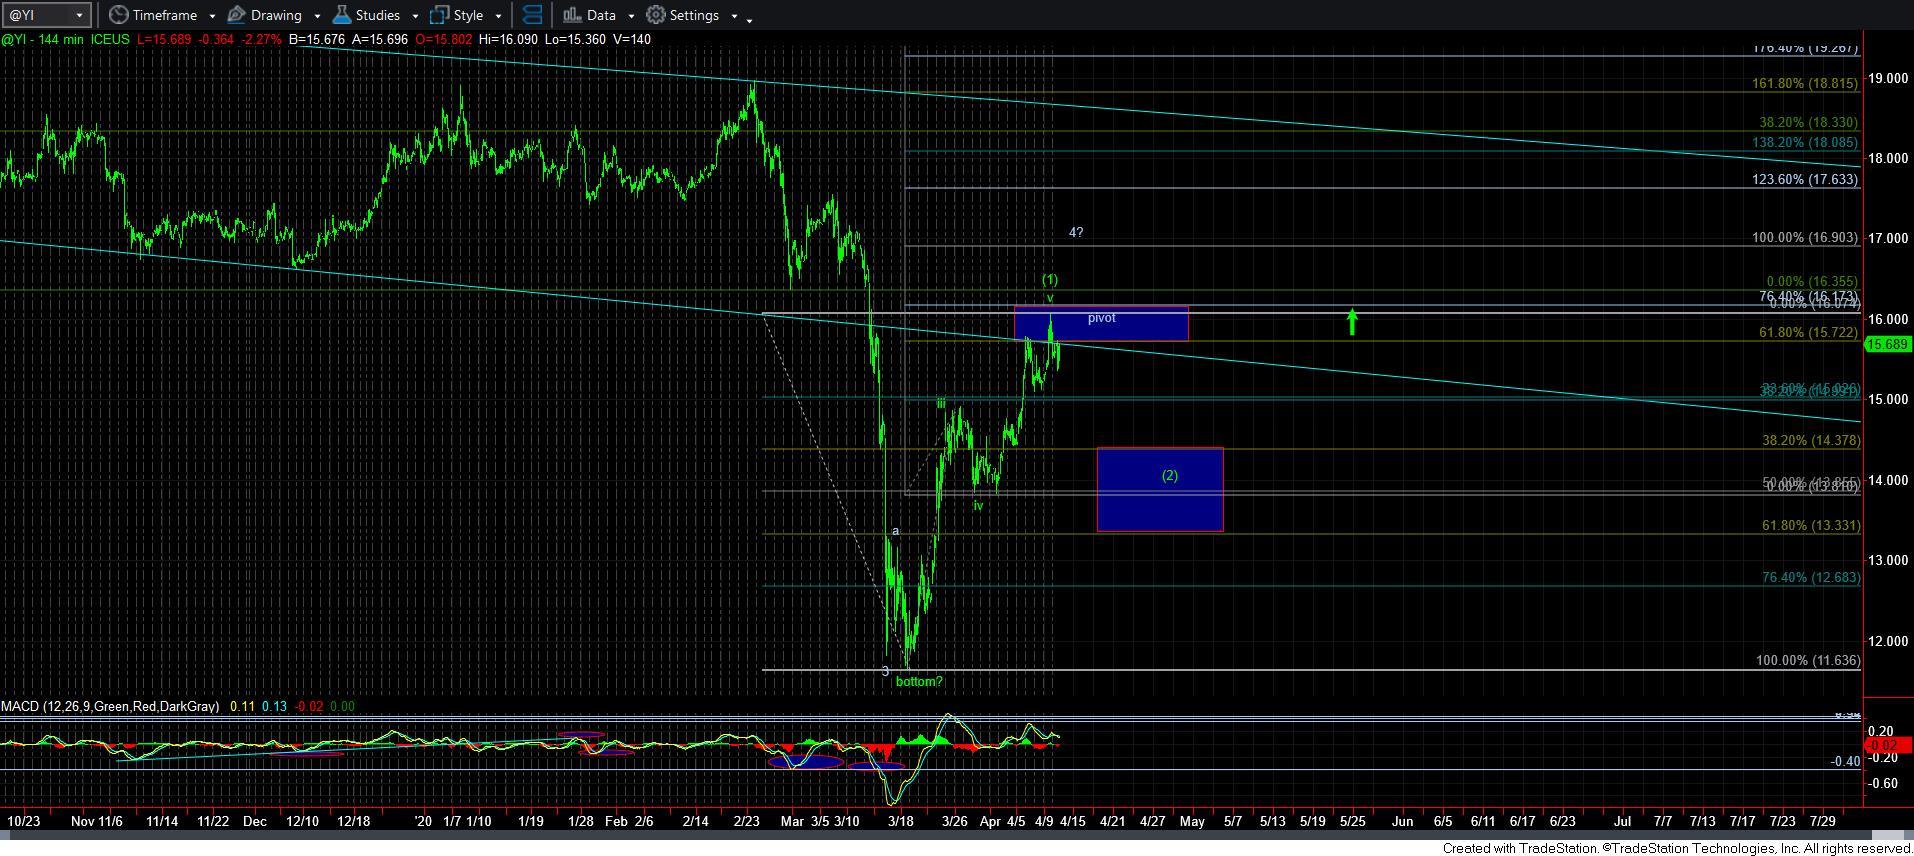
Lastly, silver still lags the market. But, I must warn you, when it does start moving through the 17 region, you will likely see a breathtaking catch-up move in silver. And, we will likely see most of the laggard mining charts following silver on that move.
So, my larger degree bias has been and remains bullish. The only question still outstanding is how much of a pullback is seen, if at all. And, while several weeks ago I thought that the pullback could be deeper, I do not have anything suggesting such a deep retracement at this point in time. In fact, this is the time I am hoping that my hedges/insurance finally becomes valueless to me. 😊