Between Several Potential Counts
While the market continued higher early this week as we were primarily expecting, the size of the rally seen on Tuesday has placed questions into the micro count. Our primary count remains bullish until proven otherwise, which means we are looking for a completed 5 wave structure for wave (i) of the next rally phase.
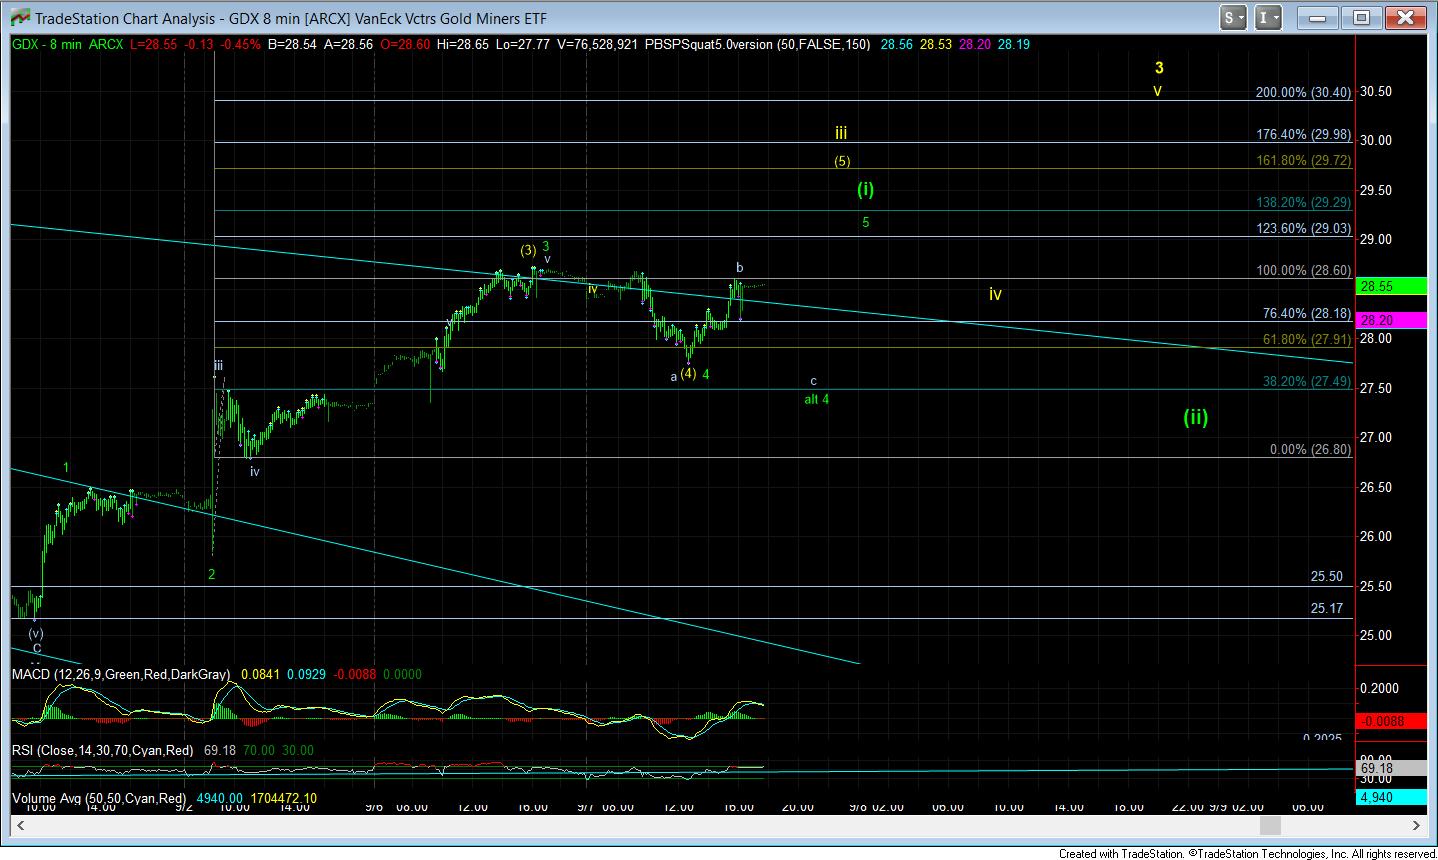
As of the close of business on Wednesday, we still do not have 5 waves up off the lows, but we have two potential counts we have been tracking. My main count still remains the green count, and the reason it “looks” funny is because the 5th wave of the 3rd wave in the green count was extraordinarily extended. In fact, it was so extended that it led us to looking at it as the heart of the 3rd wave of a much bigger 5 wave structure, which we have labeled as the yellow count.
But, in going back to the green count, as long as we remain over 27.50, and below 29.07, then I will be looking for this to present us with a completed 5 wave count for wave (i) in green. (As noted in an update today, wave 1=5 in wave (i) at the 29.07 level). Also, take note on the 8 minute chart that a c-wave down in a more expanded wave 4 would make this count an even stronger primary count.
However, if the market were to continue to break out tomorrow and move strongly through the 29.07 region, then the yellow count will be the operative count, with wave iii of 3 pointing us towards the 29.29-29.72 region. Should that occur, then 28.60 becomes our next support for pullbacks.
(I know I have been focusing much more on the GDX, and the reason is because the count on that micro chart is the cleanest I have within the complex).
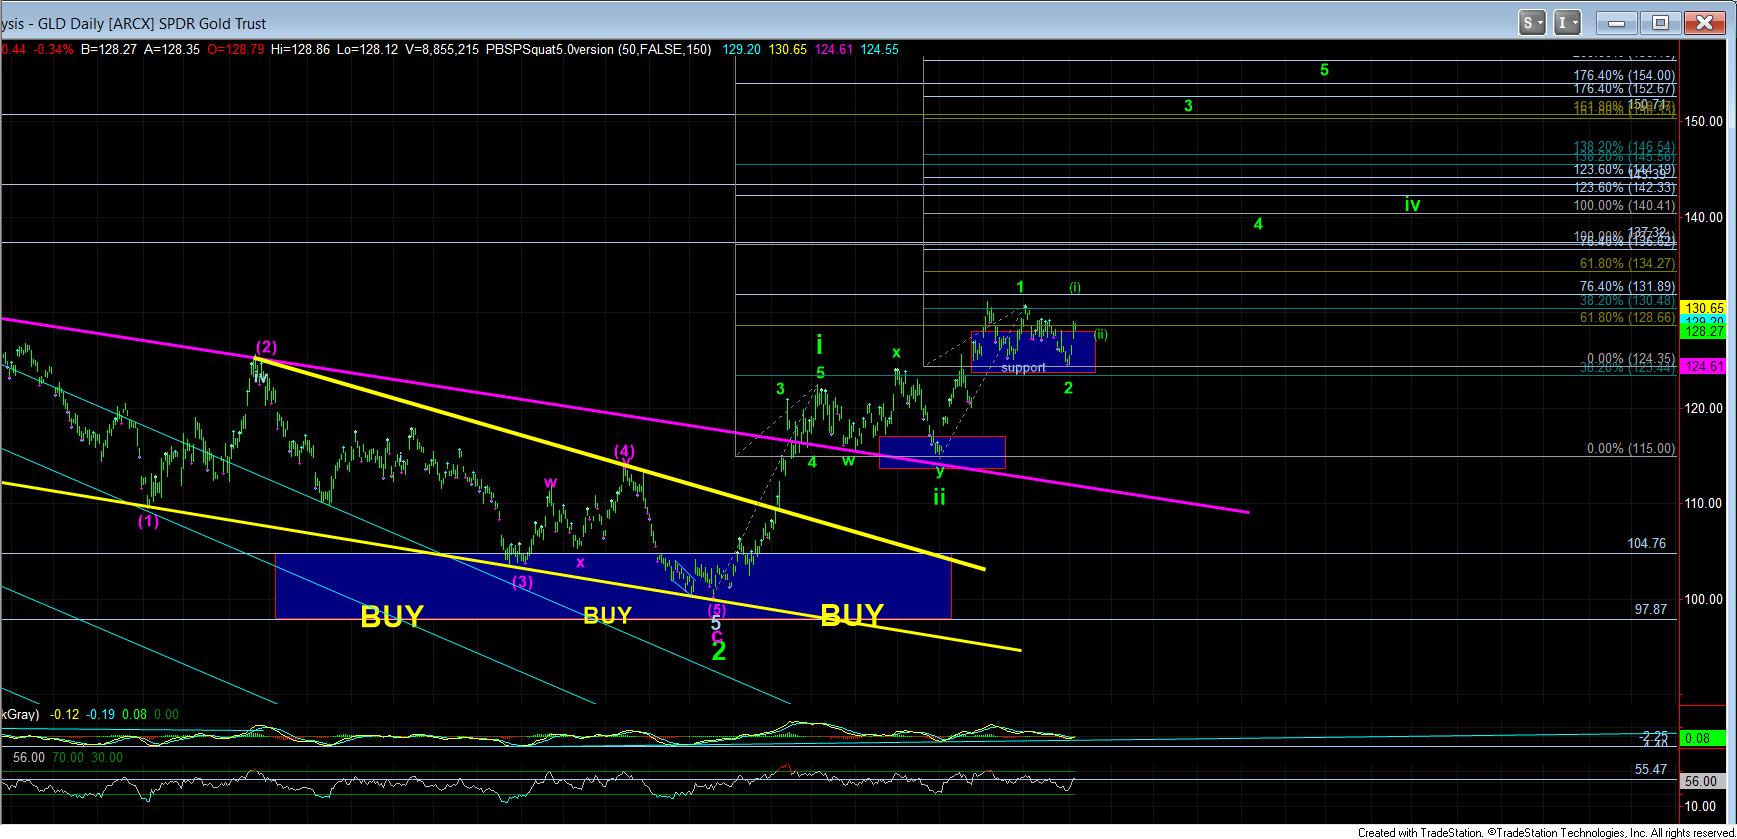
As far as the GLD, as you can see on the daily chart, as long as we remain over the last low we recently struck, this set up is quite bullish, and suggests we are about to see the heart of a 3rd wave. But, as we have noted many times before, we still need to see all 5 waves completed for wave (i) of 3, followed by a corrective pullback in wave (ii), followed by a break out over the top of wave (i), which will then be pointing us towards the 150 region for wave 3 of iii.
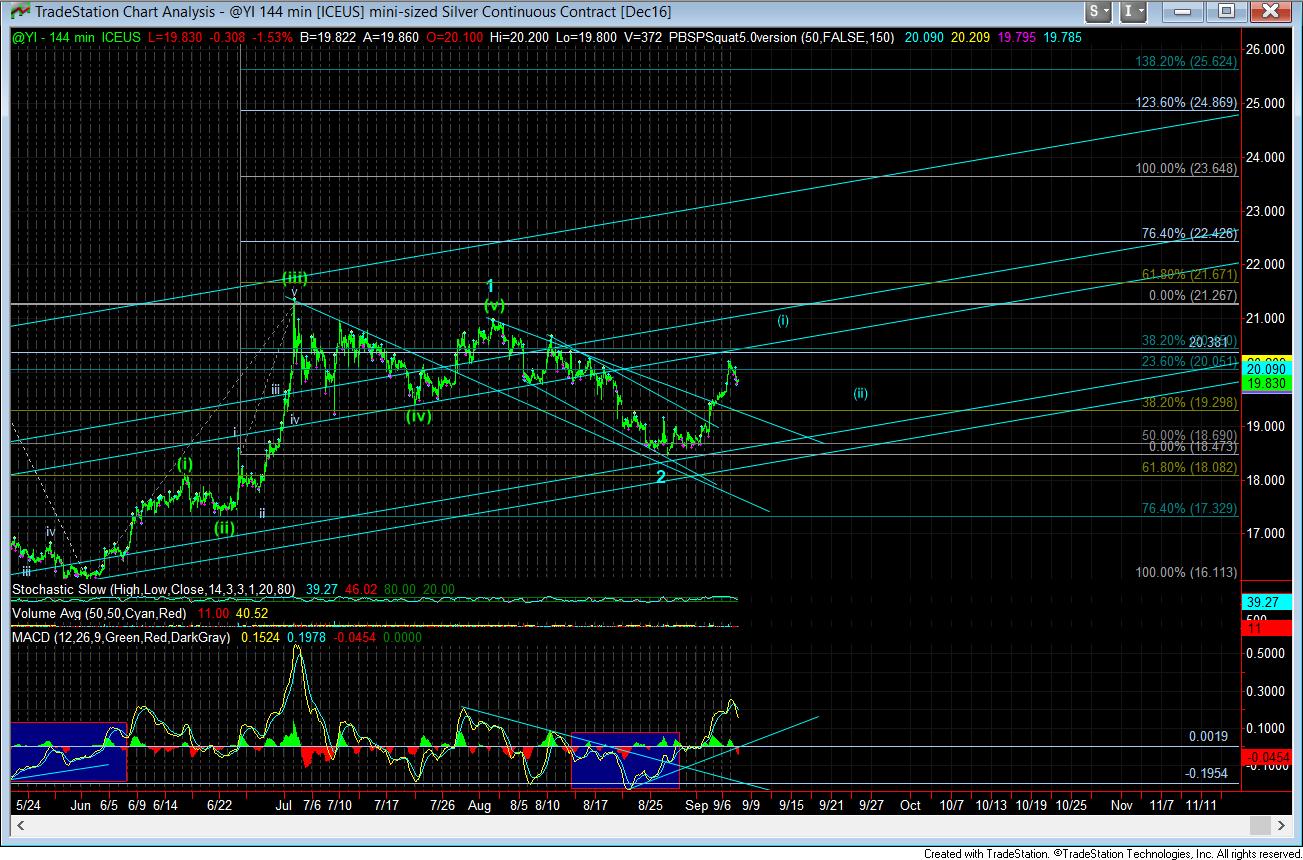
In silver, I also think we should see at least one more higher high to complete wave (i) of the next rally phase. And, once we see that wave (i)(ii) set up trigger, we will likely see a strong move towards the 25 region quite quickly.
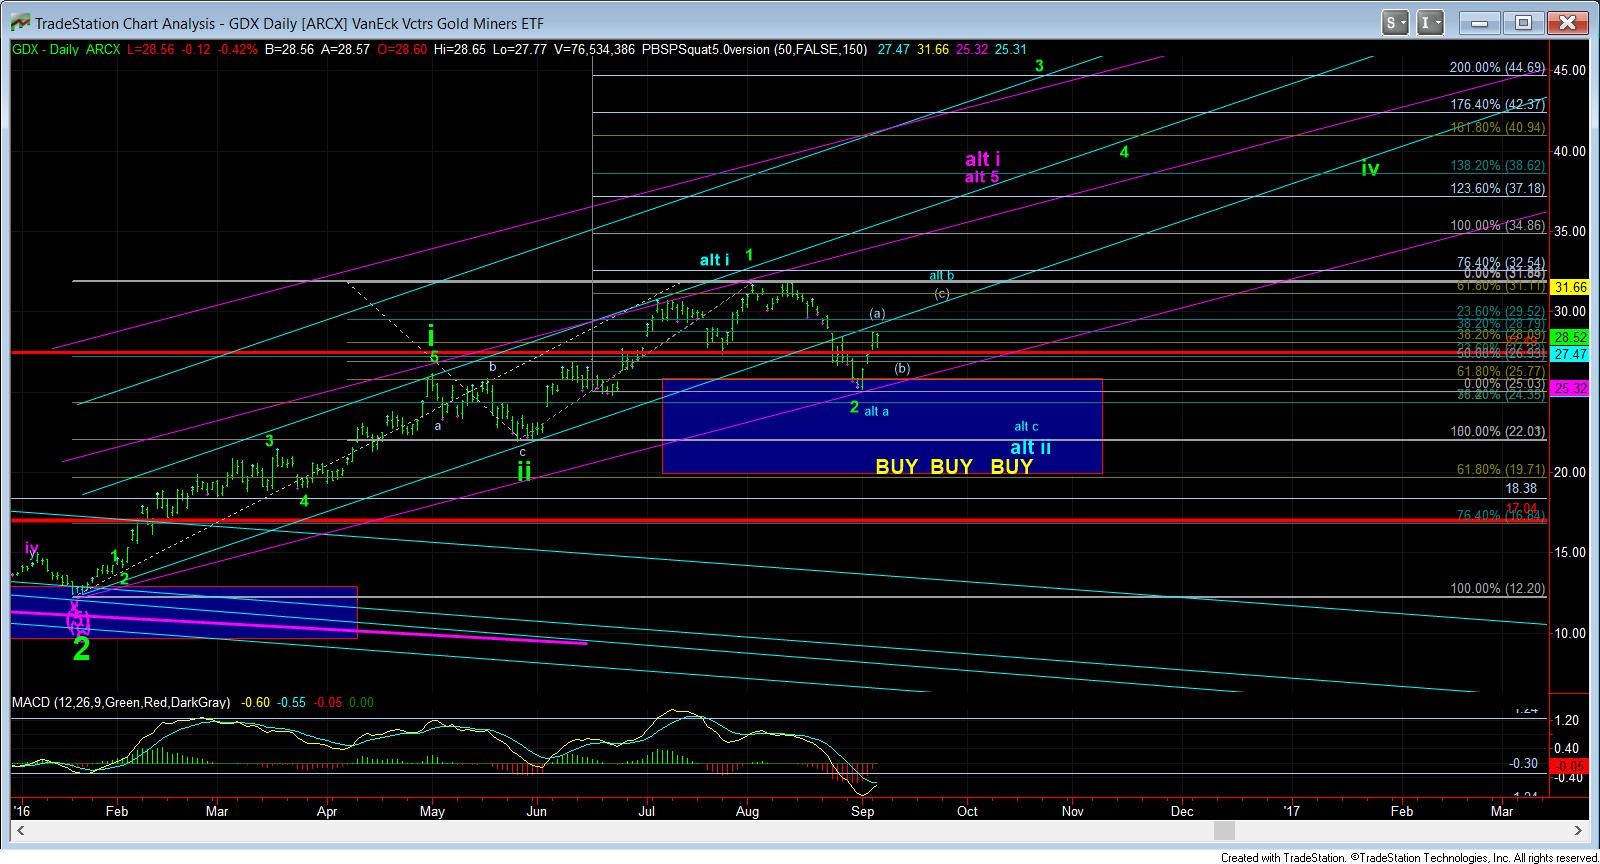
In the alternative, I have labeled the GDX daily chart with my expectations should we see the blue count play out. Again, the GLD and silver charts really are not supportive of the blue count on the GDX, but if we break any real Fibonacci Pinball support as we move higher (starting with the 27.50 GDX region), I will have no choice but to move into this perspective as my primary, which suggests we see the 22-24.50 region next.
So, for now, we need to give the market a little room to develop a 5 wave structure off the low, whether it is in green or yellow, without freaking out every time we see a pullback. But, once we have a solid 5 wave structure in place for wave (i), and then we see a corrective wave (ii) pullback, followed by a break out over the high of wave (i), it will be time to move into a VERY strongly bullish mode. Until such time, I am going to remain cautiously optimistic, and will continue to look for the potential that the bullish count may be wrong. I don’t like surprises, so I am always questioning my underlying thesis and wave counts through the day with multiple overlapping calculations to give me more assurance we are analyzing the market in the correct way. And, if I see something that concerns me, I will assure you that you will be the first to know!