Bears Failed Last Week
 By
Ricky Wen
By
Ricky Wen
The Emini S&P 500 (ES) last week closed at 2480.25 as a top wick doji that retraced 38.2% of the March 23-27 week. Hence, the March 30-April 3 week played out as a textbook inside week of the March 23-27 week’s range. If you recall, we demonstrated in the ES trading room in real-time via many range high vs range low trading setups with the 100% win rate week. This means that we now have pre-defined levels for both sides and their goal lines for the month of April.
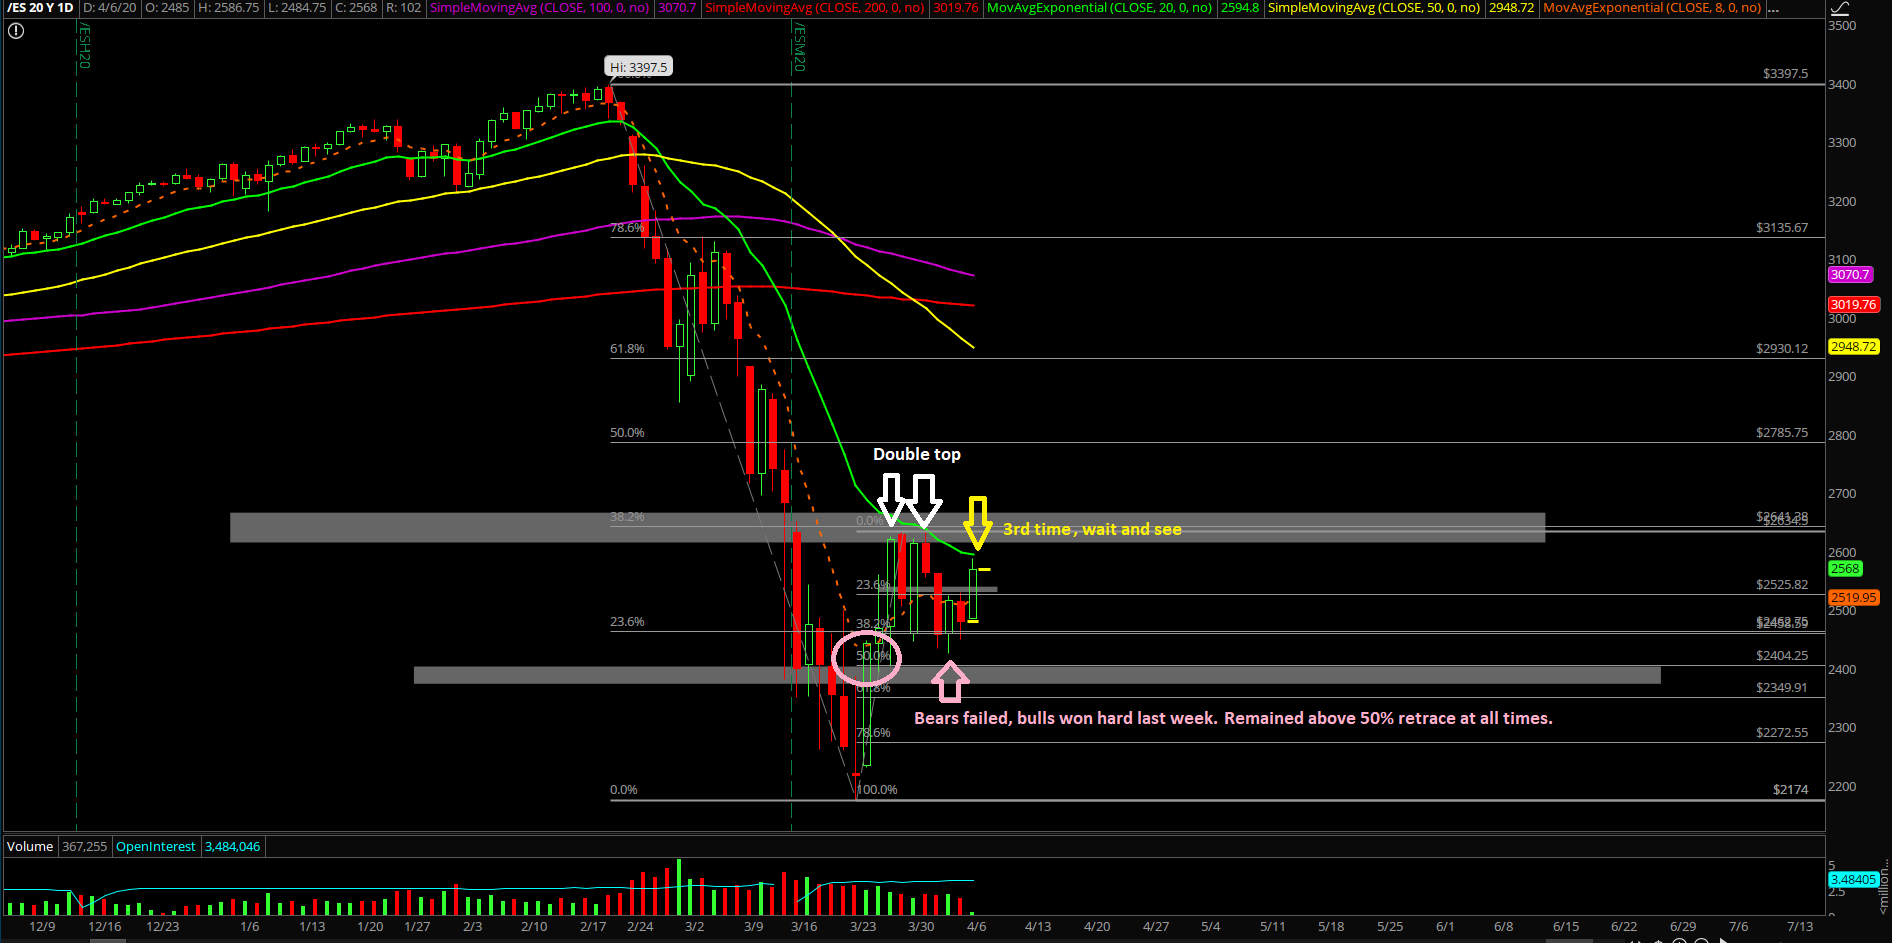
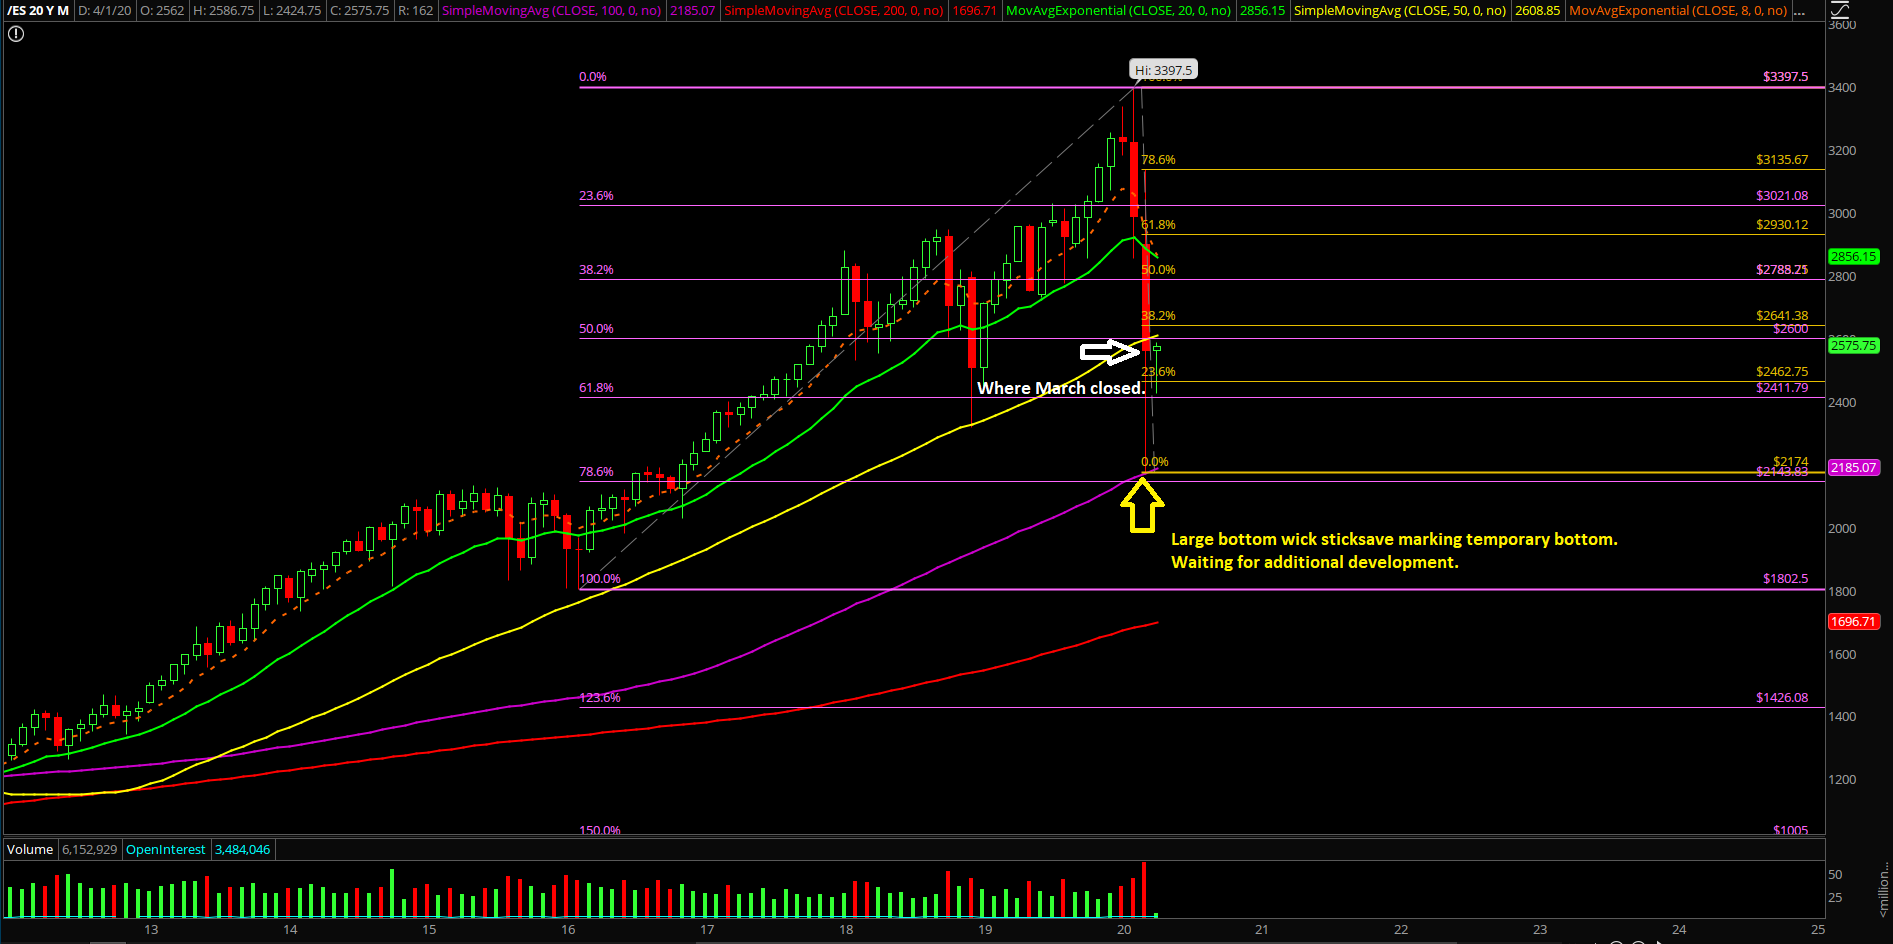
The main takeaway from last week was that the bears failed miserably even though they tried their hardest attempt. Price action pierced below 38.2% for a few minutes, but it bottomed at 2424.75 which was above the 50% fib retracement of 2404.25. This meant that the bulls stick-saved the crash-like setup back to our 2344/2220 potential target levels. We are now stuck as an inside week for the time being.
What’s next?
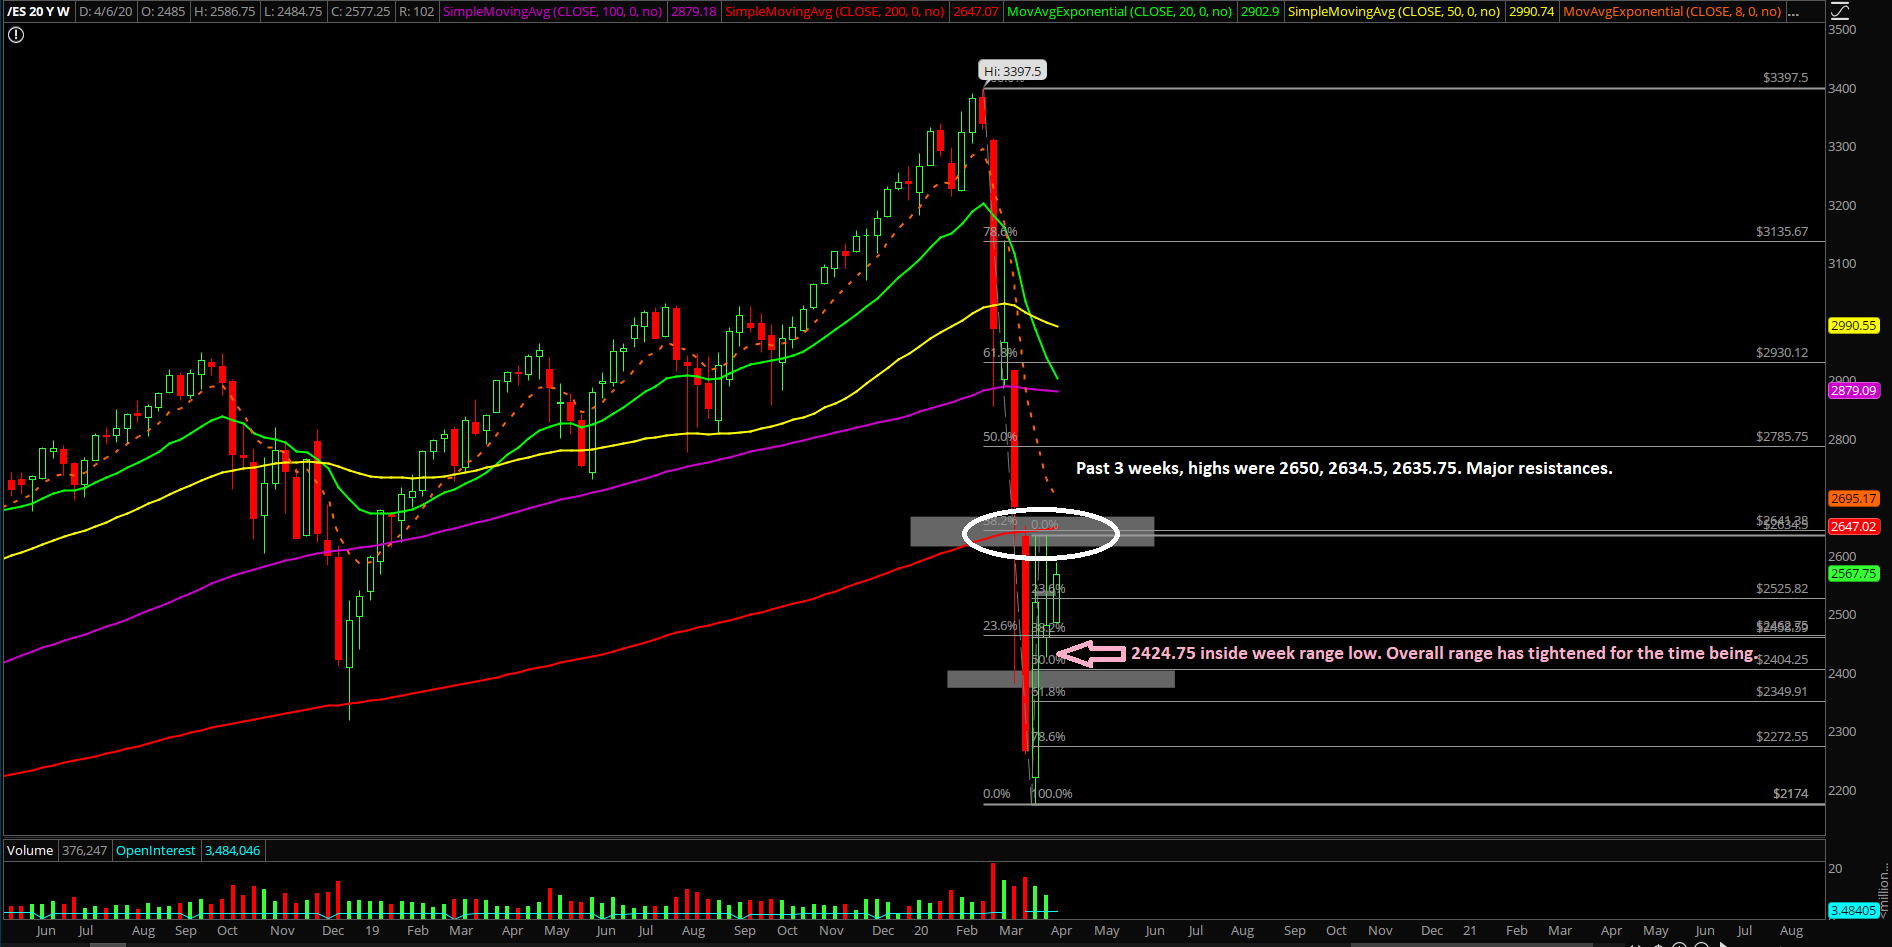
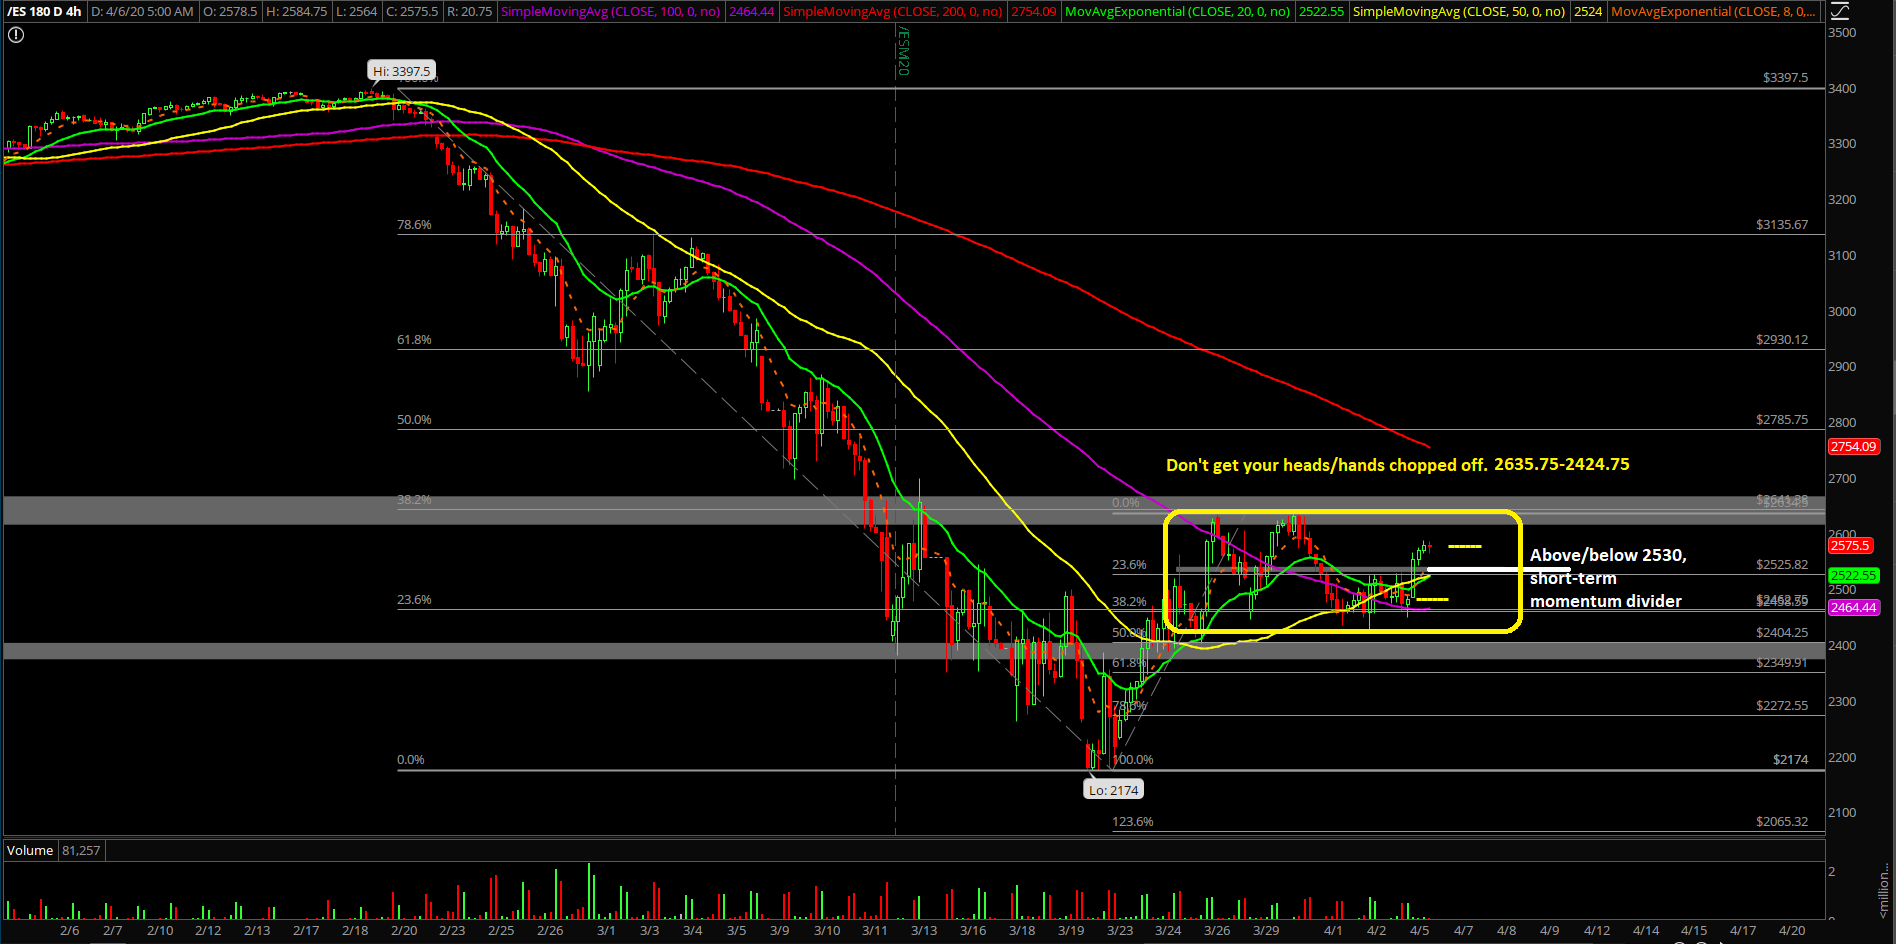
Daily closed at 2480.25 on ES as discussed, and now we have a range of 2424.75-2635.75 overall for the time being. We are neutral coming into today/this week. Waiting for edges to develop given the +3% gap up and go structure from Sunday night low. Try not to get chopped up in this environment, wait for edges.
Here's a summary of our game plan:
- 2530 is the momentum divider for today; favor bulls when above, favor bears when below
- Wait for edges to develop first as we’re neutral; price action continue as gap up and go or it evolves into gap up and crap? Utilize level by level approach
- Bigger levels such as 2635/2650 have remained major resistances for the past 3 weeks, the overall range may be tightened to 2635-2424.75 for the time being
- Last week played out as a textbook inside week for the majority of the time, it had a range of 2635.75-2424.75 trading within March 23 week’s range of 2174-2634.50.
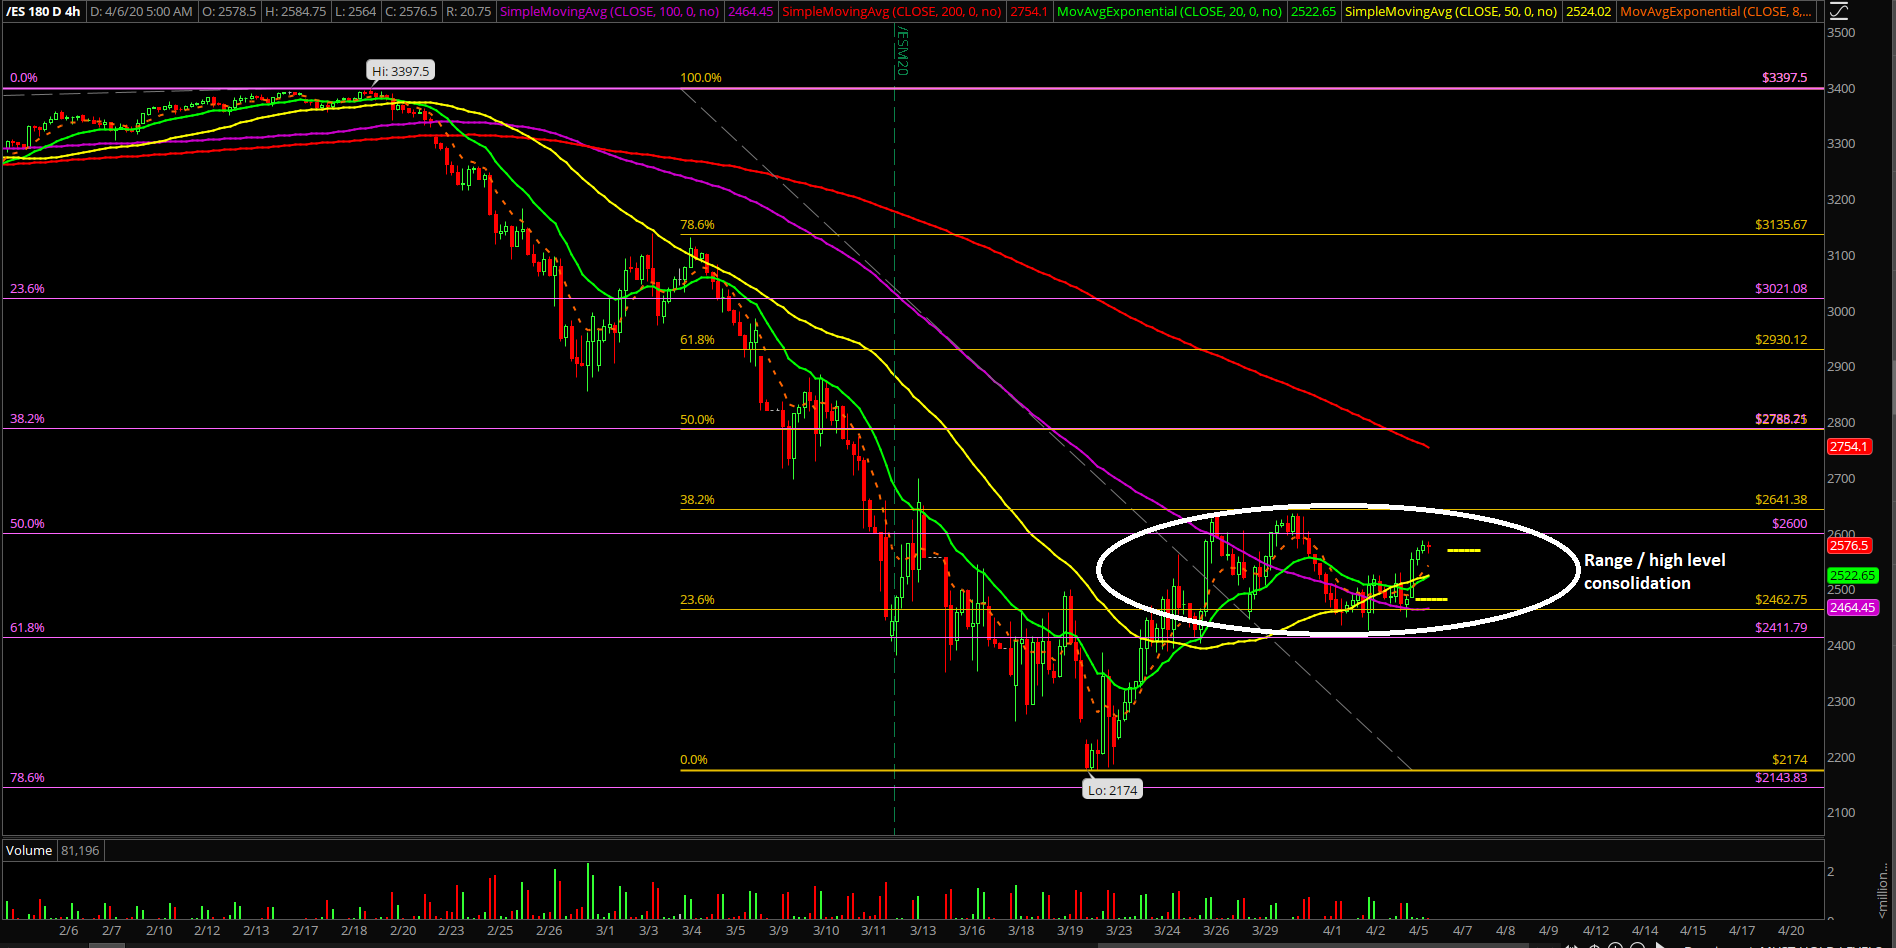
- Bears failed miserably last week, as the ES pierced the 38.2% retracement and bottomed above 50% retracement. Bulls won hard in the high-level consolidation war zone conflict as price action stayed elevated at the upper half of March 23-27’s range for the entire week.
- Zooming out, continue to watch daily closing prints 2316.75 vs 2650 battleground given the current situation of the market backtest against the Dec 2018 lows (March 20+23 closed below 2316.75, then from March 24-April 3rd closed back above 2316.75…confirming the temporary bottom setup in development. See if we get a complex W pattern on daily chart)
- Dec 2018 lows to Feb 2020 highs range: 61.8% fib = 2729, 78.6% = 2548, 100% = 2316.75
- Feb 2016 lows to Feb 2020 highs range: 50% fib = 2600, 61.8% = 2411, 78.6% fib = 2143, 100% = 1802.50
- There’s some real panic in the global markets and it is greatly appreciated because we’ve been lacking that extra juice in the first week of March as it was relatively easy or a bit too calm like we demonstrated in real-time.
- We’ve been fully prepared with lots of cash on hand to re-deploy into long term investment accounts in case the shit hits the fan and It looks like we may get our wish for fire sales across the globe.
- If you are in the same age bracket as us in like 20s, then, you have the next 30-50 years for dollar cost average for these plan B long term investment accounts, when the shit hits the fan you get a better long term average that will be worth millions.
- We are down to about 67.5% cash leftover and looking to deploy more as market hits near our support levels, the bigger the drop…the better for our long term average cost as the market has been giving us a great discount since the breakage of the daily 20EMA trend that occurred in late February. Know your timeframes for these long term non-leveraged accounts!