Bearish Scenario Has Been Invalidated For Now
With today’s move higher in the metals, we have now moved through the initial resistance points which, if held, could have pointed us down for that lower low. This has now invalidated an immediate bearish scenario.
However, once the bearish scenario has invalidated, it does not yet mean that an immediate bullish one has appeared. Rather, for that to occur, we still need to complete a 5-wave structure off a low. And, we are not there quite yet.
So, let’s look at the individual charts.
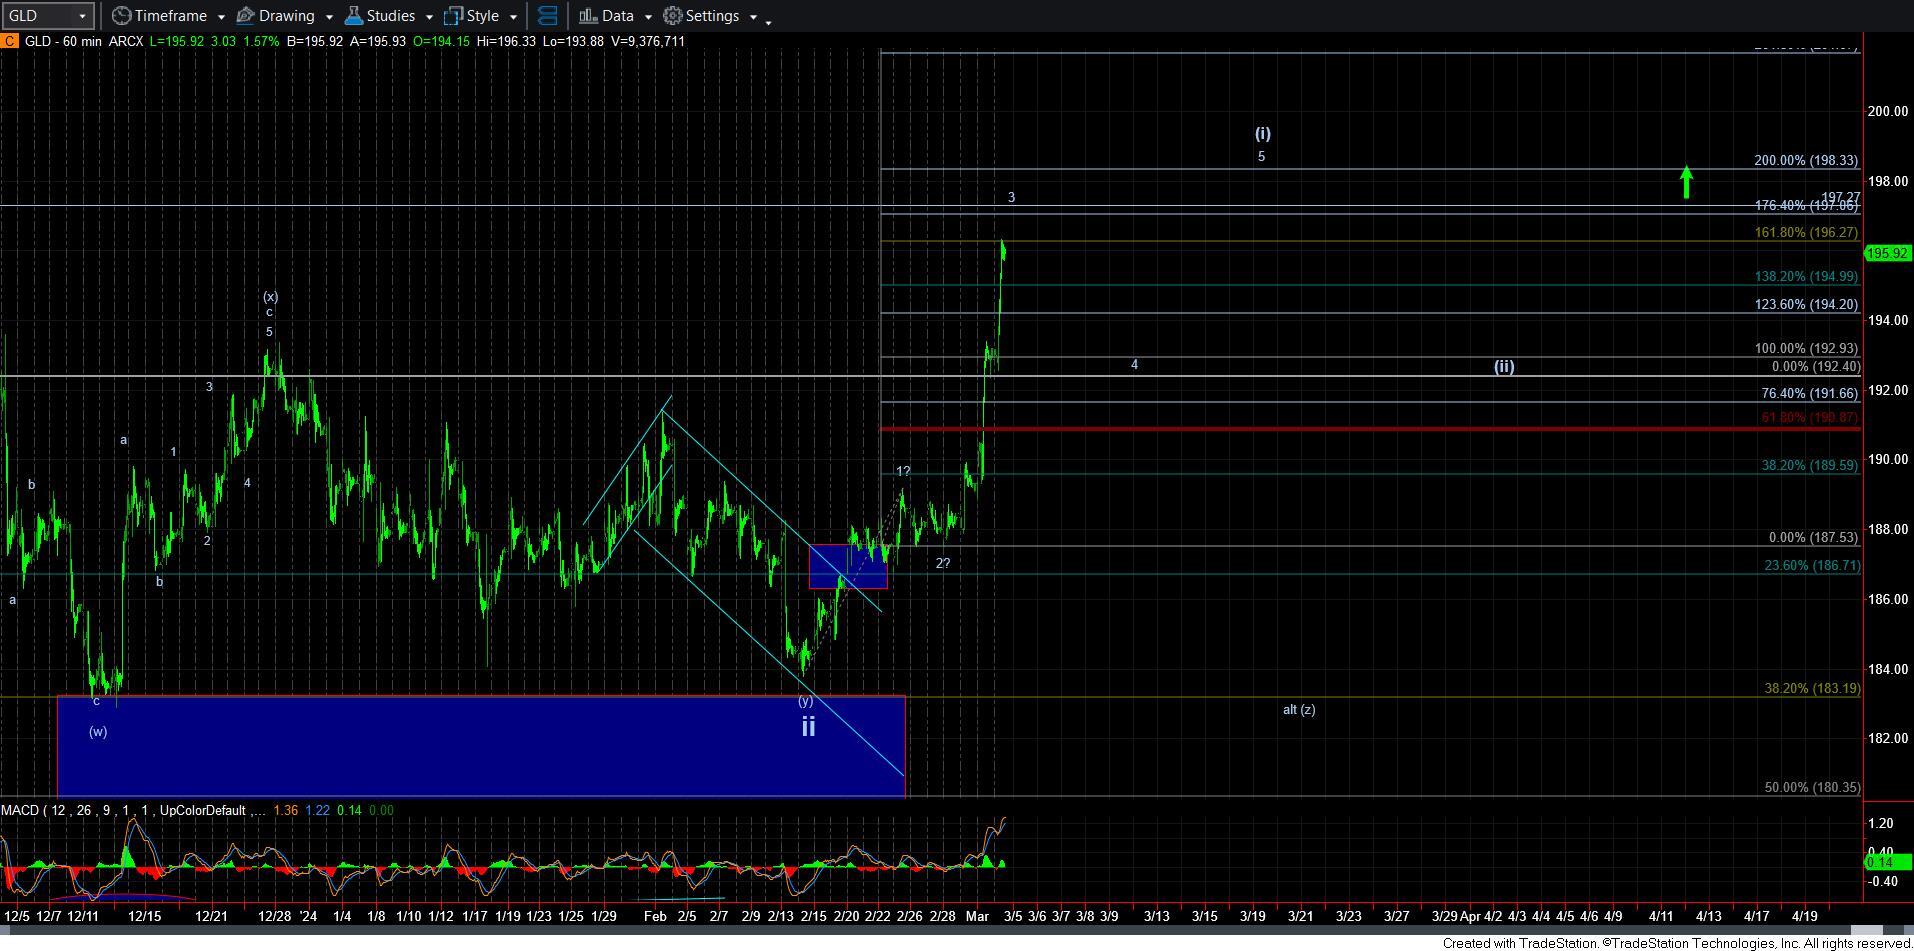
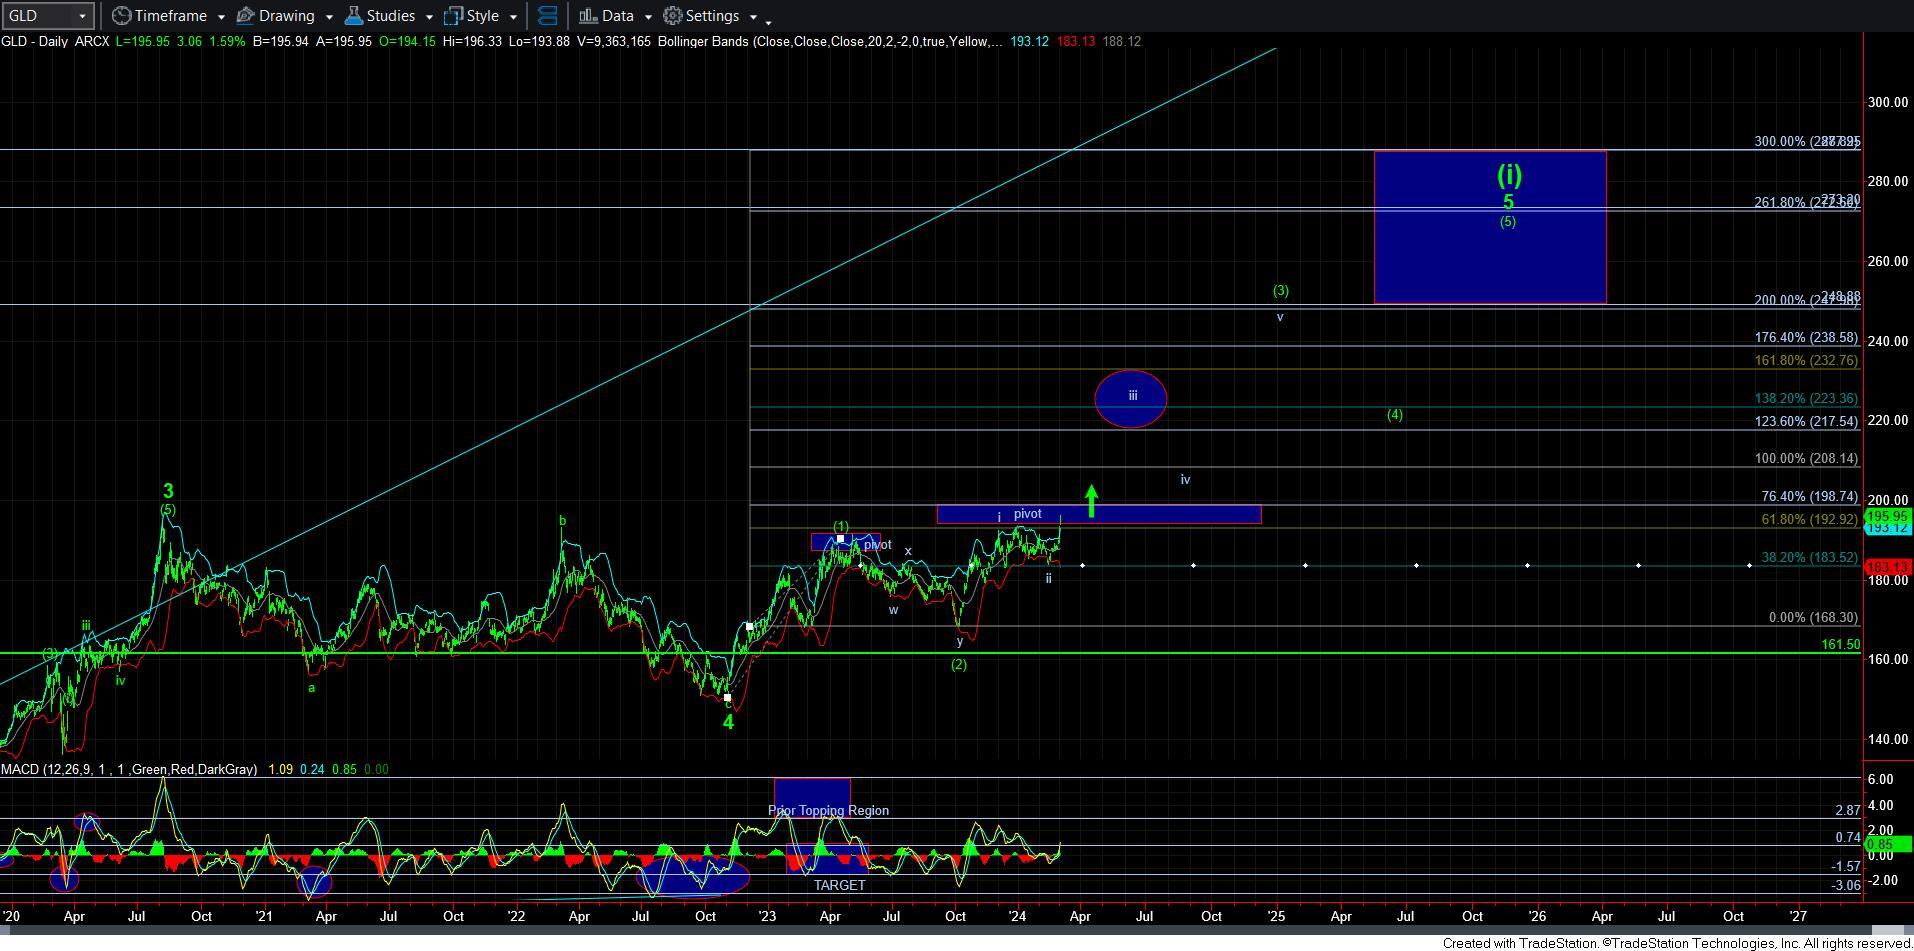
As you know, I have been pounding the table on the GLD chart, continually reiterating how bullish that chart presents. And, as it stands today, it does seem as though the market is attempting to complete wave [i] of wave iii of [3]. And, as you can see on the 60-minute chart, we are now completing wave 3 of wave [i], and need waves 4-5 to take shape in the coming days. Thereafter, we still need a wave [ii] pullback, which I would assume would re-test the break out point from above (the 192/193 region), and we will then be primed for the melt-up phase in GLD.
Also, take note that I am generally assuming that wave [i] is targeting the general region at which the futures topped in their overnight spike up a few months ago.
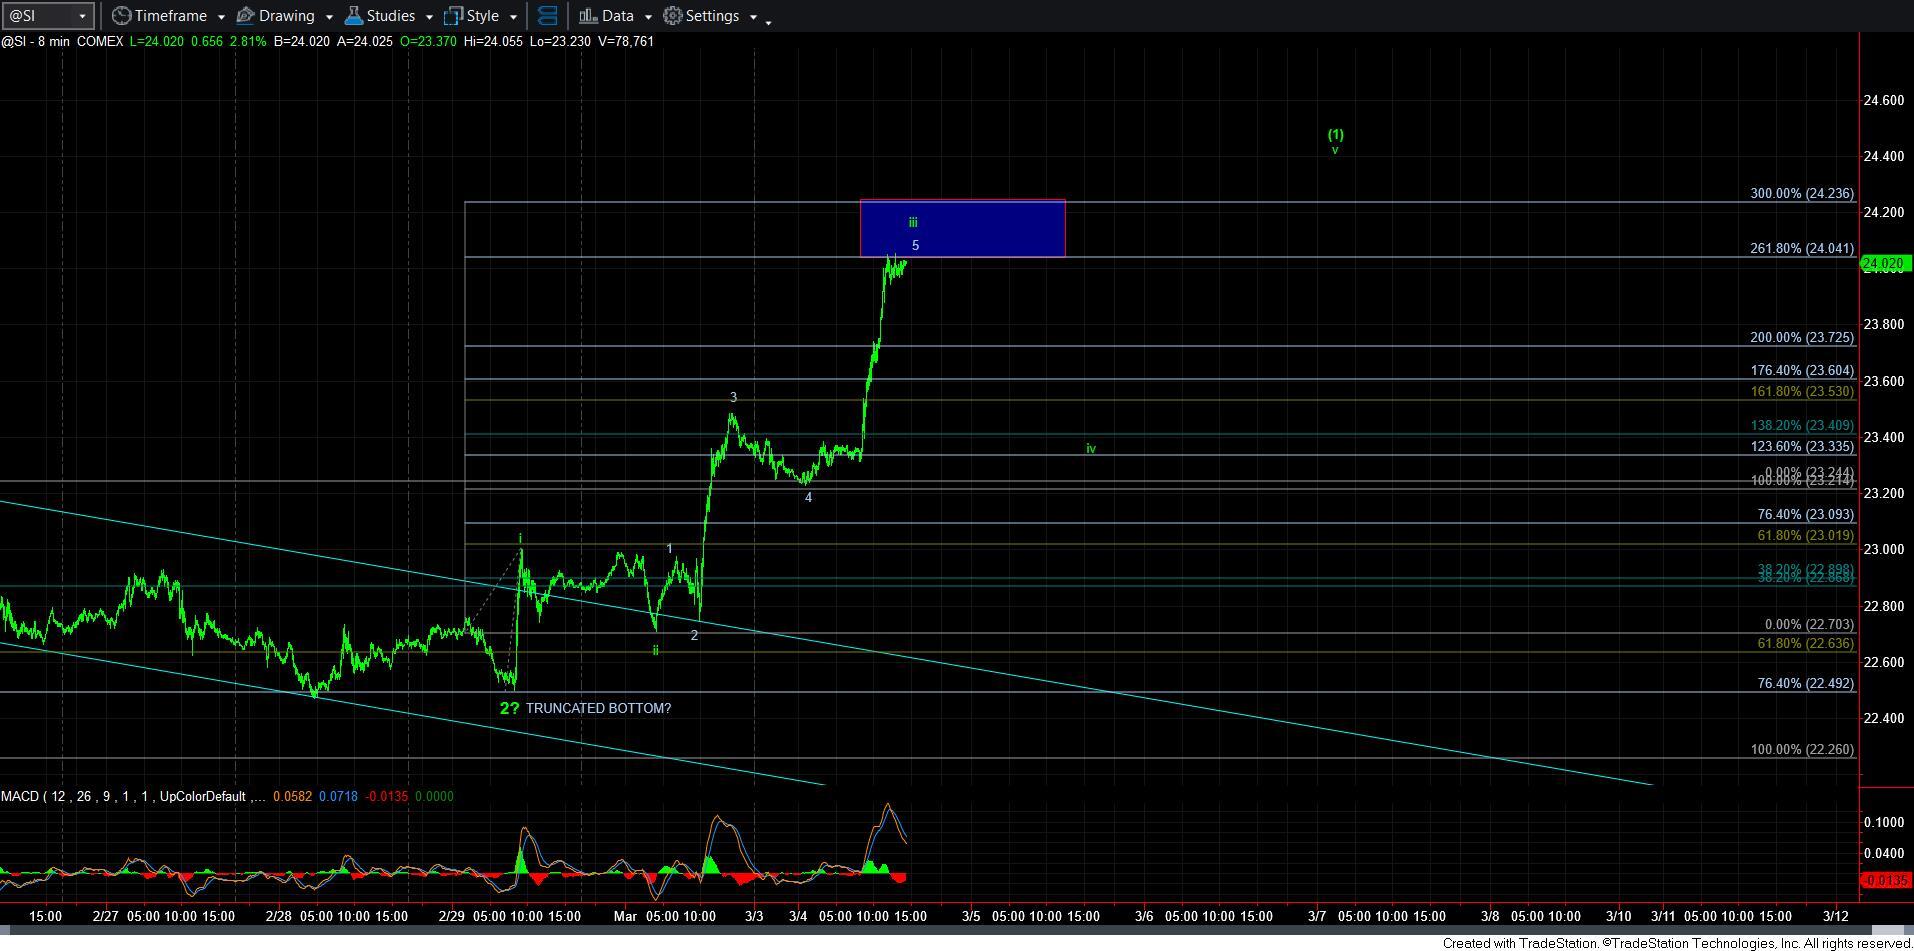
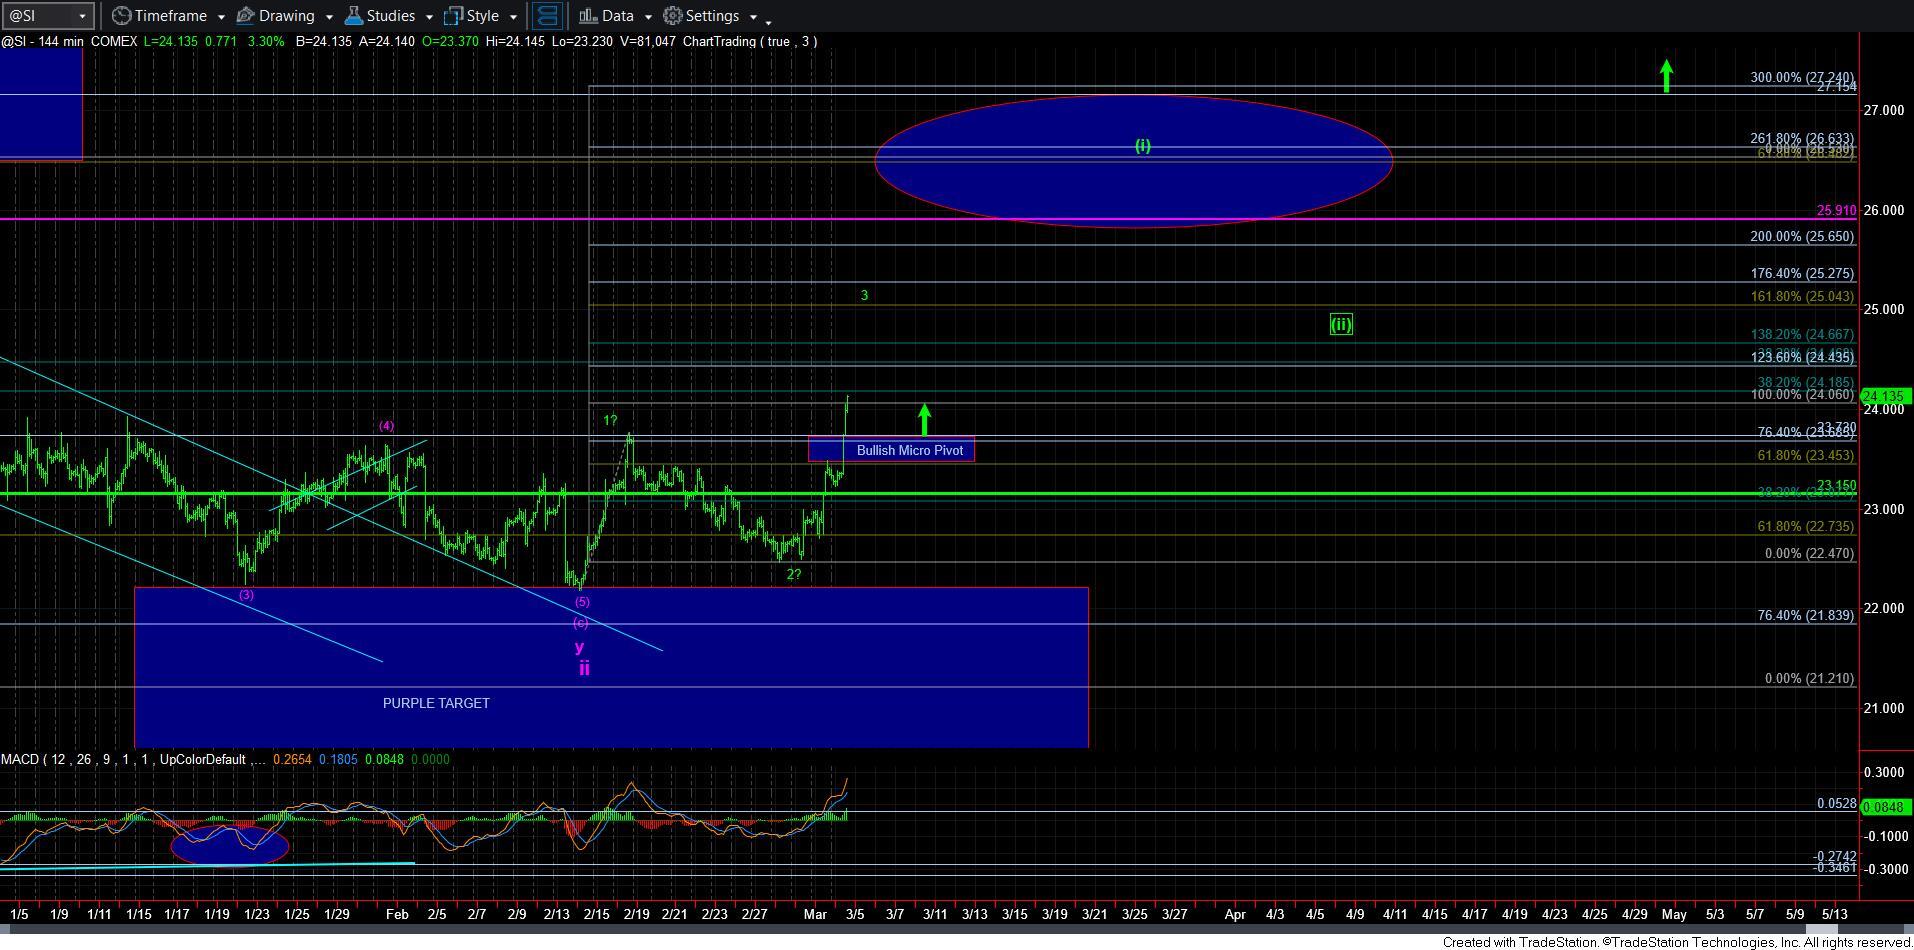
Moving onto silver and GDX, we have two paths I am considering. The simple path is the one that follows GLD. And, that is we are topping in the 3rd wave off the recent lows. When looking at the attached 8-minute chart in silver, I want to note that as long as we respect that box in which we now find ourselves, this is a reasonable count to apply. However, if the market should blow through this resistance, then I will have to assume we had a series of 1’s and 2’s off the low, and we are already in the heart of a 3rd wave extension in the larger degree wave [i] outlined on the 144-minute chart. So, at this time, I would not want to get in the way of silver.
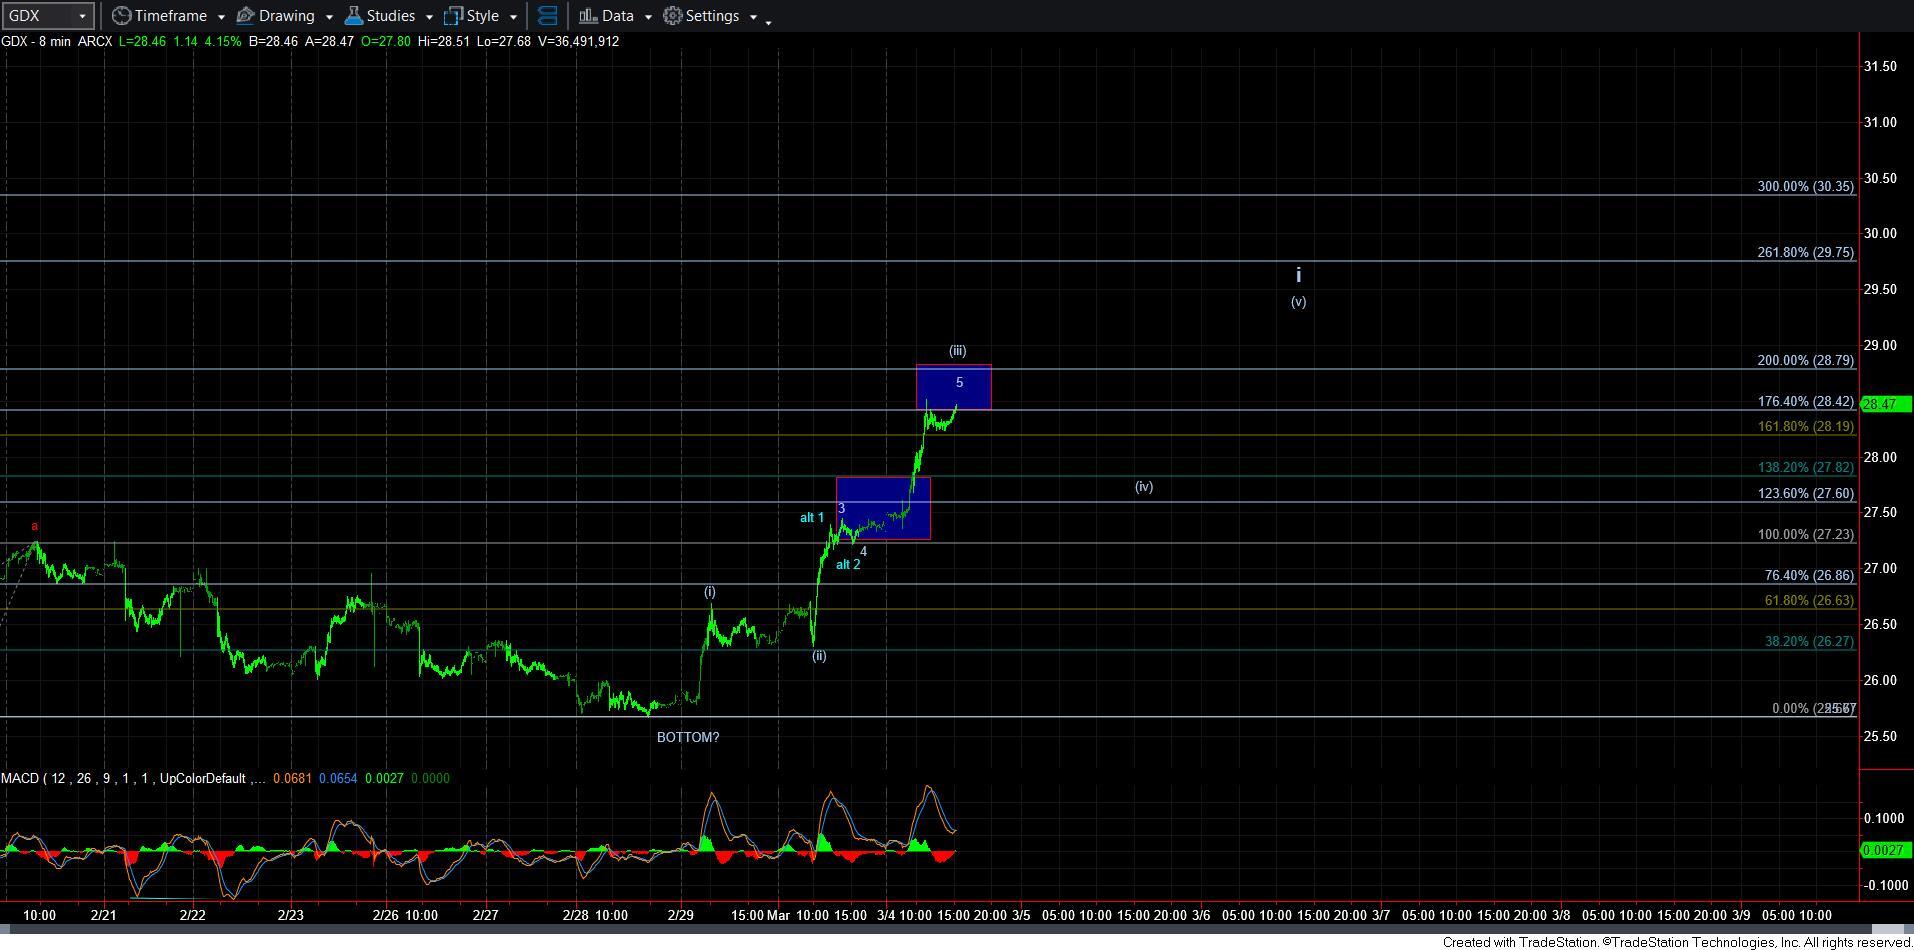
GDX is presenting similar to silver, with the same potential. For now, I am counting it similar to GLD. However, if we blow through the box on the 8-minute chart, then I have to assume we are in a strong extension within wave [iii] of i in GDX, which is potentially going to extend us towards the 31 region. And, that is represented by a series of 1’s and 2’s, with the send 1-2 being the alt-1, alt-2 in blue noted on the 8-minute chart.
So, in summary, it does look like the metals have finally completed the last corrective structure, and may have one more smaller degree corrective structure to be seen in the coming weeks before we are finally in the melt-up phase we expect for 2024.