Bath & Body Works: Ba…Ba…Ba…Bearish On This Chart
 By
Levi
By
Levi
By Levi at Elliott Wave Trader; Produced with Avi Gilburt
Yes, we’re having a little fun with the title, but please allow us to elucidate further and show you what leads us to this conclusion. What’s more, we are also able to share when this bearish setup might need refinement or where it may even invalidate.
First, we’ll give a bit of background on how we arrive at the projection you will see on the charts attached below. Then we’ll get into the specifics of what we anticipate going forward for BBWI stock. And finally we’ll briefly discuss the ‘why’ of this type of setup.
Our Background for The Bearish Setup On BBWI
Let’s revisit a moment in recent history. We all easily recall the Covid Crash panic of 2020. Everything possible was thrown overboard as in most people’s minds the world was ending. All things investing were plummeting. For the crowds, nothing was investable. In that flash down BBWI struck into the $6 region, believe it or not.
Now, fast forward 18 months and BBWI had rocketed to $82. Valuations along with sentiment became super stretched in this one. Price proceeded to $25 over the next 8 months. That’s where we join the story on the chart shown below.
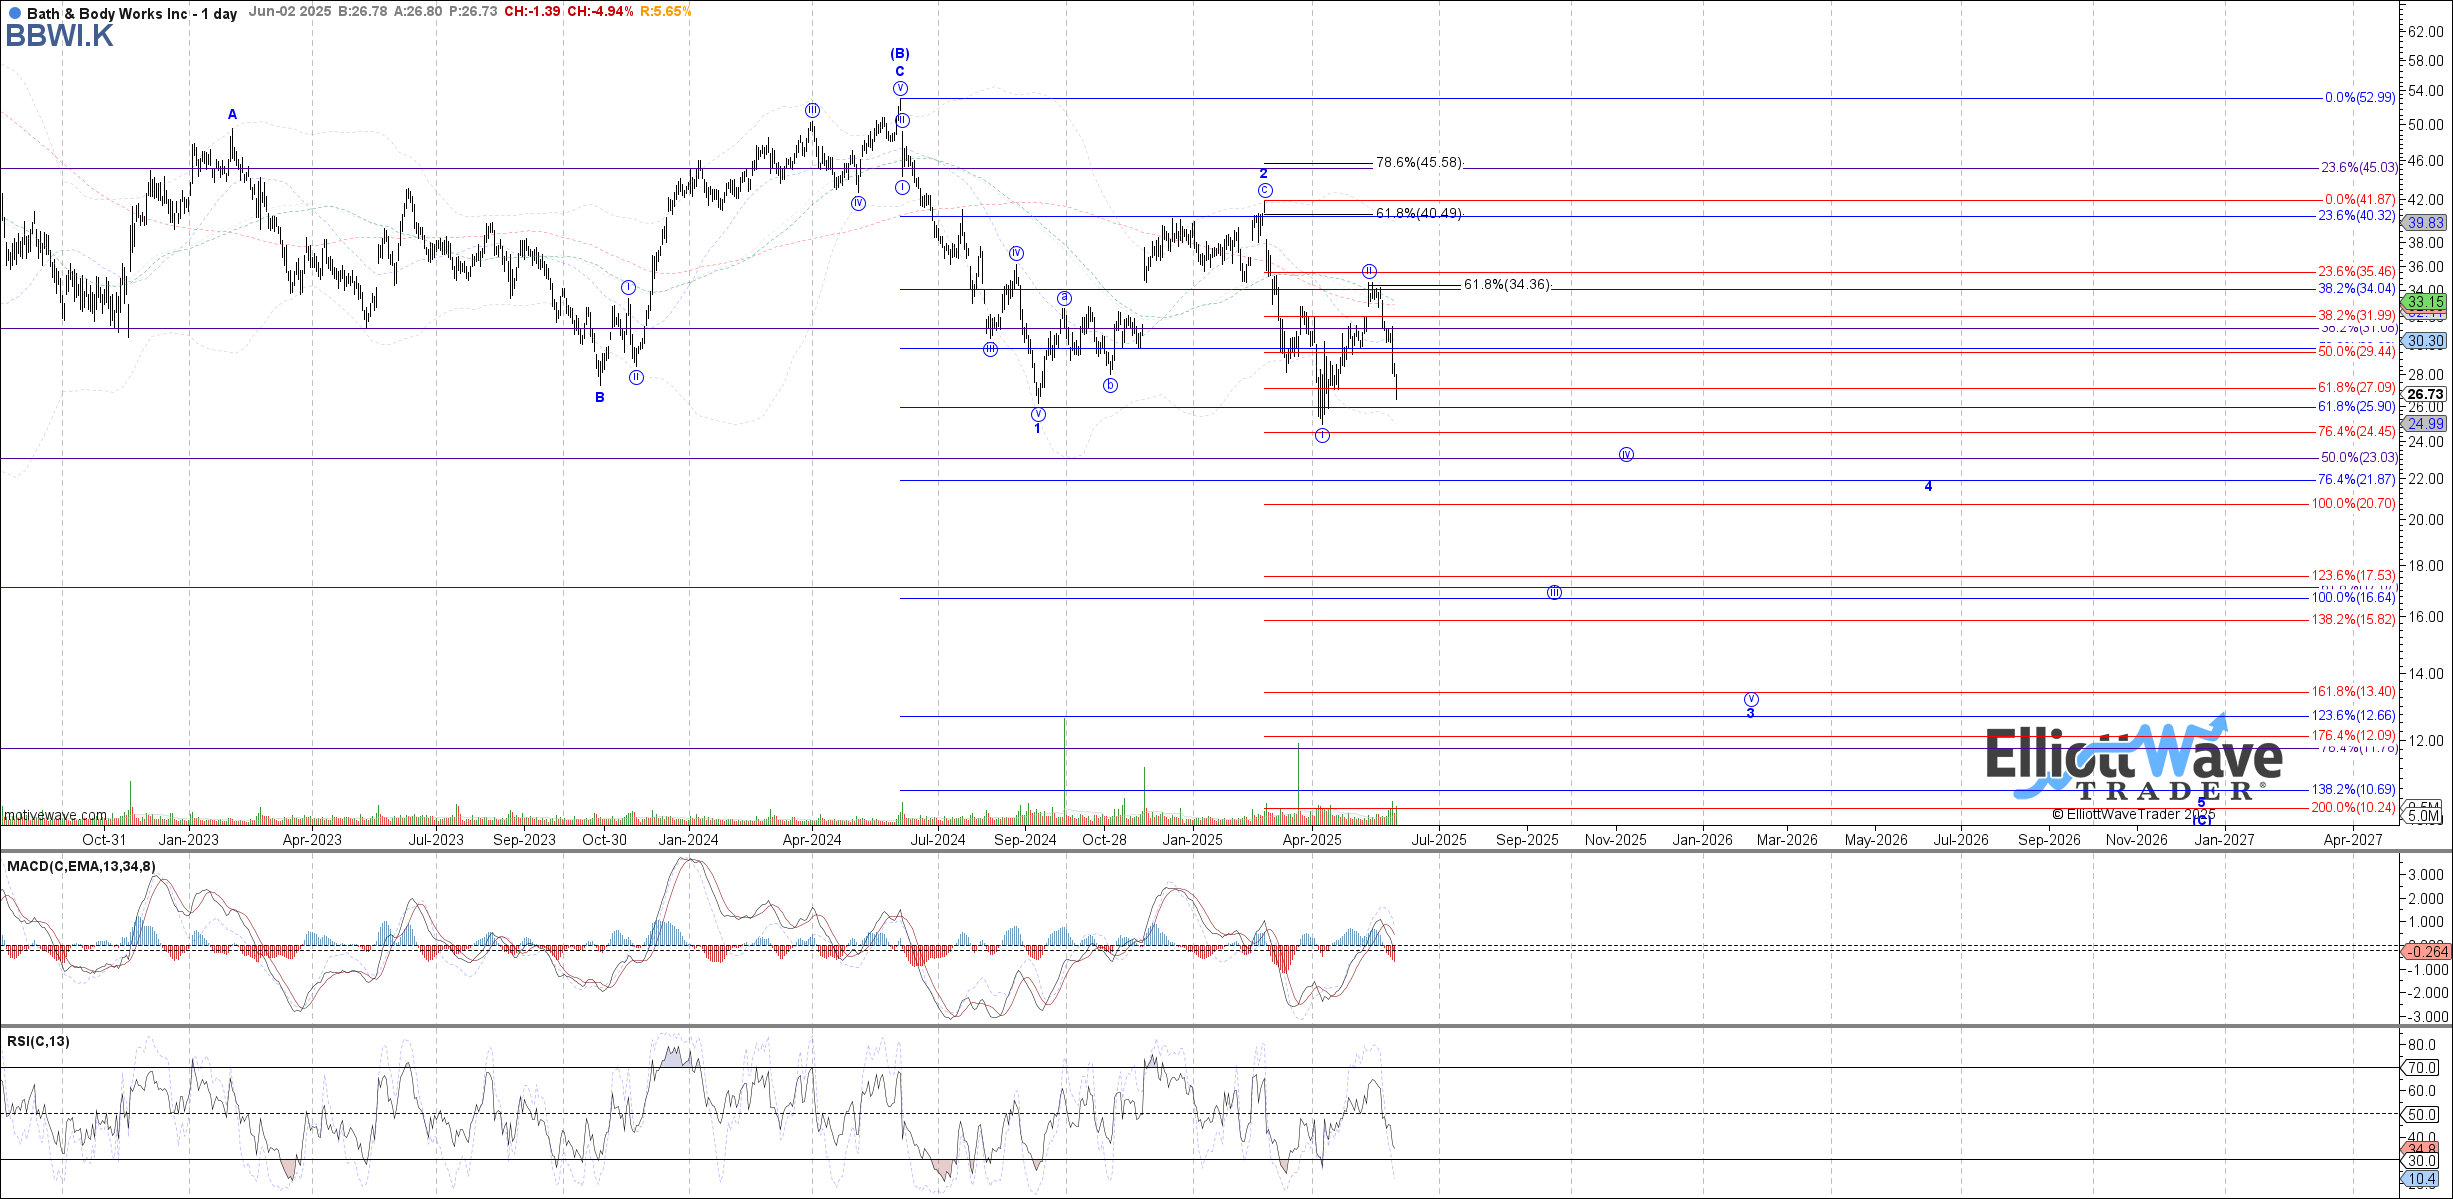
Here is where the greater picture context can assist us immensely. Note what then took shape over the next two years - a perfect 3 wave corrective structure that completed what you see as the (B) wave.
From there we can count 5 waves down for wave 1 of (C) followed by another 3 wave corrective move in wave 2 of (C). This is an ideal bearish scenario with clear parameters to guide downside targets as well as where this would nullify.
What Exactly Is This Methodology?
Over the years, we've had many questions about how we arrive at these targets, along with support and resistance levels. Some are less than genuine in their intentions, but quite a few honestly want to know how we are consistently able to find these high-probability setups.
If you would truly like to learn about this methodology, Avi Gilburt is an active educator. He regularly provides a detailed dive into the how and why of Elliott Wave analysis. Here is a brief excerpt from an recent article:
“For those of you that have not read my analysis before, you are probably thinking that I will change my bullish perspective if rates rally a bit more, or if inflation numbers come in a bit higher, or if the war in the Middle East expands, or for many other reasons most view as being important to the market.
But, those that have read my analysis for some time know that none of that really matters to the market in the bigger picture. And, I have provided a multitude of real-world examples, as well as many recent studies supporting my perspective in many prior articles. So, I am not going to go into that again in this missive. Rather, I am going to try to take some time in this article to explain how I view the current structure from an Elliott Wave perspective.
Moreover, this article will go into a lot of basic instructions regarding Elliott Wave patterns. So, you may want to stop reading if you really do not want to learn something about Elliott Wave analysis.” - Avi Gilburt
It is this type of straight-talk that helps many new to this type of analysis realize that there is an entirely novel way of viewing the markets. Specifically in the case of BBWI, we can use Elliott Wave to set the stage via the most probable path ahead.
This methodology, when properly applied, will assist the user to turn down the noise of the news and focus on what is most powerful - crowd behavior. If you would like to learn more, note some direction at the conclusion of this article.
Let’s Apply This To The BBWI Chart
Zac Mannes has picked up the narrative via the structure of price on the chart. This very structure is telling us a story that we can follow going forward. It is the larger context that is telling us to view the chart in a bearish light for now. Here’s why.
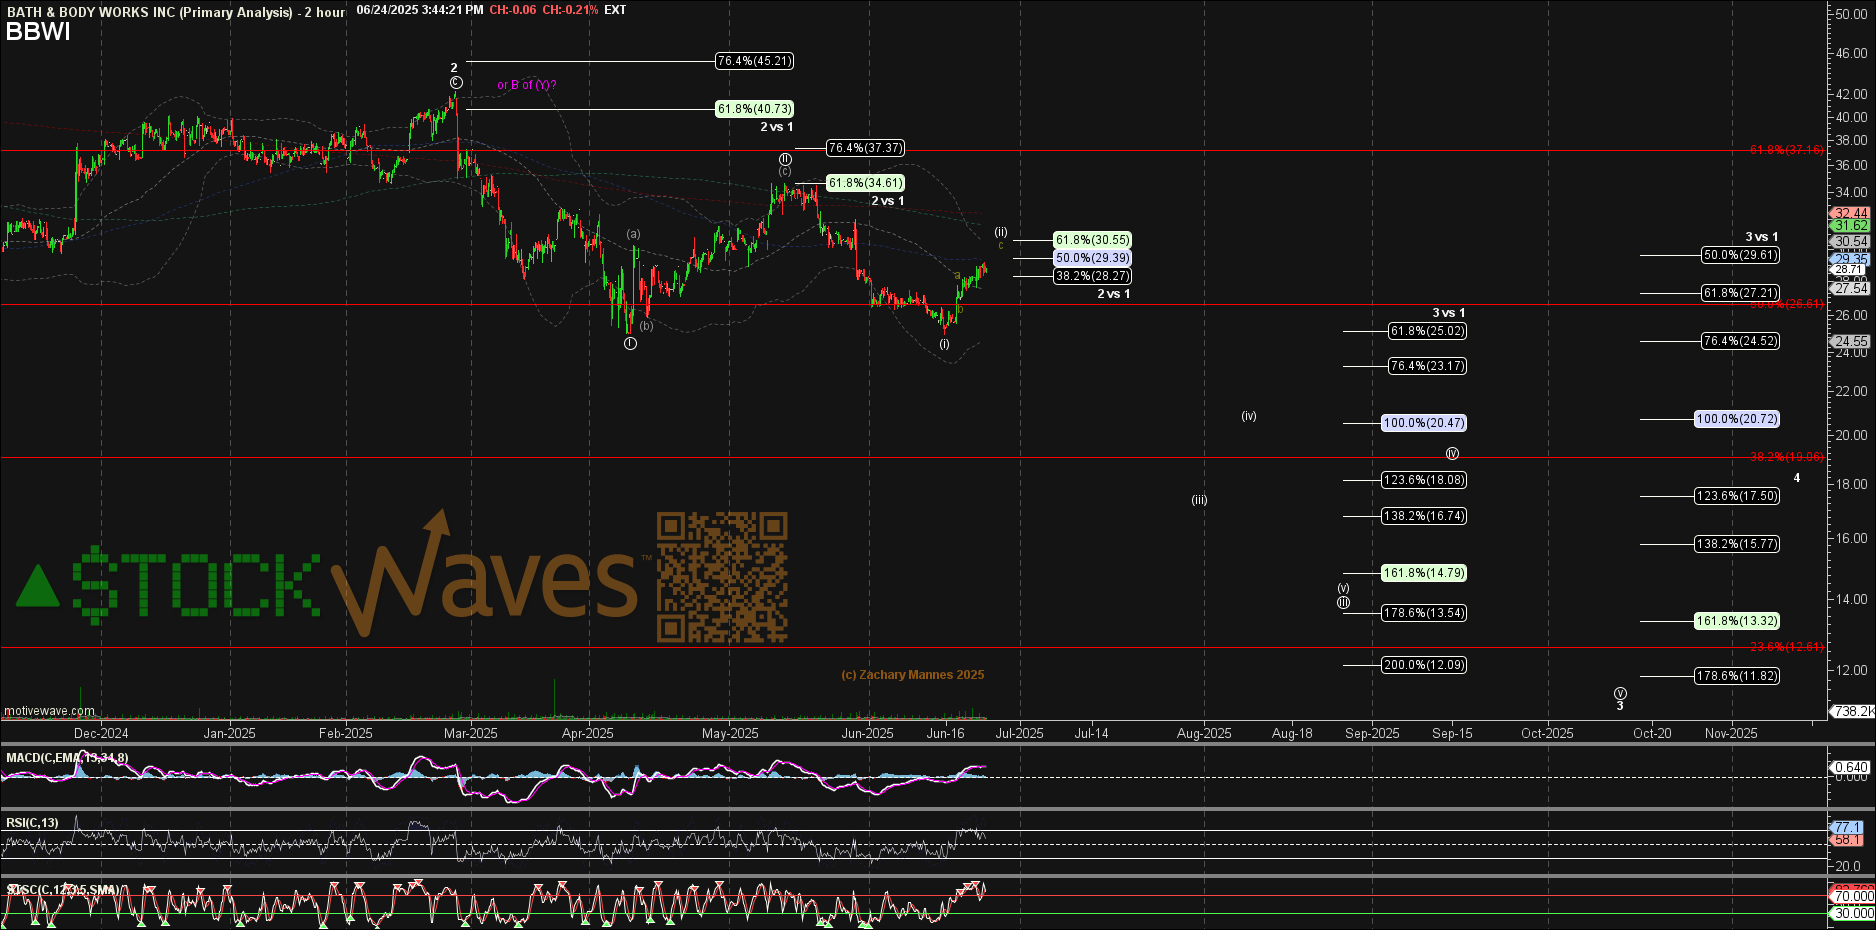
Note that we have the (B) wave top as shown on Garrett’s chart above. Thereafter we can see a clear wave 1 down and the corrective wave 2 in the oversold bounce. The next lesser degree wave ‘i’ and wave ‘ii’ are also in place. This means that the next move down is likely to be the heart of a third wave. This move should be the strongest in amplitude.
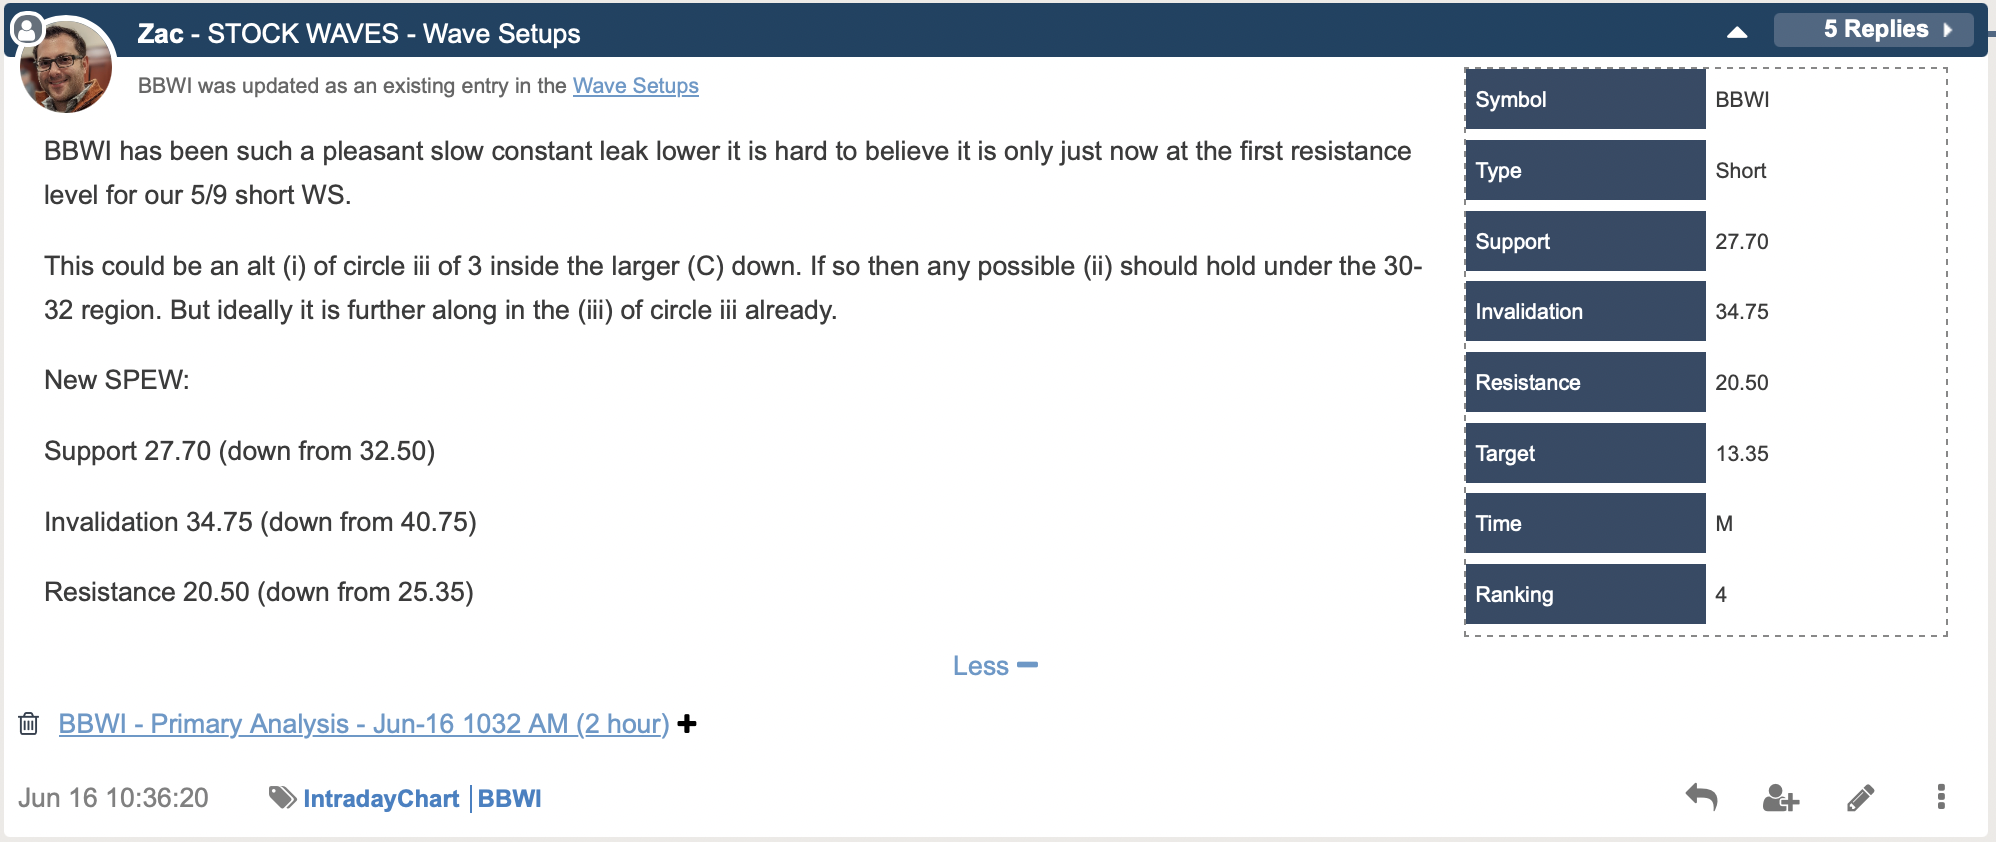
We are monitoring this move as an ongoing Wave Setup. The original setup was shared with members May 9 right as price was reaching its last peak. Take note of the specific parameters shown in the table.
What Do Others Think Of This Analysis Method?
Many will argue with us regarding how we arrive at these targets and parameters. Some outright dismiss the methodology without even taking a minimum requisite time to understand. And, you know what? That’s OK.
Some simply will not allow themselves to see the markets through a probabilistic lens as we do. Granted, we will help others to learn our methodology, even those that begin begrudgingly. Many begin as skeptics.
In fact, there are literally thousands of readers and members that attest to the veracity and utility of this work. Be open to educating yourself with the materials openly available to all at ElliottWaveTrader in our Education section. Once your mind is stretched by this new way of viewing the markets you may just not be able to go back to where you once were.
There are many ways to analyze and track stocks and the market they form. Some are more consistent than others. For us, this method has proved the most reliable and keeps us on the right side of the trade much more often than not. Nothing is perfect in this world, but for those looking to open their eyes to a new universe of trading and investing, why not consider studying this further? It may just be one of the most illuminating projects you undertake.
