Awaiting New 2018 Lows in Crypto
 By
Ryan Wilday
By
Ryan Wilday
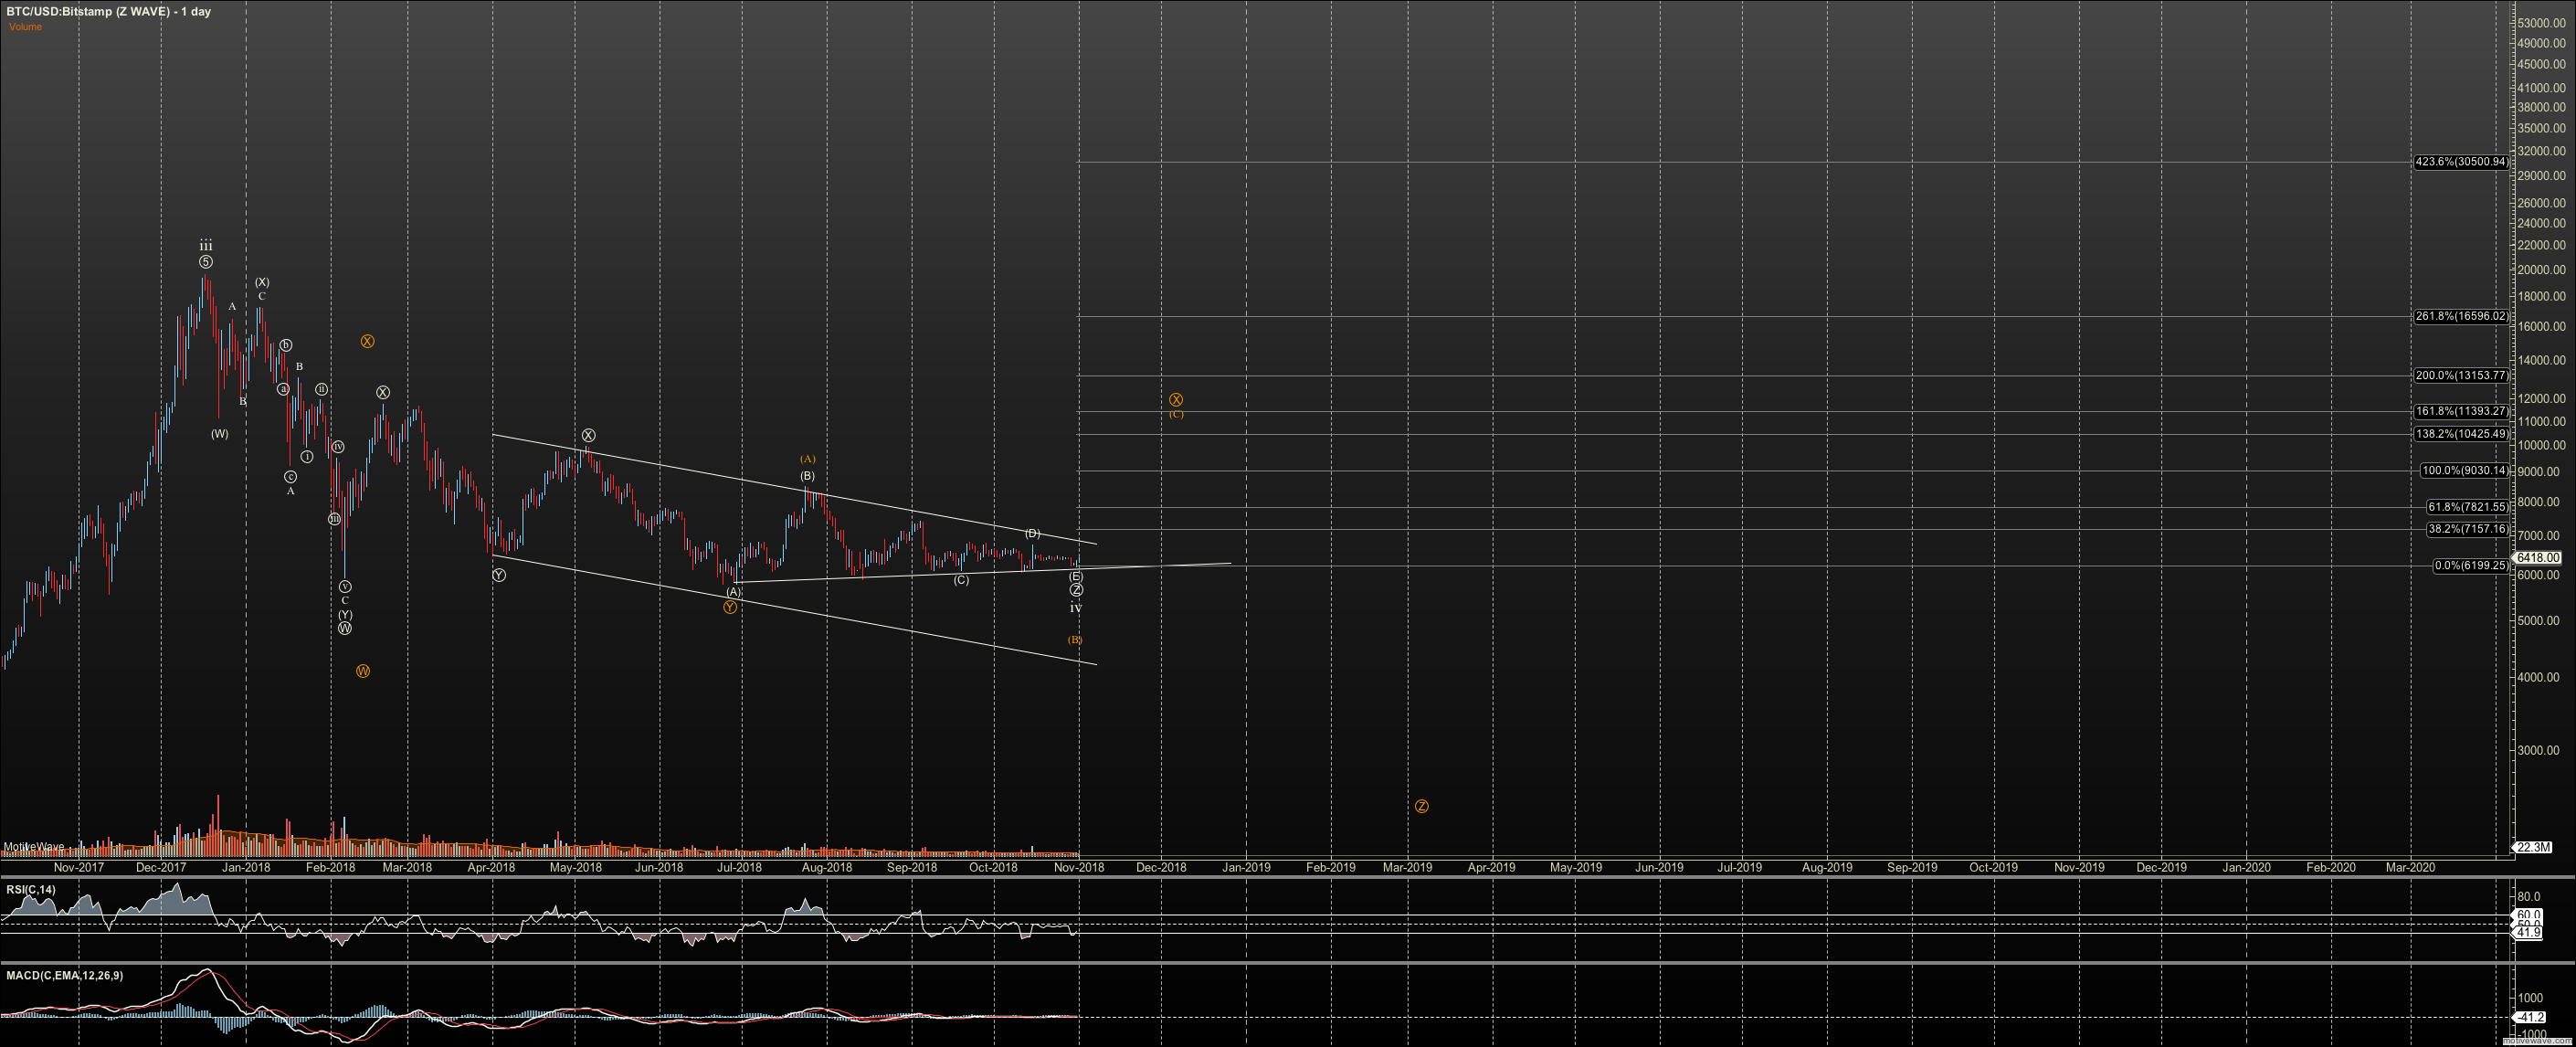
Take this just as preparedness. We are soon to be pushing against resistance areas at $203-05 in Ethereum and $6620 in Bitcoin. Note right now that if this is a c wave of the larger wave ii in Bitcoin, the cleanest projection I have is no farther than $6485. I'd like that to hold at least nominally. And, if we do break $6620 I have to consider the low in. This would be White count.
But as I warned, this sort of bottom can be "trusted" to bring a B (or X) wave as shown on the chart. The issue is this triangle can easily be interpreted as a B wave triangle off a WXY bottom. The Z wave triangle is from the hidden annals of Elliott Wave theory. Very rare. Because so many coins are close to long-term support, I have some doubts on this orange path, but you never know. In my own trading, I don't care personally. I'll grab that X for profit as best I can and then take the short trade.
But just beware of the risk of this bottom. I'll be looking for a strong impulse straight through 10,400 to challenge this idea. In the orange count, it appears it will top out around $10000-10,400, unless it retraces and forms a more complex X. If $10,400 holds it can tumble to $3,000 and perhaps below. It shows $2200 as possible, and that would greatly increase the duration of this bull market.
Again, my personal perspective looking across the ENTIRE market is that we see new 2018 lows, but I am happy to be wrong. I'm tired of shorting while chop to eek out a small profit.