As Support Holds, Odds Favor Ongoing Bull Trend
 By
Ricky Wen
By
Ricky Wen
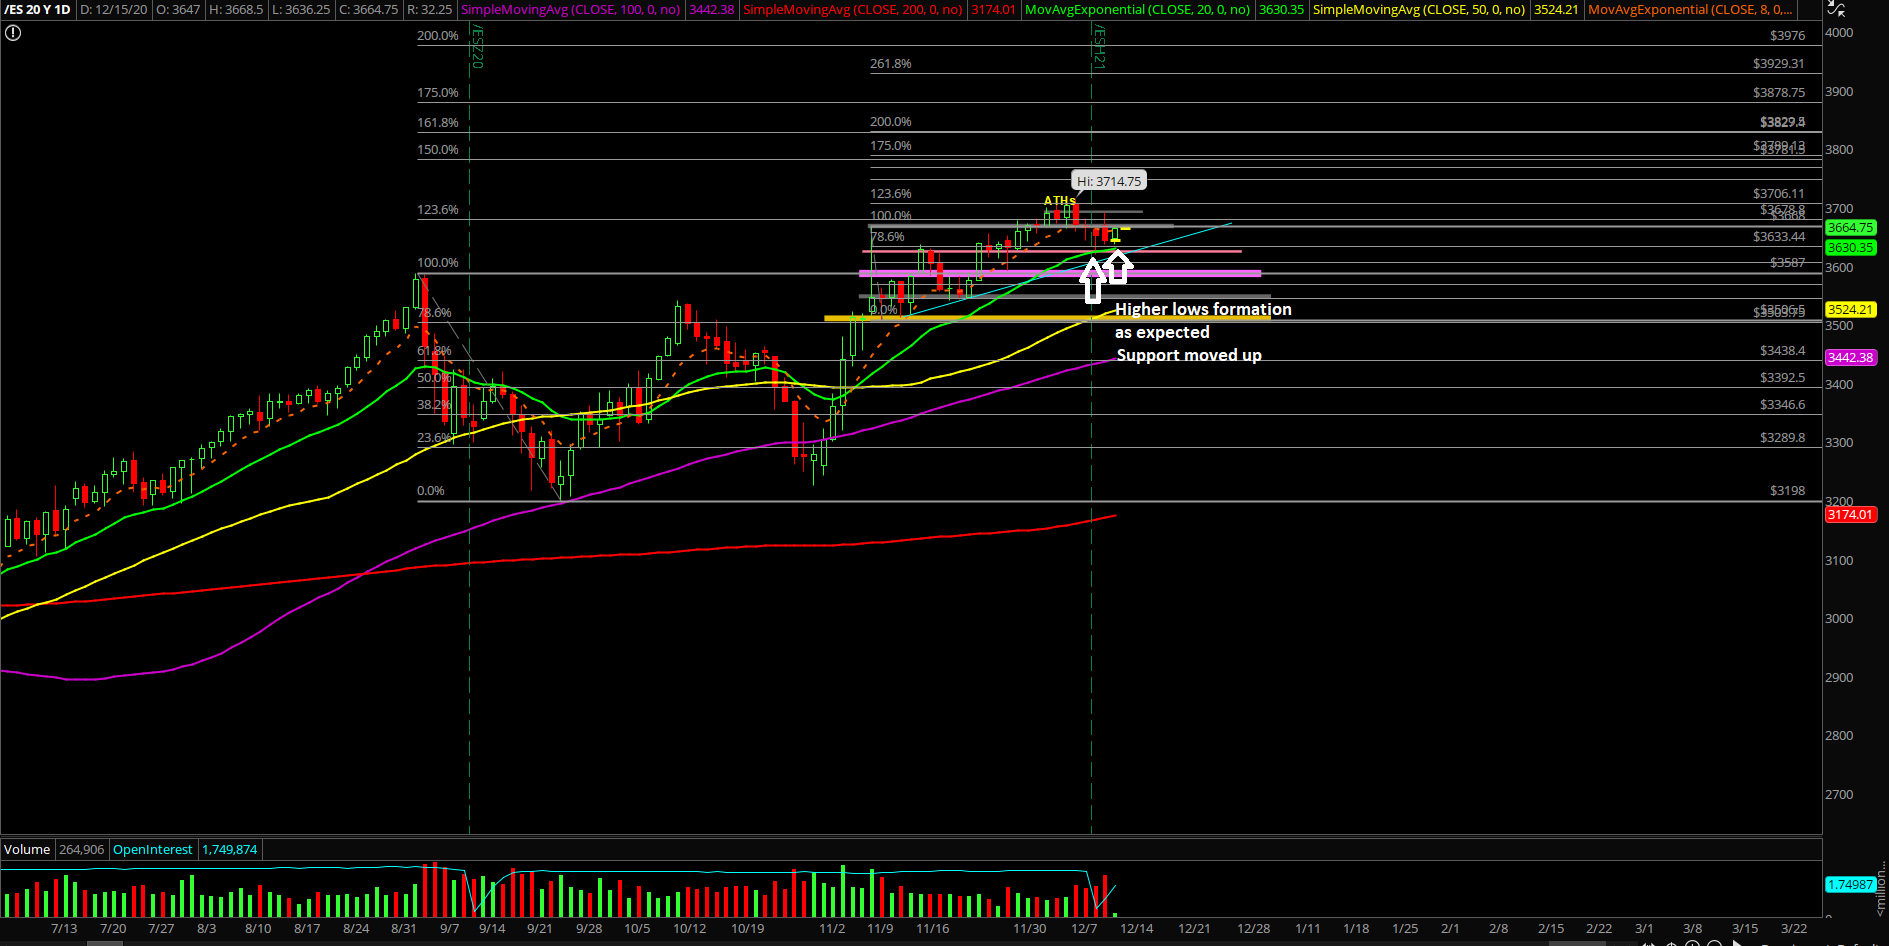
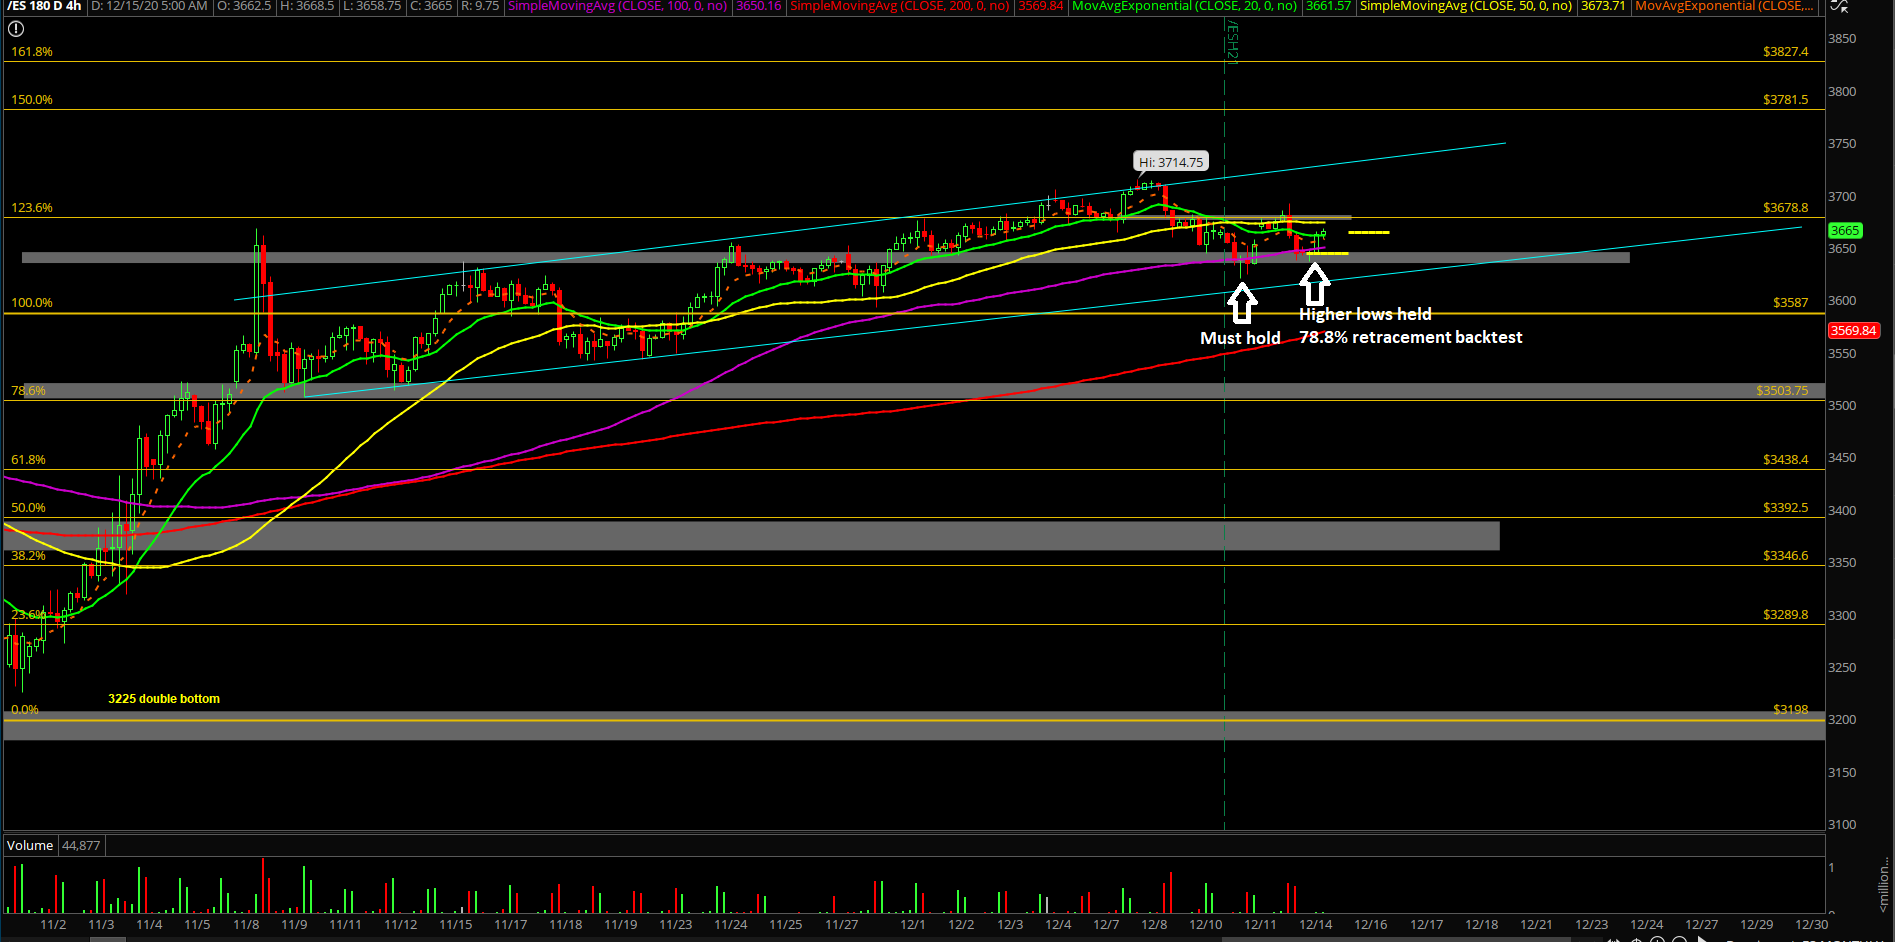
Monday’s session was all about locating the higher lows formation relative to last week’s approximate 3620 must-hold support. Price action backtested into the 78.6% Fibonacci retracement and made a quick +30 point bounce overnight. Ultimately, it's just a typical monthly OPEX rangebound pattern until either side breaks, and obviously favoring the ongoing bull trend.
The main takeaway is that this is a critical time for both sides. Price action made new all-time highs last week before current weakness/quick mean reversion into the daily 20EMA trending support. Both sides’ goals are crystal clear as the market heads closer and closer into year end closing print. Price action remains quite bullish with the backtest of the confluence area of last week’s 3620s-3630s. Bulls are going for year-end highs and bears are looking to change the trend by breaking support. The former has much more favorable odds due to the context of the market.
What’s next?
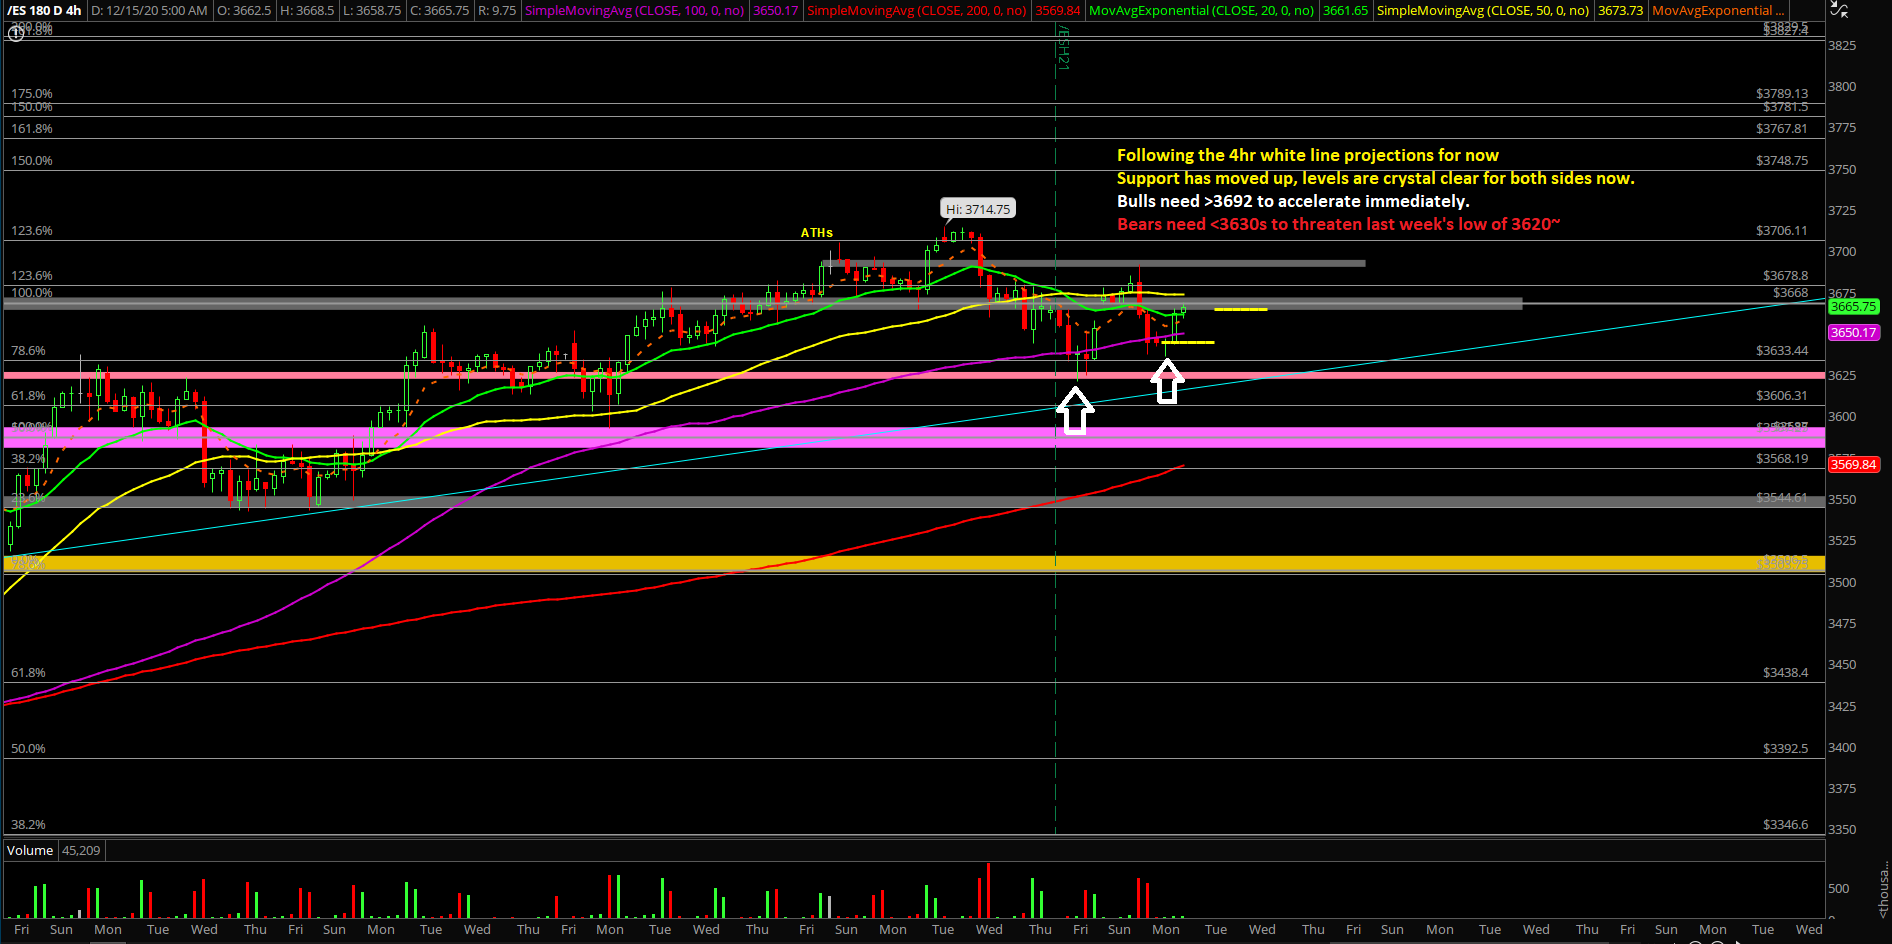
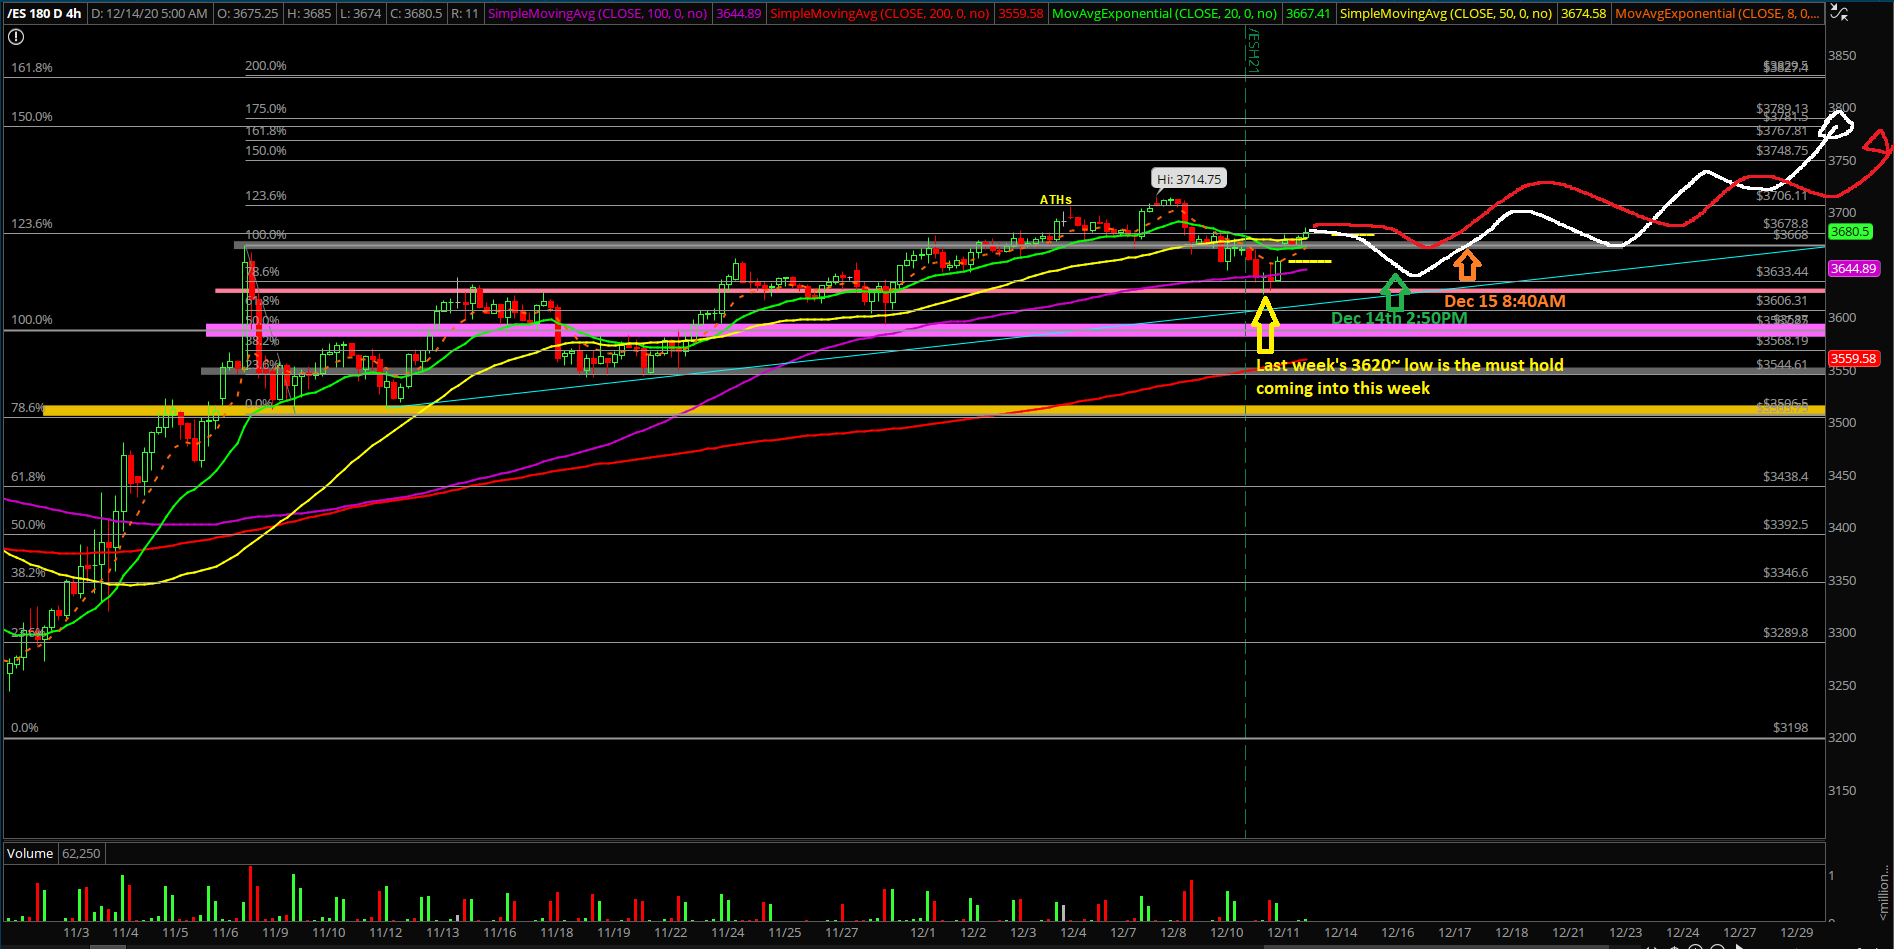
Monday closed at 3644.5 on the Emini S&P 500 (ES), around the lows of the support and right at round a key support level of ours. Nothing has changed, with the market following our 4-hour white line projection for now.
Summary of our game plan:
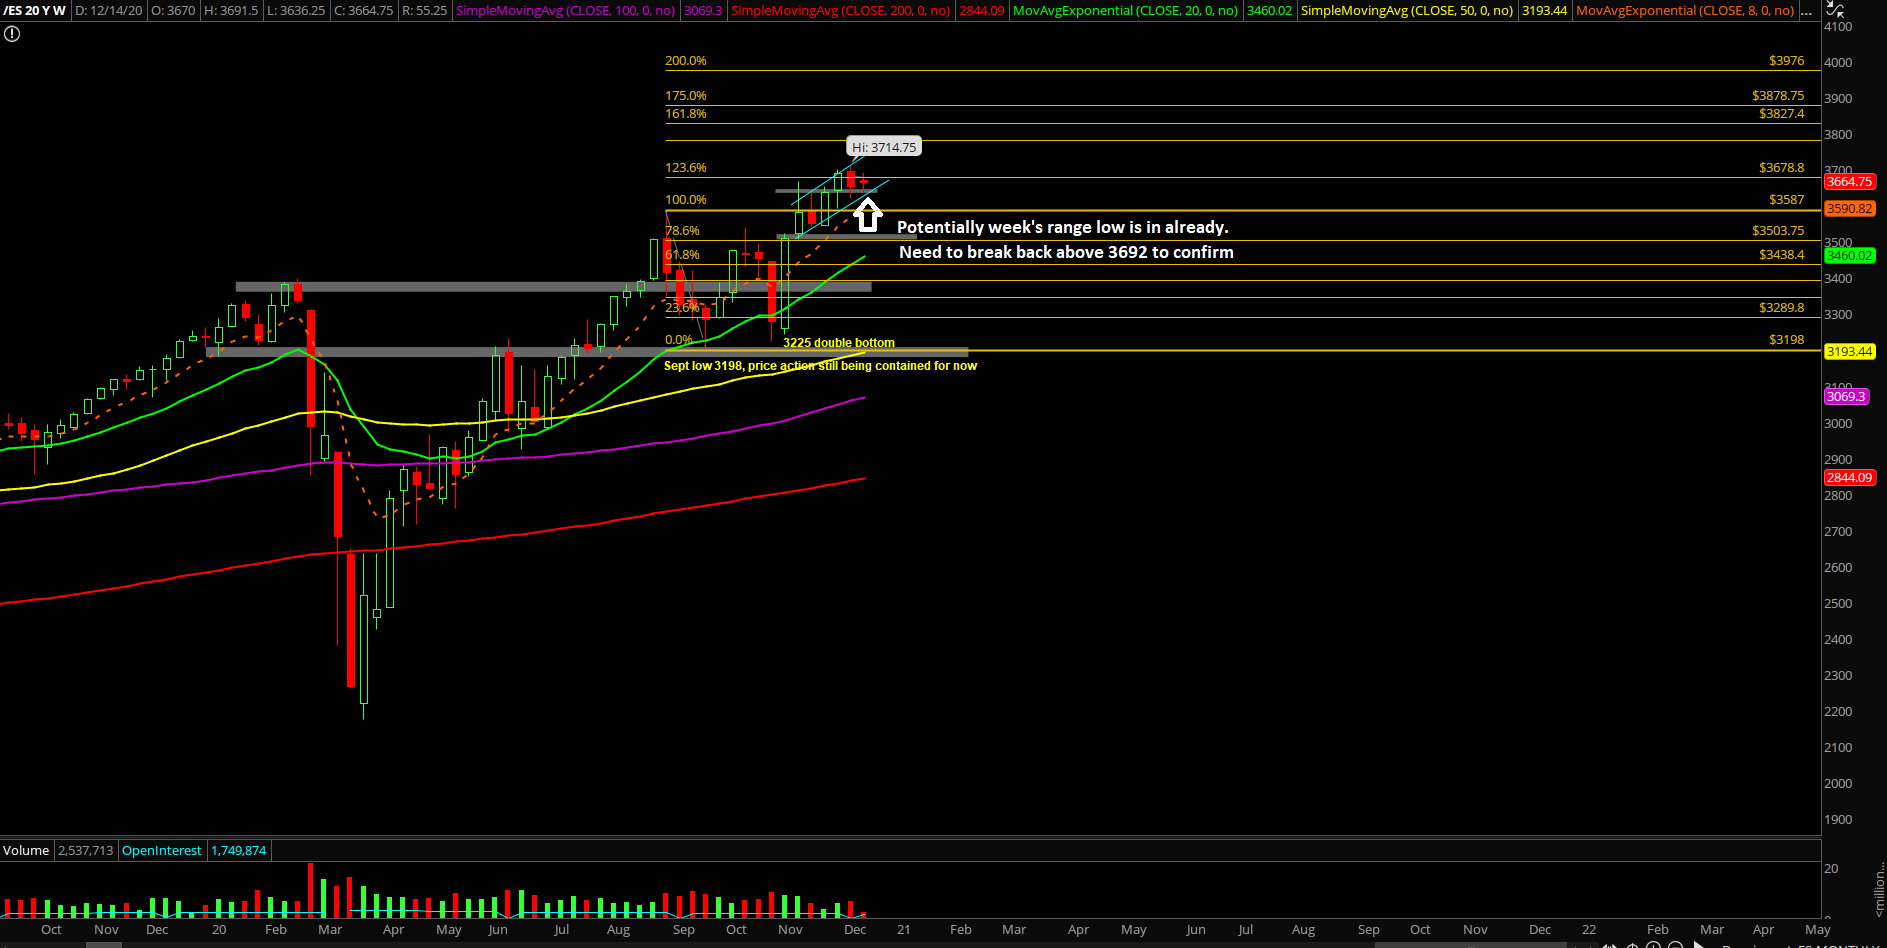
- Last week made new all time highs and then got rejected as a trend up week and became an inside week/consolidation for majority of the week.
- As of writing, the daily 20EMA bull train stick-saved last week, meaning no surprises as we head into head year end highs. If you recall, discussed this potential for many months since the April-May V-shape reversal setup as short-term momentum aligning with the bigger picture.
- Must hold support for this week is last week’s low of 3620.75.
- The higher immediate supports are located at 3635/3642/3652.
- Focus on higher low formations this week and be aware of more consolidation before new ATHs.
- A break above 3692/3715 would be the confirmation of immediate momentum ready for 3785-3800 immediate targets again.
- For bears, a break below 3635 followed by 3620 would open up 3592-3600 and then much lower levels.
- Market is following our 4-hour white line projections perfectly for now as yesterday produced the higher lows setup at the 78.6% fib retracement. Manage risk and know your timeframes.