Are We There Yet?
As any parent knows, when you go on a long drive, the kids are constantly asking you “are we there yet?” And, a pullback in the market seems to elicit the same sentiment.
Based upon the wave count I have on the 60-minute SPX chart, the S&P500 has been in a corrective structure for the last 9 weeks. And, if you have been listening closely to my expectations from last year, I was looking for at least a two-month pullback for our wave [4], which would take us into the first quarter of 2022.
You see, the wave 4 of [3], which is the 4th wave of one lesser degree, took a full month. So, I surmised that the 4th wave of one higher degree will likely take at least double the time. So, based upon this, we are there.
But, I do not think it is that easy. So, I am going to provide you with both sides of the argument as to whether we have bottomed, and you can make your own decision. I will also explain to you what I need to see to confirm that a bottom has indeed been struck.
In a perfect world, the market provides us with an a-wave pullback, followed by a b-wave counter-trend rally, and then a c-wave decline. The c-wave decline takes shape as a 5-wave structure. Now, I say that is what happens in a perfect world. The problem is that the world is not always so perfect. We are dealing with human emotions in the stock market, and it is not always easily discernable as to whether such emotions have reached the negative extreme needed at the bottom of a market decline.
In fact, since the March 2020 low, each and every pullback we have seen has provided us with an “unorthodox” bottoming structure. Specifically, it means that each c-wave bottom was not a clearly completed 5-wave c-wave structure. So, will this one be different?
In a standard 5-wave structure, I would be viewing this current rally as part of a wave iv corrective rally within the 5-wave c-wave, meaning that a lower low is to be reasonably expected. The reason I maintain such an expectation is two-fold. First, I can only count a solid 3-wave decline into our recent lows from the all-time high. Second, the rally off the low has begun in a very corrective looking manner. Therefore, the standard conclusion would be that we are still within a wave iv bounce. And, as long as the market respects the 4500-50SPX resistance, that is going to be my primary count.
But, the counter-weighing factor is that the market is now more oversold than we have seen since the lows struck in March 2020, with the NQ and other segments of the market hitting oversold levels that have matched the March 2020 lows. And, if momentum begins to build towards the 4500 region in the coming week, it is quite conceivable that such momentum may simply continue to push us past our resistance and into a wave 1 of wave [5] of [iii], thereby providing us with yet another unorthodox bottoming structure.
In the bigger picture, as I have outlined many times before, the market has been almost perfectly following our Fibonacci Pinball structure both in the very large time frames, as well as in this rally off the March 2020 lows.
Since the March 2020 lows, we had an almost perfect Fibonacci Pinball wave [i], followed by a very shallow wave [ii], which provided us with an unorthodox low to complete wave [ii]. Thereafter, we were able to set our target for wave 3 of [3] of [iii] at 4440-4600, and the market topped at 4554. We then expected a pullback to at least the 4270SPX region, with the market then bottoming exactly at that level in the futures, but, again, with an unorthodox bottoming structure. I then set our sights on out next target of 4882 as a minimum for wave 5 of [3] of [iii], and the market topped out in the 4820SPX region, coming about 60 points shy of our ideal target. Whereas I expected a 610-point rally off the wave 4 of [3] low, the market only provided us with 550 points, and 90% of my expectations.
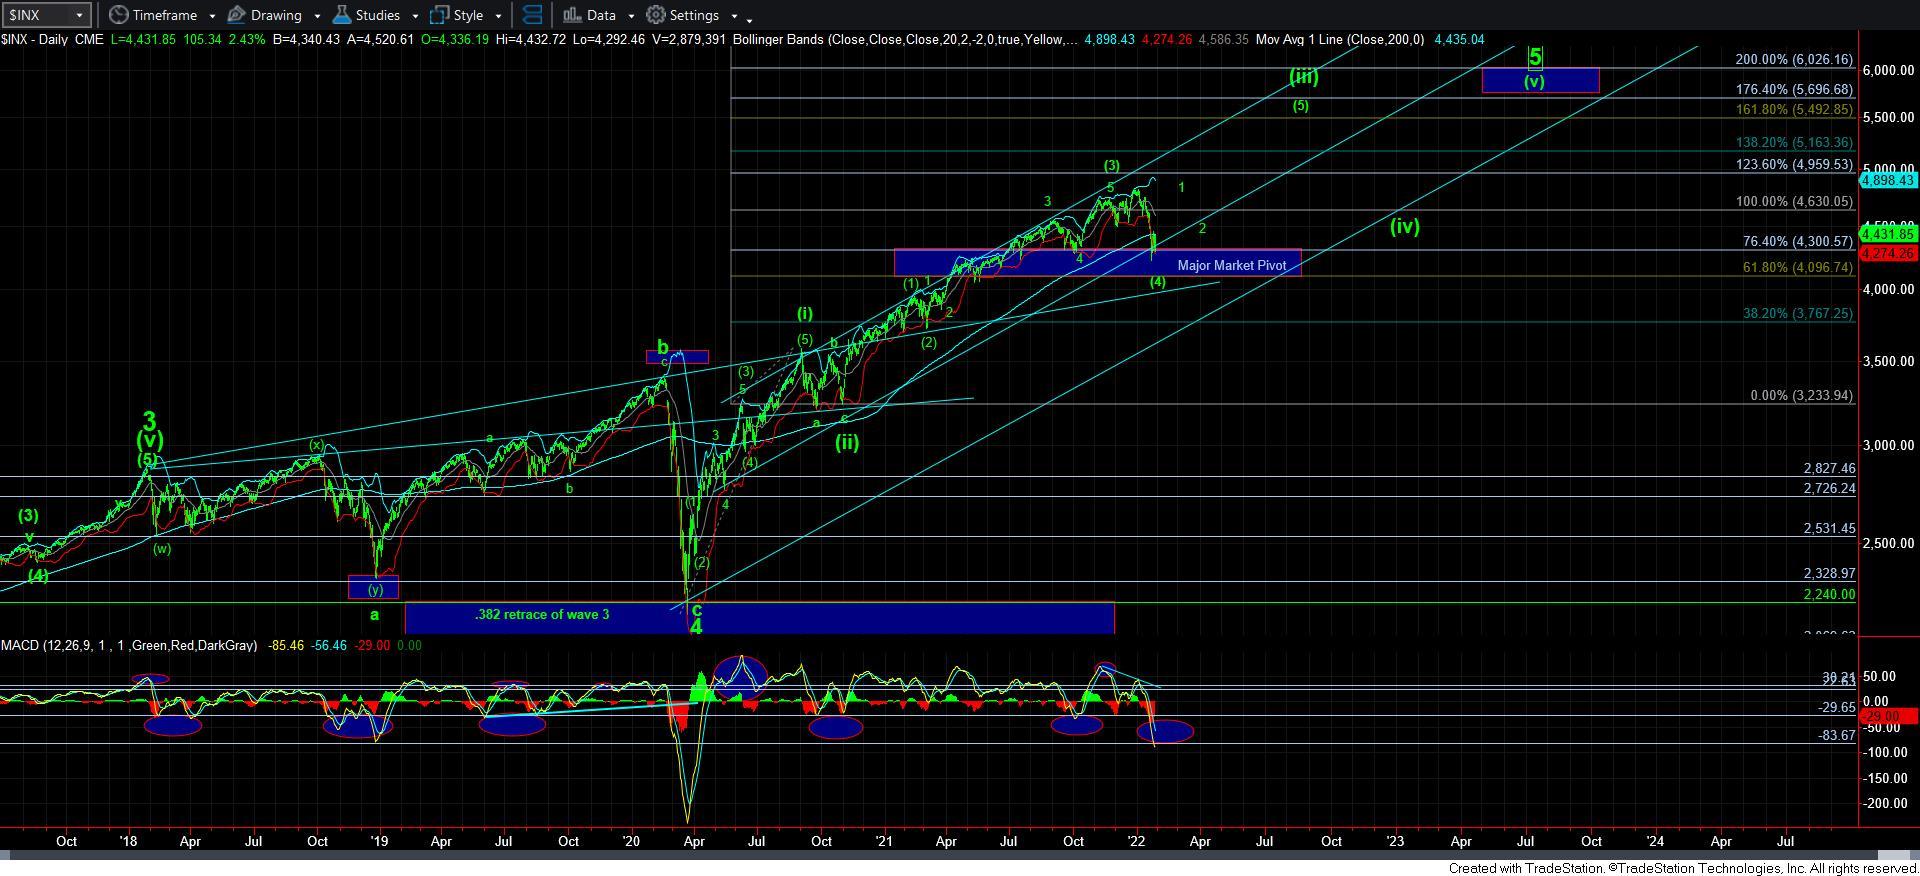
This brings us to where we are today. As we continued to rally in 2021 pursuant to our market expectations, and the market started off in the 3750SPX region, I reiterated that I expected the market to at least get to the 4600SPX region, and we clearly met that expectation. Since wave [3] of [iii] was expected to rally to the 1.00-1.236 extension of waves [i] and [ii], as you can see on our daily chart, that is exactly where wave [3] has topped. Thereafter, we expected a pullback into the first quarter of 2022 to re-test our Major Market Pivot.
For those that may be new, allow me to explain how that pivot, or any other pivot I outline, is derived. This brings me to a discussion of how the market is fractal in nature. That means that it is variably self-similar at all degrees of trend. Therefore, if we track a 5-wave structure at any degree, they will usually display the same proportions throughout the structure. To this end, we expect wave [3] of [iii] to rally through the .618-.764 extension of waves [i] and [ii] (which is what I classify as our “pivot”), and target the 1.00-1.236 extension, with wave [4] of [iii] traditionally pulling back to test that pivot from above in a corrective structure. A successful test of that pivot from above sets us up for the next phase of the bull market which will usually target the 1.618 extension of waves [i] and [ii] for our wave [5] of [iii]. These are the basics as to how our Fibonacci Pinball structure works, and it provides us with a very objective framework for Elliott Wave analysis, which has been considered as too subjective before the advent of our Fibonacci Pinball methodology.
Therefore, the market is now providing us with a c-wave within wave [4], which is clearly testing our Major Market Pivot from above. And, since we have at least 3 waves of the c-wave completed into that pivot, my reasonable expectation is that this wave [4] will likely complete in the coming week or two, if it has not already done so, with a successful test of our Major Market Pivot. And, yes, that even applies even if we see a spike just below the pivot followed by a strong reversal.
Moreover, if you will also take note of the MACD on the daily chart, you will see it has now become more oversold than any time since the March 2020 low. In fact, you will see it has even become more oversold than the low struck in late 2018, which then saw the market rally over 1000 points from that oversold condition. And, that is what I am expecting in our current situation, as my target for wave [5] of [iii] at the 1.618 extension of waves [i] and [ii] is 1300 points from the low we recently struck.
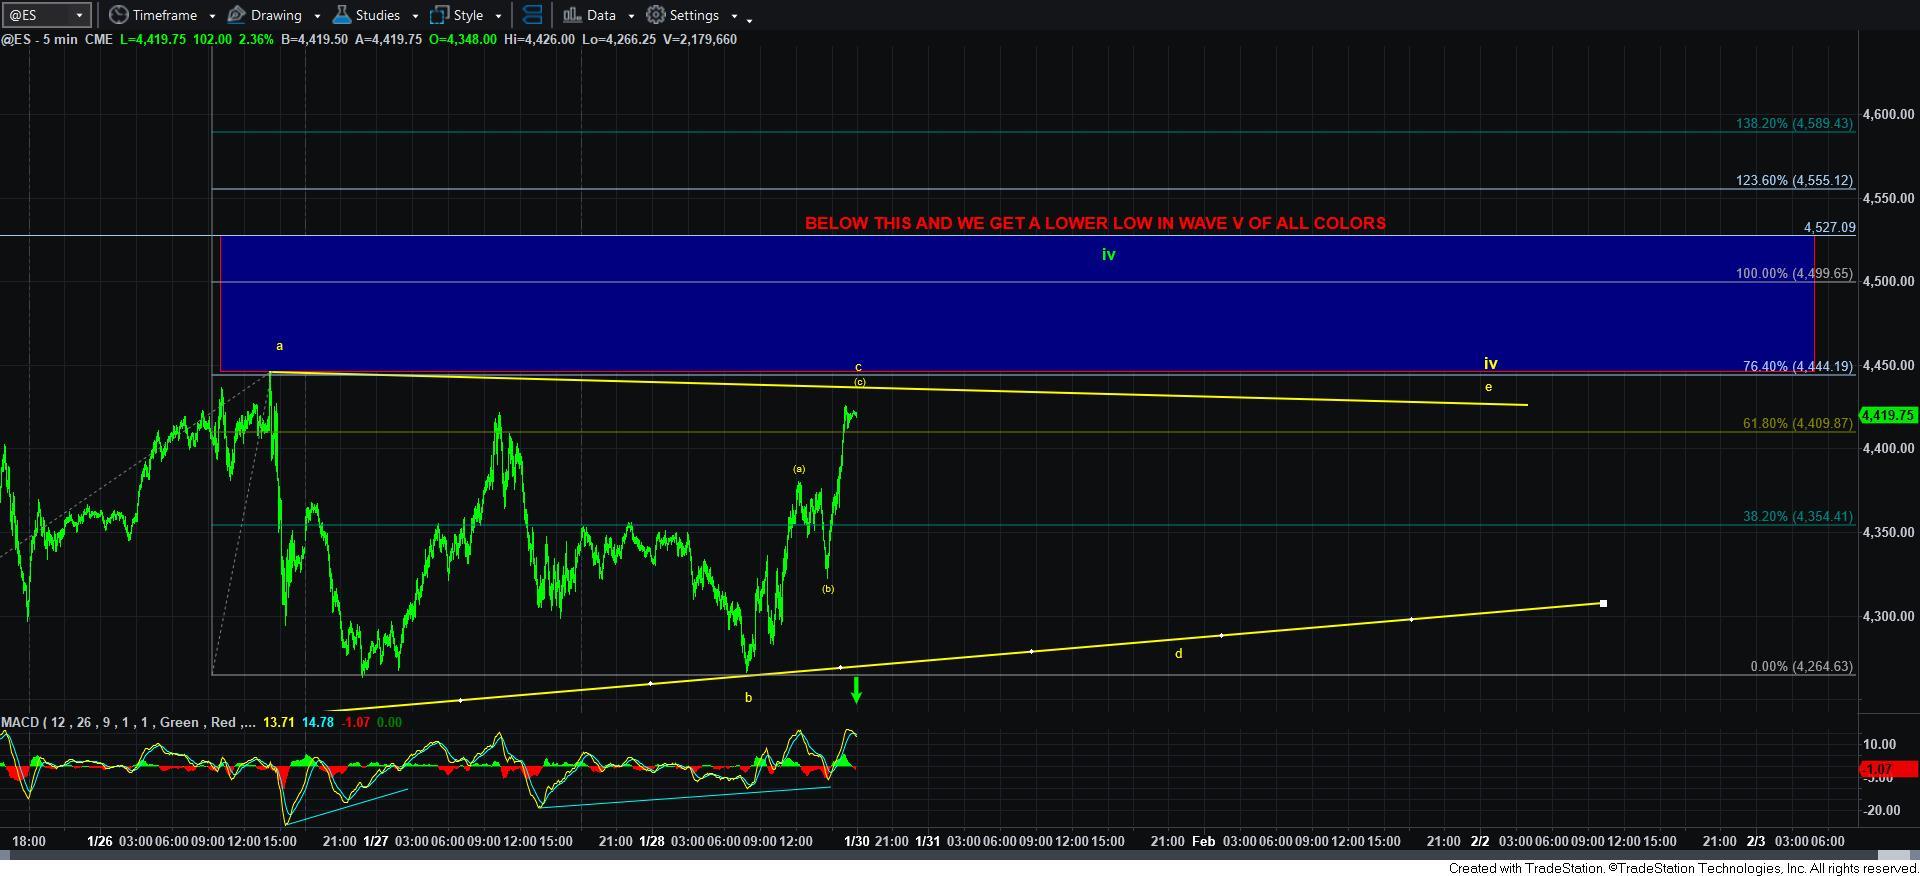
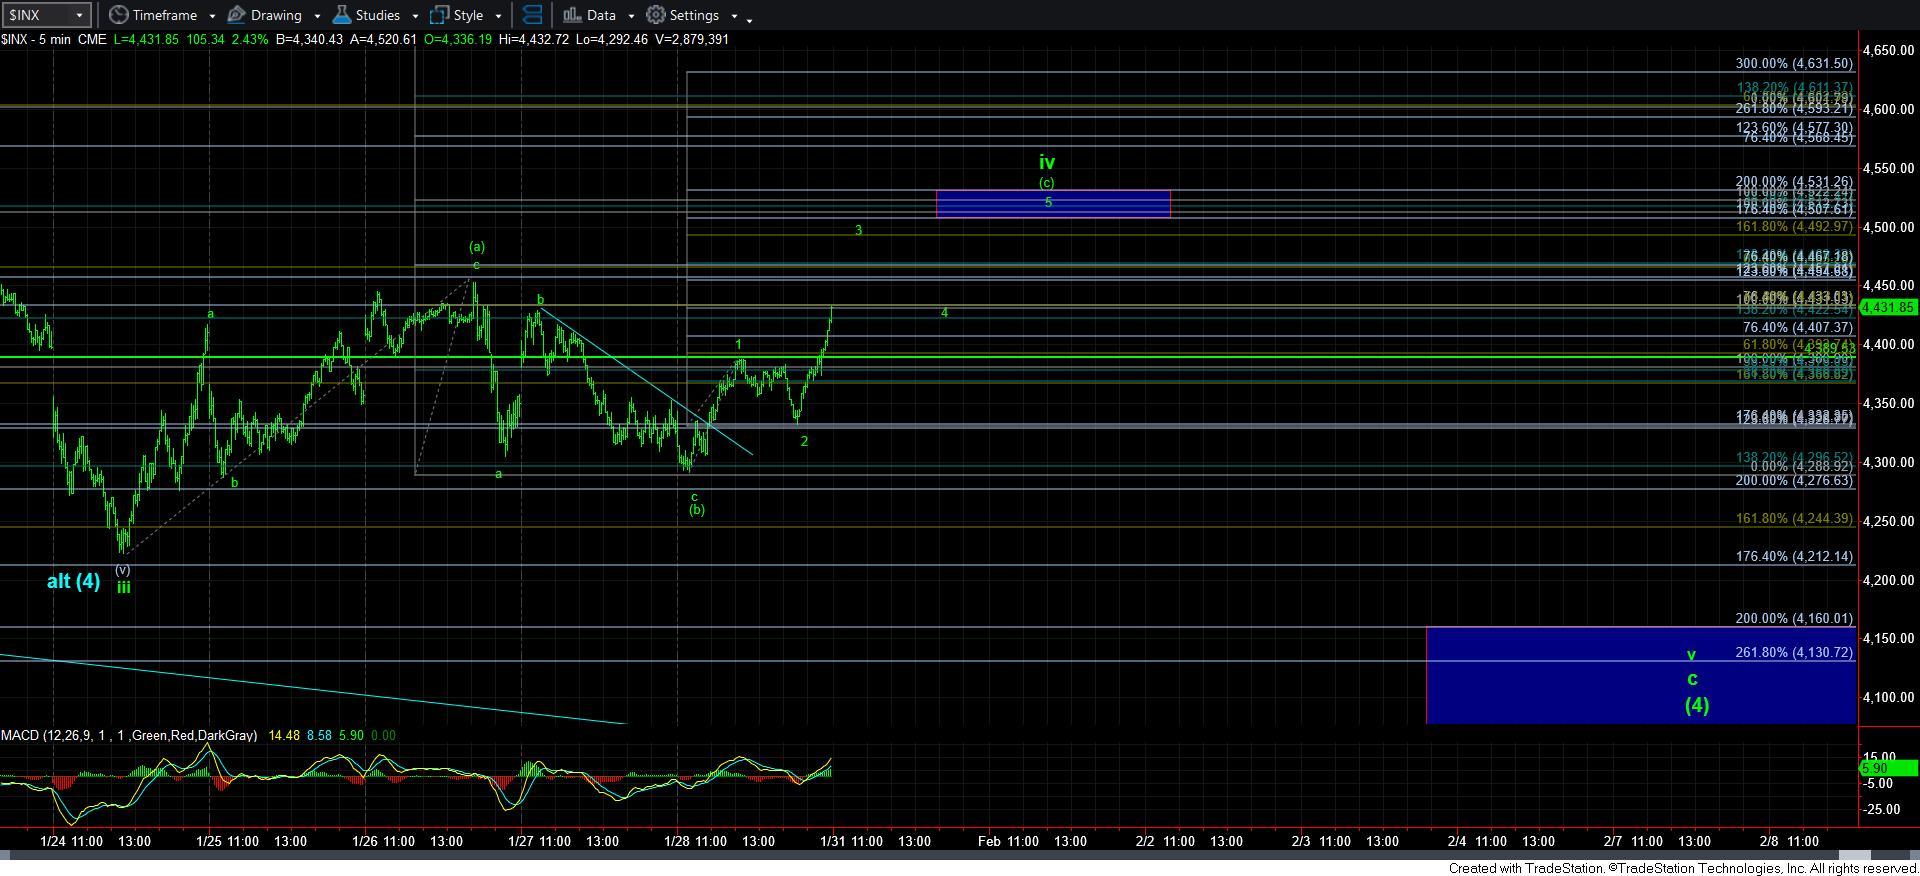
As far as an expectation for a lower low, we have resistance now at 4440ES for the possible 4th wave triangle I have been tracking this past week on the ES chart, followed by the 4509-4532SPX region for a potential [c] wave rally in wave iv, as outlined on the attached 5-minute SPX chart. I have changed that labeling to green now, as it was our former purple count. To be honest, the proportions between the a-wave and the rest of what I am tracking as the triangle potential are not at all ideal, which is why I have said this past week that I was slightly leaning towards this higher rally potential in the 4th wave taking us back up towards the 4500SPX region. But, I also want to note that there is potential for this triangle to morph into a b-wave wave triangle within this wave iv. I will reserve that count in the back of my mind for now, and will only bring it out if we turn down at the ES resistance early in the coming week.
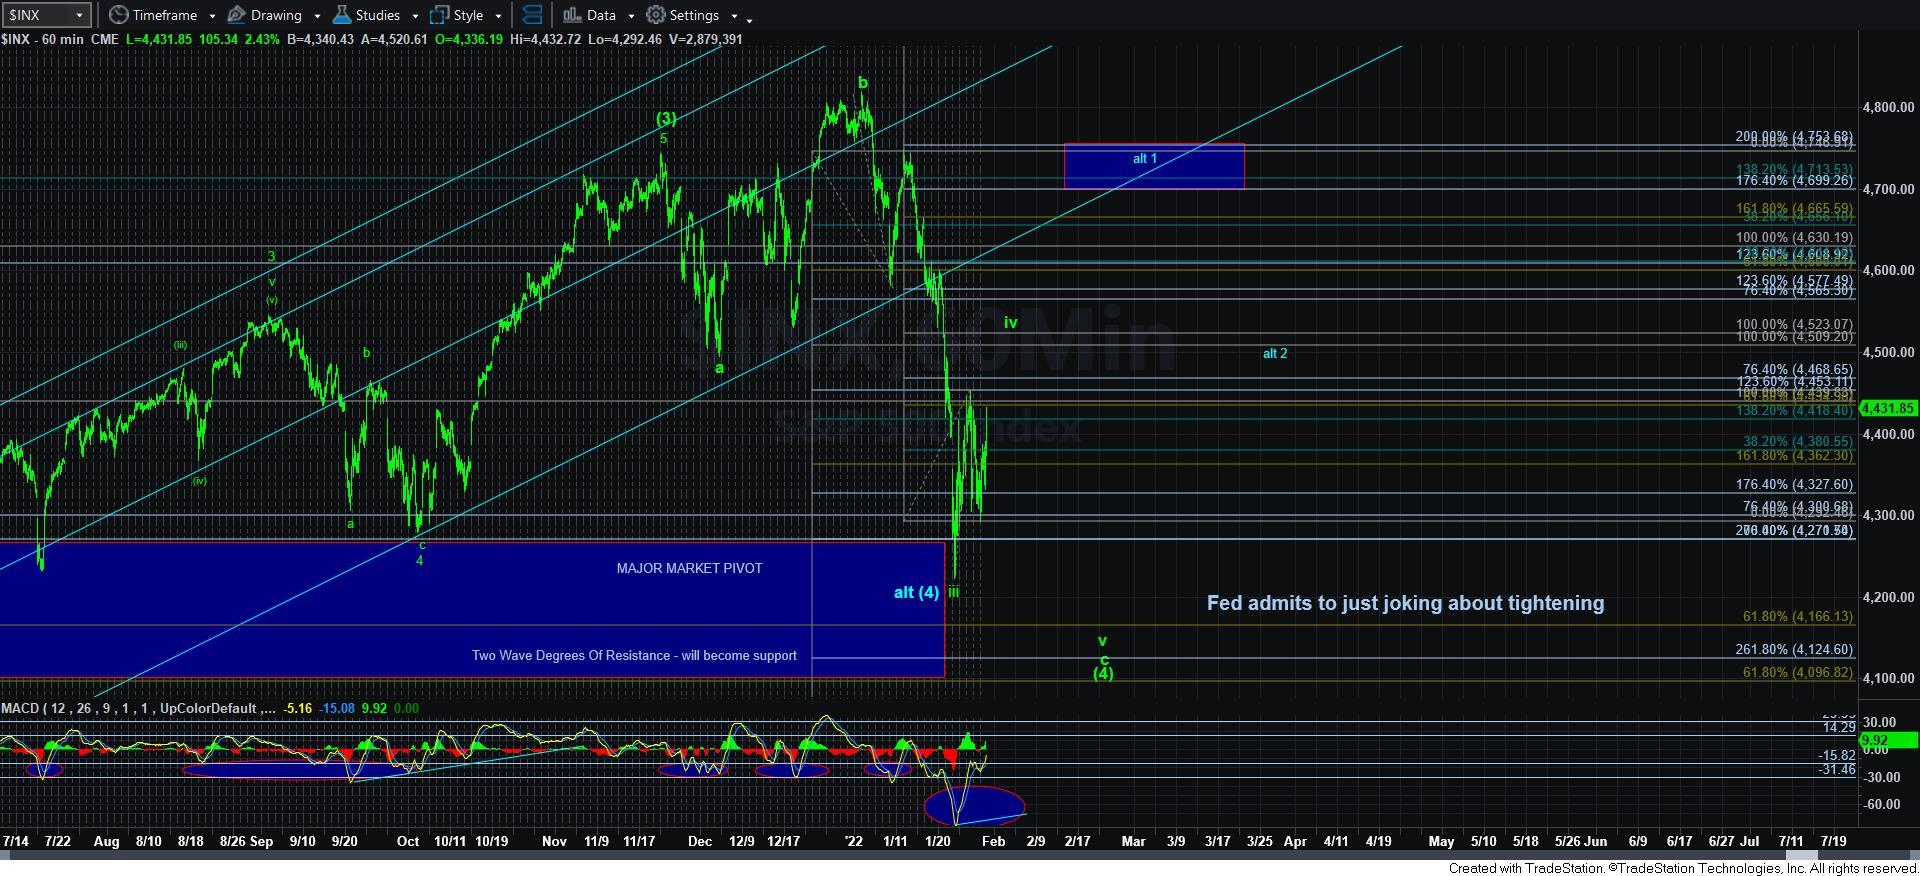
When we review the 60-minute SPX chart, we will see that the MACD on that time frame has rallied strongly off the recent bottom. Normally, we see this as our 4th wave rally takes shape. This sets us up for the lower price low we often see in the 5th wave of the c-wave, but with the MACD making a higher low, providing us with the positive divergence we often see during a bottoming structure.
But, again, it still brings me back to the thoughts of how extremely oversold the market has been. And, it would not be unreasonable to see the market blow past our resistance for wave 4 once momentum begins picking up in the rally towards the 4500SPX region.
This brings me to my final point, which I have outlined many times before. Based upon my experience, my personal trading plan suggests that I begin buying positions when I am seeing wave iii of the c-wave of an a-b-c correction completing. The reason is that sometimes we do not get that final 5th wave lower low when the market provides us with an unorthodox bottoming structure. And, should we get that final 5th wave lower low, I will still have cash to add to those positions. But, should we break out through resistance, then I will use the remaining cash to add to my long positions during the 2nd wave pullback. Therefore, I was noting in our chat rooms this past week that I was deploying the cash I raised near the market highs and buying various positions as we were striking the lows for wave iii. Again, this plan was derived based upon my own experience and many other trading plans may vary greatly. There is no one “right way” to buy for the next rally phase, and there will be other opportunities to add to your long positions. But, the wise manner in which you prepare for another rally is layering into positions rather than entering all at one time.
To this end, I want to again note that our StockWaves analysts have just published a list of 70 stocks which they see as bottoming out and preparing for a major rally over the coming year. For those that have been with us for some time, you would remember that they came out with similar lists as we were bottoming in March of 2020, and then again in the fall of 2020. Those stocks went on to see huge gains in the months thereafter.
So, my overall suggestion to those reading my analysis is that this is a great time to add to your long positions as the market seems to be forming a bottoming structure and preparing for the next rally towards our ideal target in the 5500SPX region. Should we see a lower low in wave v of the c-wave of wave [4], it will allow you to buy additional positions in the coming weeks. And, if we break out directly towards the prior market highs in wave 1 of [5] of [iii], then you can always buy additional positions in the wave 2 pullback thereafter.
The main point I want you to come away with is that we outlined our expectation last year that wave [4] of [iii] will likely take us down towards our Major Market Pivot in the first quarter of 2022. Currently, it is likely that we are completing wave [4] of [iii] well within the standards of our Fibonacci Pinball structure, and my expectation remains that we will likely be rallying to new market highs in wave [5] of [iii] towards 5500SPX as we move into the 2nd quarter of 2022 and beyond.